Methods for SAR visualization
Dagmar
Stumpfe
and
Jürgen
Bajorath
*
Department of Life Science Informatics, B-IT, LIMES Program Unit Chemical Biology and Medicinal Chemistry, Rheinische Friedrich-Wilhelms-Universität Bonn, Dahlmannstr. 2, D-53113, Bonn, Germany. E-mail: bajorath@bit.uni-bonn.de; Fax: +49-228-2699-341; Tel: +49-228-2699-306
First published on 23rd November 2011
Abstract
There has been steadily increasing interest in the systematic analysis of structure–activity relationship (SAR) information contained in compound data sets of different size, composition, and origin. In this contribution, we provide an overview of SAR analysis in medicinal chemistry and review computational approaches of different design and sophistication that make it possible to analyze SARs on a large scale. Special emphasis is put on recently introduced SAR visualization methods that are expanding the scope of traditional SAR analysis in medicinal chemistry.
Introduction
SAR analysis of small molecules is one of the most important tasks in medicinal chemistry.1 One of the major focal points of SAR analysis is the lead optimization process. In the course of lead optimization, chemical modifications are made to selected active compounds in order to generate series of analogs (sharing a common framework). From the SAR behavior of different analogs molecular regions are deduced that are most important for a specific biological activity. Modifications are typically made at multiple sites, involving the introduction of different functional groups (R-groups), with the aim of increasing compound potency and improving other molecular properties such as solubility or metabolic stability. Ideally, one would like to thoroughly rationalize the SAR of a compound series such that specific chemical changes can be designed and introduced that lead to a predictable progression towards high (low nanomolar) compound potency. However, in practice, this is rarely accomplished. If analogs with different potencies are generated during the initial stages of an optimization project, it is often attempted to guide further synthetic efforts with the aid of computational quantitative SAR (QSAR) models.2QSAR models have been developed since the 1960s and generally assume the presence of linear relationships between structural changes in compound series and biological responses. In order to build such linear models, active compounds must be represented as combinations of numerical molecular property descriptors. Of course, the assumption of such linear relationships might often be only a crude approximation. Once QSAR models are derived on the basis of known analogs and their measured potencies, it is attempted to predict further chemical changes that would yield increasingly potent compounds, essentially following a predicted linear path up to high potency levels. Regardless of the approaches that are utilized to aid in the lead optimization process, its ultimate goal is the generation of pre-clinical or clinical candidate compounds, which requires the optimization of multiple properties in addition to compound potency.While SAR analysis is central to the lead optimization process, it also plays a critical role at earlier stages of medicinal chemistry projects and at the interface between medicinal chemistry and biological high-throughput compound screening (HTS).3 In order to obtain interesting active compounds for further chemical exploration, hits are usually selected from HTS campaigns, which is common practice in the pharmaceutical industry. From typically large numbers of structurally diverse and mostly weakly potent screening hits, also containing false-positives, small sets of compounds must be prioritized as alternative starting point for so-called hit-to-lead investigations, which precede the lead optimization stage when the most promising active compound(s) are further explored. During hit-to-lead projects, analogs of initially identified hits are generated and their activities are determined. A key task of chemistry efforts during hit-to-lead stages is the generation of limited numbers of analogs to demonstrate that one or more active compounds (representing different structural classes or chemotypes) exhibit sustainable SARs, which is a major criterion for the selection of candidates for subsequent lead optimization. To demonstrate preliminary SAR behavior, primary screening data present the major source of information. While the potency and structural diversity of screening hits are typically considered as criteria for hit selection, hits might often belong to series of structurally similar or analogous compounds that are present in screening libraries (for example, originating from combinatorial chemistry efforts). Hence, analyzing structural neighbors of hits that are more or less potent (or inactive) might already reveal preliminary SAR characteristics and thus help to shortcut hit-to-lead investigations.
Taken together, we can conclude that SAR analysis plays a crucial role at different stages of medicinal chemistry projects, also including its interface with HTS. Furthermore, SAR exploration is carried out at different levels of complexity. As discussed in the following, alternative computational approaches have been introduced, in addition to those based on the classical QSAR paradigm, to support SAR analysis in different ways.
How are SARs studied in medicinal chemistry?
During lead optimization, SAR analysis has traditionally been carried out for one compound series at a time, which is the most common approach to this date. Medicinal chemists are primarily trained to judge about compounds, their properties, and structure–activity information on the basis of 2D molecular graph representations, the conventional way to display synthetic molecules. To represent a series of analogs, the invariant part of these compounds, their core structure or framework, is drawn and one or more substitution sites at which different R-groups are considered are marked, as illustrated in Fig. 1. For medicinal chemists, the most familiar format to organize and analyze analog series is a so-called R-group table that contains the core structure of a given series of analogs with labeled substitution sites, tabulates available R-groups at each site in different columns, and reports the potency of the corresponding analogs, as shown in Fig. 1. On the basis of R-group tables, SAR trends are evaluated, essentially focusing on the key question of lead optimization, i.e., which compound(s) to synthesize next?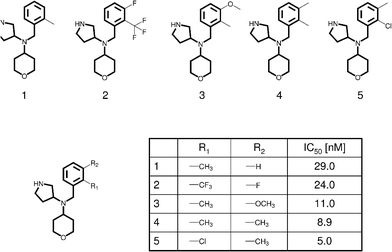 | ||
| Fig. 1 R- group table. For a series of serotonin transporter inhibitor analogs (taken from BindingDB50) that are distinguished by substitutions at one of two or two sites (R1 and R2), an R-group table is shown. The shared molecular framework (scaffold) is drawn with thick edges. | ||
As long as analog sets are relatively small and the number of alternative substitution sites is limited to a few, e.g., one to three, SAR trends can often be deduced from R-group tables and new active analogs predicted. Here, chemical experience and intuition usually play a key role. However, as analog series grow in size, the “classical” and essentially subjective way to analyze SARs on the basis of R-group table information quickly reaches its limits. How many analogs might we be able to compare as individuals with a trained chemist's eye to recognize SAR trends? Probably tens or more, but certainly not hundreds or thousands. It has been shown that judgment about important molecular characteristics such as drug-likeness is highly variable among experienced medicinal chemists when compound collections are inspected (as lists of molecular graphs).4 Moreover, our judgment in such situations is usually context-dependent, i.e., an individual often draws different conclusions about a given compound when the ordering in a list is changed.4 Thus, subjective evaluation becomes quickly unreliable or infeasible once data sets substantially grow in size. This “numbers game” explains, to a large extent, the interest in utilizing computational models for SAR analysis. During lead optimization, QSAR models are often utilized when a sufficiently large number of analogs is available as training data. However, as discussed in the following, the need to explore SAR information using computational concepts and tools goes well beyond individual compound series and the applicability domain of QSAR modeling.
Different facets of SAR information
In addition to the exploration of individual analog series, which represents a major SAR analysis paradigm, SAR information can be extracted from compound data sets of different composition, size, and origin. Then, the focus changes. When studying analog series, one is primarily interested in identifying substitution sites that are important for activity and in introducing R-groups at these sites that have favorable effects on potency progression or other molecular properties. However, once we go beyond individual series of active compounds and study data sets that are structurally diverse and large in size, the goals and requirements of SAR exploration fundamentally change. In these instances, one is primarily interested in identifying and extracting SAR information that might be available in the compound data and in focusing on compound subsets that might be most interesting from an SAR perspective.But what are the origins of such data sets and what is one specifically interested in? In pharmaceutical environments, sets of active compounds directed against high-profile targets, e.g., different protein kinases or G protein coupled receptors, usually evolve over time. Active compounds become available from subsequent HTS campaigns at different points in time and are subjected to hit-to-lead efforts, lead candidates are explored and series under investigations are often not further pursued when a project hits a roadblock. Then, alternative starting points are considered, new lead candidates are put forward, and so on. Often, multiple medicinal chemistry teams are involved in cycles of compound exploration and optimization over time, focusing on different candidates. Data sets originating from such projects typically consist of compounds at rather different stages of development, ranging from initially selected hits and compound sets for which preliminary SAR information has been collected to more or less extensively explored analog series. It is not uncommon that such data sets contain many different structural classes and hundreds or thousands of active compounds. Hence, one is often interested in retrospectively studying such heterogeneous data sets and exploring available SAR information in context, which might help to better understand which compounds to prioritize going forward. For example, potential lead candidates might not have been followed-up on during earlier rounds, for one reason or another, and could be revisited. On the other hand, structural classes similar to current compounds of interest might have already been extensively explored, with only limited success. Such questions often govern retrospective SAR analysis efforts on evolving compound data sets. In these cases, one is not primarily interested in identifying SAR determinants for an individual compound series. Rather, one would like to understand which compound series carry most, or most interesting, SAR information.
In this context, searching for SAR discontinuity1,5 usually becomes a major focal point. Compound series are characterized by a high degree of SAR discontinuity if small chemical changes lead to significant potency alterations. Pairs or groups of structurally very similar compounds with dramatic potency differences form activity cliffs5,6 that represent the extreme form of SAR discontinuity. Within large and structurally diverse data sets, compound subsets forming such locally discontinuous SARs are generally associated with high SAR information content and thus a prime target for SAR investigation. By contrast, structurally increasingly diverse compounds might retain comparably high potency, which corresponds to SAR continuity. Compound subsets might form “flat” SARs when many structural changes do not lead to notable increases in potency, which represents an extreme form of SAR continuity. This very SAR phenotype is usually most disliked in medicinal chemistry because it is often not evident during optimization efforts whether an SAR is essentially flat or evolvable. Consequently, by far too many analogs might be generated before the decision is reached to abandon a particular series. In such situations, SAR analysis is challenged with helping to answer another key question in medicinal chemistry, i.e., when should one stop exploring a given series?
In addition to evolving compound collections, sets of hits from HTS efforts are also an attractive target for SAR analysis. In these instances, the focus changes yet again. Hit sets from large HTS campaigns might also consist of hundreds or even thousands of structurally diverse and predominantly weakly potent compounds. Here, the key task is to decide which hits to prioritize for further chemical exploration and hit-to-lead investigations. For this purpose, the presence of preliminary SAR information in sets of structurally related compounds usually is a prime indicator for the potential to further evolve and optimize SARs, even if molecules displaying such SAR trends are not the most potent hits identified in a screen.
Regardless of whether one considers evolving compound data sets or primary HTS hits, in these cases, SAR analysis has large-scale character and typically aims at the systematic extraction of available SAR information, which depends on the application of computational approaches and brings along specific methodological requirements.
Large-scale SAR exploration
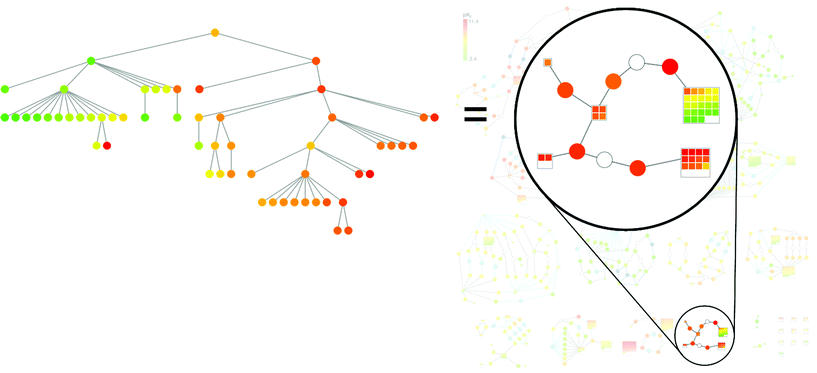
The systematic search for SAR information in large data sets usually does not involve the derivation of predictive SAR or QSAR models. Rather, this task represents a typical data mining problem, which is addressed using statistical or compound classification methods. Nevertheless, compound classification studies might be carried out making a priori assumptions concerning desired or undesired SAR characteristics. For data mining, compound sets must generally be placed into chemical reference spaces. This requires the calculation of arrays of descriptors of molecular structure and properties for test compounds.7 A set of descriptors defines a reference space into which compounds are projected on the basis of their descriptor values (coordinates) and where distances between compounds are calculated as a measure of dissimilarity (i.e., the larger the distance, the more dissimilar the compounds). Alternatively, similarity and potency relationships between molecules might be systematically assessed in a pair-wise manner for an entire data set, and these relationships must then be accounted for and displayed in a manner that reveals SAR information. In data mining, statistical and graphical techniques often complement each other. Moreover, for systematic SAR analysis, advanced SAR visualization tools have been introduced to provide an intuitive access to local SAR information. In the following, statistical and graphical methodologies will be presented. Fig. 2 schematically illustrates alternative approaches discussed in the following that provide access to SAR information in different ways and at different levels of resolution.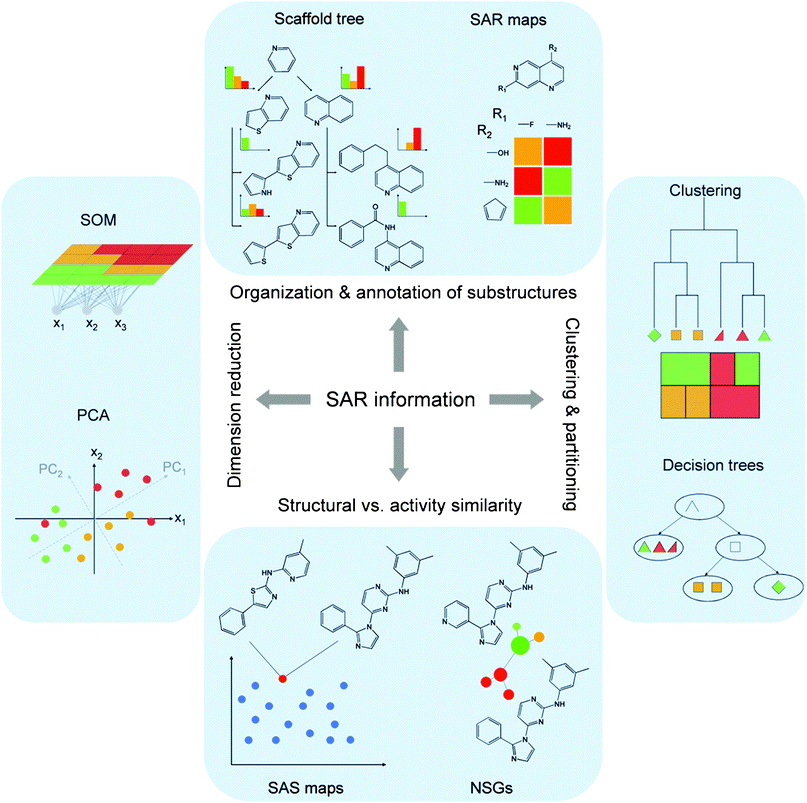 | ||
| Fig. 2 Analysis of SAR information. Representative computational approaches that are applied to access SAR information in different ways, as discussed in the text, are schematically illustrated. The figure has been adapted from ref. 51. | ||
Standard methods
In order to organize a set of active compounds for which structural and/or property descriptors have been calculated and investigate the structural environment of selected molecules, clustering8 or partitioning9 methods are conventionally applied. The principal difference between clustering and partitioning algorithms is that the former rely on pair-wise comparisons of objects and the quantification of similarities, whereas the latter map compounds into pre-defined descriptor coordinate spaces or divide and organize them on the basis of pre-defined criteria, thereby alleviating the need for pair-wise (similarity) comparisons. Thus, compared to standard clustering methods, partitioning can generally be applied to larger data sets. Recursive partitioning10 is often used to divide compound sets along decision tree structures where series of descriptor value-based decisions are made in subsequent steps in order to group compounds together that have similar activity or other properties. Pathways through decision trees that lead to compound subsets having, for example, a specific biological activity are then translated into sets of rules that can also be applied to query databases for new active compounds.Clustering methods are routinely applied to HTS hit sets in order to group structurally diverse hits into subsets (clusters) of similar ones and inspect the structural neighborhood of the most potent hits. Cluster analysis is usually carried out in combination with statistical techniques11 to quantitatively characterize potency distributions, determine background activity levels, and help to eliminate false-positive detections. Such hit triaging efforts aim at the selection of hits for secondary assays and, ultimately, hit-to-lead investigations. The results of structural classification and statistical analysis are typically displayed in simple graphical representations such as dendrograms or scatter plots.
Another standard approach to analyze sets of active compounds is dimensionality reduction of chemical reference spaces and mapping onto 2D graph representations. In such simplified space representations, compound distributions can be easily analyzed. The trade-off is the loss of chemical information that is associated with simplifying and mapping of reference spaces. For dimension reduction, statistical methods such as principal component analysis (PCA)12 or multi-dimensional scaling (MDS)13 of originally defined property spaces can be applied or, alternatively, self-organizing maps (SOMs)14 can be generated through neural network simulations. Using SOMs, compound sets are projected onto 2D neuron grids where similar compounds map to the same or adjacent neurons. Especially for the analysis of HTS data, software has been developed15,16 to generate different types of plots for clustering results or chemical space projections and annotate data points (compounds) with activity or other property information. For series of active compounds, it is then attempted to deduce SAR information by comparing data points in various types of diagrams that convey structural and/or activity information in different ways.
Regardless of whether HTS or compound optimization data sets are analyzed or whether compound classification or dimension reduction methods are applied, all standard approaches have in common that prioritized active compounds must be manually selected and compared to derive SAR information. This often makes SAR analysis an arduous task, especially when data sets are large.
Substructure organization
Going beyond compound classification approaches, substructure or scaffold17 populations can also be derived from active compounds, systematically organized, and annotated with activity information. In this context, structural or substructure relationships are often defined in rather different ways. For example, extensions of conventional R-group tables might be utilized such as SAR maps18,19 that arrange analogs in matrices where each cell represents a unique combination of R-groups at two substitution sites. Cells are color-coded according to analog potencies. A restriction of such matrix-based analog displays is that only a subset of a series can be displayed if analogs have replacements at more than two substitution sites. A more comprehensive structural organization of analog series is provided by Combinatorial Analog Graphs20 that systematically divide analogs into subsets according to different substitution site combinations, following determination of maximum common subgraphs and R-group decomposition. In the resulting graph representation, analog subsets are assigned to nodes that are connected if they share one or more substitution sites. In these representations, nodes representing substitution sites or combinations that introduce high SAR discontinuity become immediately apparent. However, also in this case, analogs associated with the corresponding nodes must be manually selected and compared.Although primarily designed for whole molecules, rather than substructures or scaffolds, Reduced Graphs21 also provide a systematic grouping of compounds according to topological features and chemical functionalities. These representations simplify conventional molecular graphs by further abstracting from chemical features and hence induce a degree of fuzziness. Comparison of simplified graph representations for series of active compounds makes it frequently possible to identify structural patterns that are responsible for SAR trends.
In addition to R-group/core structure assessment, molecular scaffolds are also used as a basis for structural classifications to explore active compounds and identify structural motifs that are responsible for a specific biological activity. For example, scaffolds have been organized according to defined substructure or topological relationships22 and arranged in activity-oriented sequences or pathways.23 Furthermore, scaffolds from bioactive compounds have been iteratively decomposed into substructures following chemical rules.24Decomposition pathways define a structural hierarchy termed Scaffold Tree.24 Substructures are annotated with the activity information of the compounds they originate from. Hierarchical structural decomposition of a compound activity class might yield substructures that are not yet found in bioactive compounds, which provides a basis for activity prediction.25 In addition, libraries of substructures that are often found in pharmaceutically relevant compounds are also used for activity annotations,26 which makes it possible to detect substructures that occur in compounds with defined potency or other molecular property ranges. Furthermore, a scaffold-oriented hierarchical organization of active compounds has been combined with R-group tables to study potency distributions of compounds and corresponding molecular scaffolds.27
Structure–activity similarity
Compared to compound classification and substructure annotation approaches, a more direct access to SAR information is provided by methods that systematically compare similarity and potency relationships between compounds. For this purpose, Tanimoto similarity28 of chosen molecular fingerprint representations7 is usually calculated, i.e., fingerprints are generated for all compounds and (bit string) overlap between pairs of fingerprints is quantified as a measure of molecular similarity. Activity similarity can be expressed, for example, by pair-wise compound potency differences normalized relative to the potency range present in a data set.29 Pair-wise similarity and potency comparisons were originally displayed in Structure–Activity Similarity (SAS) maps,29 2D graph representations where one axis reports structural and the other activity similarity. In SAS maps, each data point represents a pair-wise compound comparison and the graph reveals subsets of compounds with high structural and low activity similarity, indicating the presence of SAR discontinuity and activity cliffs, or subsets of compounds with high activity and low structural similarity, indicating the presence of SAR continuity. Different variants and extensions of SAS maps have been reported.30–32 Among these are 3D extensions of SAS map that add pair-wise similarity of another molecular property as a third dimension to the comparison of structure and activity similarity. Graphical representations that compare structural and potency relationships between compounds are an expression of the ‘activity landscape’5 concept, which helps to rationalize SAR features in compound data sets, for example, by delineating regions of SAR discontinuity or continuity. In general terms, an activity landscape can be defined as any representation that integrates the analysis of structural similarity of and potency differences between compounds sharing the same biological activity,5 and a variety of 2D and 3D landscape representations have been introduced.5,33Numerical functions capturing pair-wise compound similarity and potency comparisons have also been developed to quantify SAR features including the SAR Index (SARI)30 and the Structure–Activity Landscape Index (SALI).34 SARI combines two score components accounting for SAR discontinuity and continuity, respectively, yielding a normalized composite score between 0 (maximal discontinuity) and 1 (maximal continuity). Intermediate SARI scores characterize heterogeneous SARs that combine continuous and discontinuous SAR features.30 SARI scores can be calculated as an SAR diagnostic of an entire compound set (i.e., describing a global SAR phenotype) or as local scores for a subset of compounds (e.g., a cluster), quantifying a local SAR. For single compounds, a local discontinuity score can be calculated (using a slightly modified version of the SARI discontinuity score component) to assess individual compound contributions to SAR discontinuity. SALI scoring only emphasizes pairs of structurally very similar compounds with large potency differences and is thus designed to detect activity cliffs in a data set. Therefore, pairs of compounds can be ranked according to their SALI scores in order to identify prominent activity cliffs and represent the entire spectrum of cliffs of varying magnitude that are present in data sets.
SAR networks
In recent years, molecular network representations have become increasingly popular to visualize SAR characteristics of compound data sets. One reasons for the interest in these types of representations is that networks or network-like graphs often provide an intuitive visual access to SAR features, more so than data sets statistics, conventional data plots, or R-group tables. Different design philosophies have been followed in conceptualizing such SAR networks. In the following, selected examples will be presented. It is important to note that these SAR networks are generally not based on pre-conceived SAR models.One network prototype is provided by the activity cliff-centric SALI graphs.34 A schematic representation is shown in Fig. 3. Here, nodes represent compounds and directed edges are drawn between them (from the less to the more potent compound) if a pre-defined SALI threshold is reached. Thus, SALI graphs can be generated as a ‘sliding window’ through a data set to monitor activity cliffs of increasing magnitude. At high threshold levels, the representation focuses on the most prominent cliffs. The SALI graph reveals individual activity cliffs, pair-wise cliff sequences, and more complex cliff patterns formed by subsets of compounds.
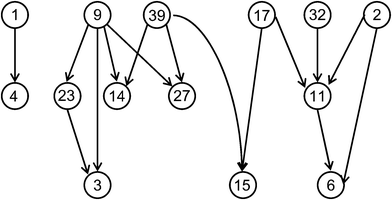 | ||
| Fig. 3 SALI graph. A schematic representation is shown. Nodes are labeled with compound numbers. Edges indicate activity cliffs of pre-defined magnitude. | ||
A conceptually different network prototype is displayed in Fig. 4. In this case, nodes also represent compounds but (undirected) edges represent pair-wise similarity relationships (calculated Tanimoto similarity), rather than activity cliffs. Furthermore, different from SAS maps, potency information is in this case not captured through pair-wise compound comparisons, but by annotation of nodes applying a color spectrum that represents the potency range in a data set. This type of annotated similarity-based compound network provides the basis of the SAR networks described in the following. In these networks, nodes are usually directly associated with compound structures, thus enabling interactive analysis.
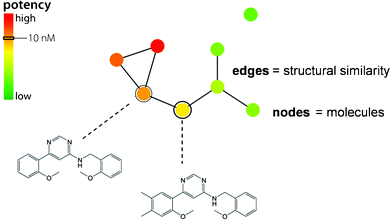 | ||
| Fig. 4 Similarity-based compound network. A prototypic annotated compound network is shown that provides the basis for different types of SAR network representations. | ||
In Fig. 5, a Network-like Similarity Graph (NSG)35 is shown that represents an SAR network designed to reveal both global and local SAR information. Here, nodes are color-coded according to compound potency, as described above, and scaled in size according to per-compound local discontinuity scores. Thus, a large node makes a significant contribution to local SAR discontinuity because the corresponding compound has a potency value very different from its immediate structural neighbors. It follows that combinations of large red and green nodes connected by an edge indicate the most prominent activity cliffs in a compound set. In addition, cluster information for a data set is provided in NSGs (complementing pair-wise similarity relationships) and cluster discontinuity scores are reported that characterize local SARs. Thus, the NSG represents a similarity-based compound network that is annotated with multiple layers of SAR-relevant information. For clarity, the graph layout algorithm separates densely connected regions/clusters from each other (such that inter-cluster distances have no chemical meaning). The NSG initially provides a global SAR view of a compound data set and all of its SAR microenvironments and then helps to quickly focus on the most interesting local SAR regions. For example, in Fig. 5, two densely connected clusters are apparent that have opposite SAR character. At the bottom, a cluster of compounds representing a highly discontinuous local SAR is shown (discontinuity score 0.996) that is rich in activity cliffs. By contrast, above this region, another densely connected cluster is seen (score 0.011) that exclusively consists of small yellow or brown nodes and hence represents a region of extremely high SAR continuity, corresponding to a “flat” local SAR. Thus, subsets of compound representing different local SARs including activity cliffs can be readily identified in and selected from the graph. The NSG concept has been extended in different ways. For example, by utilizing potency ratios for two related targets instead of potency values for one, the activity landscape represented by an NSG is transformed into a selectivity landscape.36 For compound data sets with activity measurements against two targets, this makes it possible to graphically study selectivity patterns and molecular selectivity determinants and identify ‘selectivity cliffs’ that are formed by pairs of structurally similar compounds with very different potency values for the two targets. Going beyond two targets, the NSG design has also been adopted to outline multi-target activity landscapes.37 Furthermore, it has been utilized to study sets of compounds with alternative mechanisms of action.38
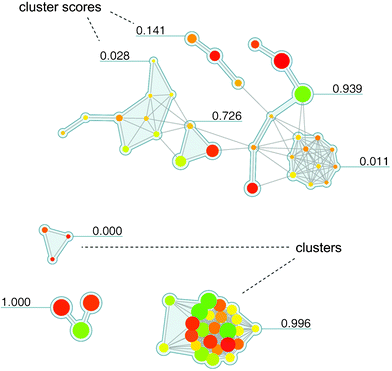 | ||
| Fig. 5 Network-like Similarity Graph. An exemplary NSG representation is shown for a set of 71 squalene synthase inhibitors taken from the MDDR database.52 Nodes are color-coded and scaled in size (as explained in the text). In addition, compound clusters (resulting from hierarchical cluster analysis of the compound set) are shown on a grey background and labels with SARI cluster discontinuity score information. Discontinuity scores range from 0 to 1. The larger the score of a cluster, the more discontinuous is the local SAR formed by the corresponding subset of compounds; conversely, the smaller the score, the more continuous is the local SAR. The figure has been adapted from ref. 35. | ||
In Fig. 6, regions corresponding to the highly discontinuous and continuous compound clusters in Fig. 5 are compared in alternative activity landscape models of the same data set. On the left, a 2D projection of a fingerprint-based chemical reference space is shown generated using multi-dimensional scaling. Through application of an interpolation function, a contiguous potency surface has been computed from individual compound potency values and added as a third dimension to the 2D projection, yielding the 3D representation39 on the right that is reminiscent of a geographical landscape. As can be seen, strongly discontinuous and continuous local SARs in NSGs correspond to activity cliff and smooth regions, respectively, in the 3D representation, thus providing consistent SAR views. As long as one consistently utilizes the same molecular representation, such comparisons between alternative models can be carried out in a meaningful manner. If one changes molecular representations, landscape characteristics generally change as well.39
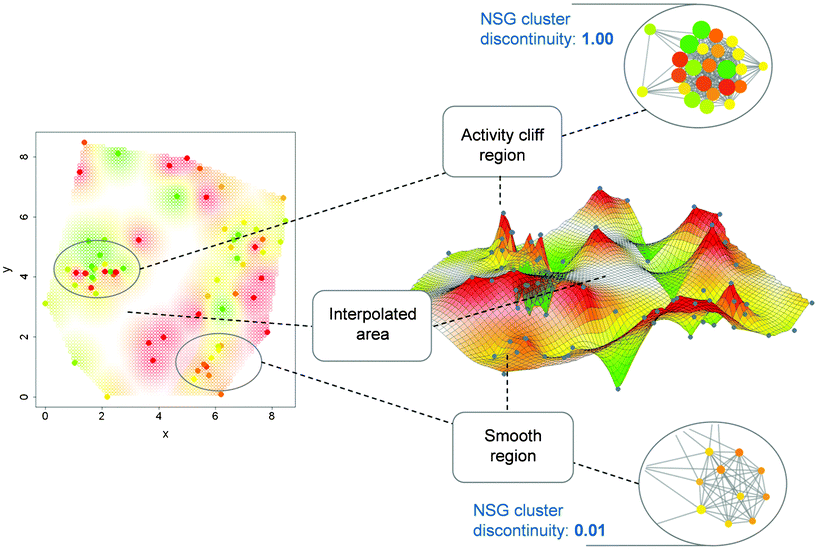 | ||
| Fig. 6 2D and 3D activity landscape representations. Highlighted are corresponding regions in 2D and 3D landscape views of the set of squalene synthase inhibitors whose NSG is shown in Fig. 5. On the left a 2D projection of a fingerprint space is shown from which the 3D representation in the center is derived. In addition, two compound clusters from the NSG are shown including one representing a highly discontinuous (top) and another representing a highly continuous (bottom) local SAR. Corresponding regions in these alternative representations are connected with dashed lines. Color-coding according to compound potency is uniformly applied to nodes and surface regions. | ||
All SAR networks or activity landscape designs discussed so far initially provide global views of a data set. A conceptually different way to analyze SAR environments is shown in Fig. 7. With the introduction of Similarity-Potency Trees (SPTs),40 which are also based on the design principles illustrated in Fig. 4, the focus is changing to provide to a strictly local view of SARs. In SPTs, the structural neighborhood of a chosen reference compound and its SAR information content is analyzed. The radius of the neighborhood is determined by a chosen similarity threshold value relative to the reference compound. This molecule is then used as a root node of a tree structure where edges connect nearest neighbors (i.e., an edge is drawn between a compound and the one it is most similar to within the data set) and the structural similarity of compounds to the root is decreasing along the tree. In SPTs, horizontal and vertical node patterns reflecting potency progression emerge if a compound subset contains interpretable SAR information.40 For interesting compound subsets, overlapping SAR environments can be inspected in series of SPTs centered on neighboring compounds. SPTs can also be generated for all compounds in a large data set and ranked by SAR information content using scoring functions that emphasize the presence of regular SAR patterns.40 Hence, SPT represents a versatile data structure for local SAR analysis. It is also attractive to couple NSG and SPT analysis.41 Following the NSG-SPT approach, an NSG is initially calculated for an entire data set to obtain a global SAR view and focus on discontinuous local regions that are high in SAR information content. Compound subsets forming these regions are then selected from the NSG and subjected to systematic SPT analysis by generating overlapping local SAR environments (i.e., each compound in a given subset is used once as a root). This provides high-resolution SAR views of selected local environments. NSG-SPT analysis has been shown to successfully extract available SAR information from a large phenotypic screening data set containing more than 13![[thin space (1/6-em)]](https://www.rsc.org/images/entities/char_2009.gif) 000 anti-malarial hits.41
000 anti-malarial hits.41
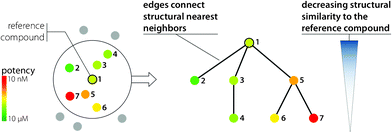 | ||
| Fig. 7 Similarity-Potency Tree. The design principles of the SPT data structure providing a compound-centric local SAR view are illustrated. | ||
SAR networks are generally based on calculated Tanimoto similarity values that depend on chosen molecular representations. As long as a representation such as a molecular fingerprint is consistently used, calculated similarity values can be compared on a relative scale. However, structural relationships that are based on calculated similarity values are not always straightforward to interpret. It is sometimes difficult to reconcile why some molecules that yield higher similarity values in pair-wise comparisons than others should be structurally more similar to each other. The difficulty to consistently interpret structural relationships based on calculated whole-molecule similarity has frequently been pointed out in medicinal chemistry as a general complication of SAR network representations. Therefore, a data structure has recently been introduced that replaces calculated similarity values with well-defined substructure relationships between active compounds. This SAR network design has been termed Bipartite Matching Molecular Series Graph (BMMSG).42 Substructure relationships between all compounds in a data sets are systematically determined applying the Matched Molecular Pair (MMP) formalism.43,44 An MMP is defined as a pair of compounds that differ only at a single site, i.e., that are only distinguished by a single substructure.43 Thus, pairs of compounds forming an MMP are related to each other by a defined chemical transformation exchanging this substructure (e.g., an R-group or a ring system). All compounds in a data set that only differ by a single substructure at a specific site are then considered a Matching Molecular Series (MMS). Hence, in an MMS, different transformations involving the same site in otherwise identical molecules occur. In the BMMSG structure, nodes are connected by an edge if the compounds form an MMP (and thus display a well-defined substructure relationship). An exemplary BMMSG is shown in Fig. 8. The graph structure is bipartite because it contains two types of nodes: ‘set nodes’ that represent the structural fragment common to all compounds in an MMS and ‘molecule nodes’ representing individual compounds. A BMMSG is generally formed by a number of disjoint subgraphs that contain compounds with specific substructure relationships shared within each subgraph. From the graph structure, characteristic patterns emerge that convey SAR information, e.g., an ‘SAR hotspot’ consisting of an MMS with well-defined potency progression or a ‘parallel series’, as illustrated in Fig. 8. A parallel series consists of two molecular frameworks that are correspondingly substituted (i.e., where pairs of analogs with different frameworks but identical R-group patterns exist) and produces a characteristic spindle-type subgraph structure in a BMMSG, as depicted in Fig. 8. If there is corresponding potency progression in these parallel series, an SAR transfer event is identified.
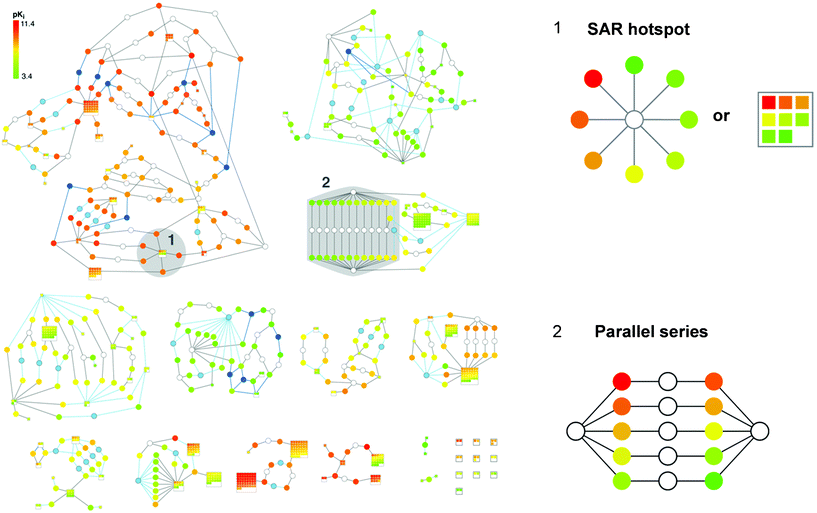 | ||
| Fig. 8 Bipartite Matching Molecular Series Graph. The complete BMMSG representation of a set of 881 factor Xa inhibitors taken from BindingDB50 is displayed. Set nodes are colored in white, light blue, or dark blue, dependent on the type of transformation from which they result, and molecule nodes are colored by potency. Two signature subgraph patterns are labeled and shown in enlarged form. The alternative way to represent an SAR hotspot via a series of squared molecule nodes in a set node is termed a ‘supernode’. The representation has been adapted from ref. 42. | ||
In Fig. 9, the comparison of a subgraph in a BMMSG with an SPT that was calculated for the same set of compounds is shown. The correspondence between compound subsets in these alternative SAR network structures is clearly visible. The SPT displays horizontal patterns with clear potency progression that are found in corresponding ‘supernodes’ in the BMMSG subgraph. Hence, both data structure reveal interpretable SAR information, but a strength of the BMMSG representation is that structural changes that relate compounds carrying SAR information to each other can be readily followed in the graph and interpreted. For interactive analysis, nodes are directly associated with compound structures and edges with exchanged fragments.
 | ||
| Fig. 9 Corresponding graph patterns. A subgraph of the BMMSG in Fig. 8 is highlighted on the right and the corresponding SPT is shown on the left. | ||
Related approaches
It should also be noted that graphical SAR analysis approaches and other compound network methods have also been introduced that are related to, yet methodologically distinct from the SAR networks discussed above. For example, a graphical data structure termed SAR Pathways45 has been introduced that is designed to extract compound series with pair-wise structural relationships and linear potency progression from data sets. However, this approach is based on a pre-defined model of SAR continuity and hence not applicable to general SAR analysis. Also, to characterize the SAR environment of screening hits, Chemical Neighborhood Graphs46 have been designed to capture the similarity and potency distribution in the structural neighborhood of screening hits, hence providing strictly local SAR views similar to SPTs. However, this methodology does not utilize a network representation. Furthermore, going beyond SAR analysis, similarity-based compound networks have also been utilized to systematically study ligand-target associations and polypharmacological compound behavior (for a comprehensive review, see ref. 47).Conclusions
SAR analysis is a central aspect of medicinal chemistry. Traditional SAR investigations have mostly focused on individual compound series during hit-to-lead and lead optimization efforts. In recent years, there has been increasing interest in large-scale SAR analysis and the extraction of available SAR information from compound data sets of any source. For this purpose, computational approaches have become indispensable. As discussed herein, comprehensive SAR analysis can be approached in different ways, employing or adapting a variety of computational concepts. Among these, methods that systematically account for similarity and potency relationships in compound data sets are currently most advanced. In particular, SAR network representations offer the possibility to consistently visualize SARs and focus on global or local SAR features. SAR visualization is an important aspect for the application of computational tools in medicinal chemistry. As presented herein, SAR network representation of different design have been introduced that are often complementary in their use, thus providing a basis for comprehensive SAR analysis of large compound data sets and the identification and rationalization of complex SAR patterns. Importantly, a number of these computational tools have been made publicly available. For example, SALI networks can be generated via a web interface48 and a number of other graphical SAR analysis tools discussed herein are freely available as part of the SARANEA environment.49 It is anticipated that SAR network methods will experience further interest in the future and that additional design ideas will be pursued.Acknowledgements
The authors are grateful to Preeti Iyer, Lisa Peltason, and Mathias Wawer for help with figures.References
- L. Peltason and J. Bajorath, Future Med. Chem., 2009, 1, 451–466 Search PubMed.
- E. X. Esposito, A. J. Hopfinger and J. D. Madura, Methods Mol. Biol., 2004, 275, 131–214 CAS.
- L. M. Mayr and D. Bojanic, Curr. Opin. Pharmacol., 2009, 9, 580–588 CrossRef CAS.
- M. S. Lajiness, G. M. Maggiora and V. Shanmugasundaram, J. Med. Chem., 2004, 47, 4891–4896 Search PubMed.
- A. M. Wassermann, M. Wawer and J. Bajorath, J. Med. Chem., 2010, 53, 8209–9223 Search PubMed.
- G. M. Maggiora, J. Chem. Inf. Model., 2006, 46, 1535–1535 CrossRef CAS.
- H. Geppert, M. Vogt and J. Bajorath, J. Chem. Inf. Model., 2010, 50, 205–216 CrossRef CAS.
- P. Tan, M. Steinbach and V. Kumar, in Introduction to data mining, ed. P. Tan, M. Steinbach, and V. Kumar, Addison-Wesley, 2005, ch. 8, 487–568 Search PubMed.
- R. S. Pearlman and K. M. Smith, Perspect. Drug Discovery Des., 1998, 9–11, 339–353 Search PubMed.
- D. W. Miller, J. Chem. Inf. Model., 2003, 43, 568–578 Search PubMed.
- N. Malo, J. A. Hanley, S. Cerquozzi, J. Pelletier and R. Nadon, Nat. Biotechnol., 2006, 24, 167–175 CrossRef CAS.
- J. F. Hair, R. Anderson and B. Babin, in Multivariate Data Analysis, ed. J. F. Hair, R. Anderson, W.C. Black, and B. Babin, Prentice Hall, 5th Edition, 1998 Search PubMed.
- D. Agrafiotis and V. S. Lobanov, J. Chem. Inf. Model., 2000, 40, 1356–1362 Search PubMed.
- A. Yan, Comb. Chem. High Throughput Screening, 2006, 9, 473–480 Search PubMed.
- C. Kibbey and A. Calvet, J. Chem. Inf. Model., 2005, 45, 523–532 Search PubMed.
- C. Ahlberg, Drug Discovery Today, 1999, 4, 370–376 Search PubMed.
- Y. Hu, D. Stumpfe and J. Bajorath, J. Chem. Inf. Model., 2011, 51, 1742–1753 Search PubMed.
- D. K. Agrafiotis, M. Shemanarev, P. J. Connolly, M. Farnum and V. S. Lobanov, J. Med. Chem., 2007, 50, 5926–5937 Search PubMed.
- D. K. Agrafiotis, J. J. M. Wiener, A. Skalkin and J. Kolpak, J. Chem. Inf. Model., 2011, 51, 1122–1131 Search PubMed.
- L. Peltason, N. Weskamp, A. Teckentrup and J. Bajorath, J. Med. Chem., 2009, 52, 3212–3224 Search PubMed.
- K. Birchall, V. J. Gillet, G. Harper and S. D. Pickett, J. Chem. Inf. Model., 2008, 48, 1543–1557 Search PubMed.
- Y. Hu and J. Bajorath, ChemMedChem, 2010, 5, 1681–1685 CrossRef.
- Y. Hu and J. Bajorath, ChemMedChem, in press. Search PubMed.
- A. Schuffenhauer, P. Ertl, S. Roggo, S. Wetzel, M. A. Koch and H. Waldmann, J. Chem. Inf. Model., 2007, 47, 47–58 CrossRef CAS.
- S. Renner, W. A. van Otterlo, M. Dominguez Seoane, S. Möcklinghoff, B. Hofmann, S. Wetzel, A. Schuffenhauer, P. Ertl, T. I. Oprea, D. Steinhilber, L. Brunsveld, D. Rauh and H. Waldmann, Nat. Chem. Biol., 2009, 5, 585–592 CrossRef CAS.
- A. Richon, J. Mol. Graph. Model., 2000, 18, 76–79 Search PubMed.
- A. M. Clark and P. Labute, J. Med. Chem., 2009, 52, 469–483 Search PubMed.
- J. M. Barnard, G. M. Downs and P. Willett, J. Chem. Inf. Model., 1998, 38, 983–996 CrossRef CAS.
- V. Shanmugasundaram and G. M. Maggiora, in Characterizing Property and Activity Landscapes Using an Information-Theoretic Approach. Proceedings of 222nd American Chemical Society National Meeting, Division of Chemical Information, Chicago, August, 2001; American Chemical Society: Washington, D.C., Search PubMedabstract no. 77.
- L. Peltason and J. Bajorath, J. Med. Chem., 2007, 50, 5571–5578 CrossRef CAS.
- A. B. Yongye, K. Byler, R. Santos, K. Martínez-Mayorga, G. M. Maggiora and J. L. Medina-Franco, J. Chem. Inf. Model., 2011, 51, 1259–1270 Search PubMed.
- J. L. Medina-Franco, A. B. Yongye, J. Pérez-Villanueva, R. A. Houghten and K. Martínez-Mayorga, J. Chem. Inf. Model., 2011, 51, 2427–2439 Search PubMed.
- J. Bajorath, L. Peltason, M. Wawer, R. Guha, M. S. Lajiness and J. H. Van Drie, Drug Discovery Today, 2009, 14, 698–705 CrossRef CAS.
- R. Guha and J. H. Van Drie, J. Chem. Inf. Model., 2008, 48, 646–658 CrossRef CAS.
- M. Wawer, L. Peltason, N. Weskamp, A. Teckentrup and J. Bajorath, J. Med. Chem., 2008, 51, 6075–6084 CrossRef CAS.
- L. Peltason, Y. Hu and J. Bajorath, ChemMedChem, 2009, 4, 1864–1873 Search PubMed.
- D. Dimova, M. Wawer, A. M. Wassermann and J. Bajorath, J. Chem. Inf. Model., 2011, 51, 258–266 Search PubMed.
- P. Iyer, D. Stumpfe and J. Bajorath, J. Chem. Inf. Model., 2011, 51, 1281–1286 Search PubMed.
- L. Peltason, P. Iyer and J. Bajorath, J. Chem. Inf. Model., 2010, 50, 1021–1033 CrossRef CAS.
- M. Wawer and J. Bajorath, J. Chem. Inf. Model., 2010, 50, 1395–1409 CrossRef CAS.
- M. Wawer and J. Bajorath, ACS Med. Chem. Lett., 2011, 2, 201–206 Search PubMed.
- M. Wawer and J. Bajorath, J. Med. Chem., 2011, 54, 2944–2951 Search PubMed.
- P. W. Kenny and J. Sadowski, in Chemoinformatics in Drug Discovery, ed. T. I. Oprea, , Wiley-VCH, Weinheim, 2005, ch. 11, pp.271–285 Search PubMed.
- J. Hussain and C. Rea, J. Chem. Inf. Model., 2010, 50, 339–348 CrossRef CAS.
- M. Wawer and J. Bajorath, ChemMedChem, 2009, 4, 1431–1438 Search PubMed.
- M. Wawer, S. Sun and J. Bajorath, Intl. J. High Throughput Screen., 2010, 1, 15–27 Search PubMed.
- A. L. Hopkins, Nat. Chem. Biol., 2008, 4, 682–690 CrossRef CAS.
- http://sali.rguha.net (accessed October 1 2011).
- E. Lounkine, M. Wawer, A. M. Wassermann and J. Bajorath, J. Chem. Inf. Model., 2010, 50, 68–78 CrossRef CAS.
- D. B. Binding http://www.bindingdb.org (accessed August 1 2011).
- M. Wawer, E. Lounkine, A. M. Wassermann and J. Bajorath, Drug Discovery Today, 2010, 15, 630–639 Search PubMed.
- Molecular Drug Data Report (MDDR), Symyx Technologies, Inc., Sunnyvale, CA, USA, 2008.
| This journal is © The Royal Society of Chemistry 2012 |