Nanoporous carbon as a sensing platform for DNA detection: The use of impedance spectroscopy for hairpin-DNA based assay
Hwee Ling
Poh
,
Alessandra
Bonanni
and
Martin
Pumera
*
Division of Chemistry & Biological Chemistry, School of Physical and Mathematical Sciences, Nanyang Technological University, Singapore 637371. E-mail: Fax: (65) 6791-1961; Fax: (65) 6791-1961
First published on 30th November 2011
Abstract
Nanoporous carbons represent well defined materials with large surface area, defined porosity, high electrical conductivity and fast heterogeneous electron transfer rates. These materials are seldom used for sensing and even more rarely for biosensing. We for the first time show the application of nanoporous carbon using electrochemical impedance spectroscopy technique to detect DNA hybridization and polymorphism. Our findings demonstrated the proof of concept of using nanoporous carbon in nucleic acid analysis, being able to detect the presence of a single nucleotide polymorphism.
Introduction
The demand for new materials in the electrochemical detection of biomolecules has increased considerably in the last few years.1–4 This is due to the enormous need for new analytical devices for point-of-care diagnosis which can provide rapid and sensitive responses.5–7 The detection of DNA hybridization and polymorphism is becoming a very important issue in biomedical field since it can provide early information on the presence and the development of different genetic diseases.8DNA biosensors are the ideal candidate for this purpose since they fulfil the requirements for a fast and reliable response, while at the same time being more affordable and easier to handle for the general user, as compared to the classical methods for DNA analysis.9Electrochemical Impedance Spectroscopy (EIS) is a rapid, non-destructive method which can be used for the characterization of different kinds of materials.10,11 Being able to detect interfacial properties at the electrode surface, EIS has become an increasingly powerful tool for highly sensitive detection of biorecognition events.12,13
Carbon materials have been used in biosensing schemes as electrode materials due to their high electrical conductivity, fast electron transfer rates, well established chemistry and affordability. There has been significant research carried out using carbon-based materials such as graphite,14carbon paste,15carbon nanotubes13 and graphene16 as electrode platforms for biosensing. However, another type of carbon nanostructured material remains completely unexplored for biosensing applications. This material is nanoporous carbon. Nanoporous carbons are termed carbon structures with pores of less than 100 nm, spanning across areas of microporous (pores of 0.2–2 nm), mesoporous (pores of 2–50 nm) and macroporous (50–1000 nm pores) carbons.17 Such materials are well established, have high surface area and well defined structure. Surprisingly, they found most of the applications in the energy storage area,18,19 but a little attention was given to their sensing properties.20,21 Earlier works on the detection of nucleic acids and proteins such as thrombin with mesoporous carbon using fluorescence emission techniques has been reported22,23 but the use of electrochemical sensing methods are still yet to be fully explored. Even though nanoporous carbon materials exhibit very fast heterogeneous electron transfer rates and high surface area, they have not been used for electrochemical nor impedimetric DNA sensing.
In this work we used for the first time a nanoporous carbon platform for the detection of DNA hybridization and polymorphism by electrochemical impedance spectroscopy. Hairpin shaped oligonucleotides were used as DNA probes to be immobilized on the electrode surface. A hairpin-DNA (hpDNA) is a secondary DNA structure in which two regions of the same strand are complementary to each other, thus resulting in the formation of a double-stranded end and an unpaired loop.24,25 Due to this inherent structural constraint, hpDNA presents a higher selectivity for target recognition capabilities in the presence of single nucleotide polymorphisms (SNPs) as compared to linear DNA probes.26–28 The developed platform was able to distinguish between a complementary target and a sequence with one mismatch which is correlated to the development of Alzheimer's disease. Our findings demonstrated a novel application of nanoporous carbon as sensing platform for the impedimetric detection of nucleic acid sequences.
Experimental
Materials
Disposable electrical printed electrodes (DEP chips) were purchased from BioDevice Technology (EP-PP; Lot No. EPFS18), Nomi, Japan. Potassium ferricyanide (K3Fe(CN)6), potassium ferrocyanide (K4Fe(CN)6), hydrochloric acid, sodium chloride (NaCl), trisodium citrate (Na3C5H6O7), disodium hydrogen phosphate (Na2H2PO4) and nanoporous carbon (Lot No. 699632; pore size: 11.2 nm) were used as received from Sigma (singapore). Nanoporous carbon was in detail characterized in our previous publication.21 Deionised water with a conductivity of 18.2 MΩ cm was used in the preparation of solutions and samples. Hairpin probe oligonucleotide (hpDNA), complementary target oligonucleotide (wild), non-complementary target oligonucleotide (nc) and mutant target oligonucleotide (mutant) were pre-prepared by Sigma. Table 1 lists the sequences of each nucleotide used.| Name | Sequence |
|---|---|
| hpDNA | 5′-ATG GAG ACC AGG CGG CCG CAC ACG TCC TCC AT -3′ (32 mer) |
| Wild | 5′-ATG GAG GAC GTG TGC GGC CGC CTG GT-3′ (26 mer) |
| nc | 5′-AAA AAA AAA AAA AAA AAA AAA AAA AA-3′ (26 mer) |
| Mutant |
5′-ATG GAG GAC GTG ![[C with combining low line]](https://www.rsc.org/images/entities/char_0043_0332.gif) GC GGC CGC CTG GT-3′ (26 mer) GC GGC CGC CTG GT-3′ (26 mer) |
Samples and solutions
PBS buffer, pH7 consisted of 0.01 M phosphate and 0.1 M sodium chloride solution. A 0.01 M solution mixture of K3Fe(CN)6 and K4Fe(CN)6 (1![[thin space (1/6-em)]](https://www.rsc.org/images/entities/char_2009.gif) :1) was used as redox marker. TSC1 buffer, pH 7 was prepared using 0.075 M trisodium citrate and 0.75 M sodium chloride. TSC2 buffer, pH 7 consisted of 0.03 M trisodium citrate and 0.3 M sodium chloride. TSC solutions are commonly used as the buffer solutions in hybridization procedures. All DNA solutions were prepared in TSC1 buffer. Nanoporous carbon was dispersed in deionized water to form a 1 mg mL−1 suspension. A fresh suspension is prepared monthly to ensure consistency in the results measured.
:1) was used as redox marker. TSC1 buffer, pH 7 was prepared using 0.075 M trisodium citrate and 0.75 M sodium chloride. TSC2 buffer, pH 7 consisted of 0.03 M trisodium citrate and 0.3 M sodium chloride. TSC solutions are commonly used as the buffer solutions in hybridization procedures. All DNA solutions were prepared in TSC1 buffer. Nanoporous carbon was dispersed in deionized water to form a 1 mg mL−1 suspension. A fresh suspension is prepared monthly to ensure consistency in the results measured.
Apparatus
Impedimetric and cyclic voltammetric measurements were carried out using Autolab 302 electrochemical analyzer (Eco Chemie, The Netherlands) operated by the GPES software. The DEP electrodes used were comprised of a three electrodes system: working electrode (carbon paste), counter electrode (carbon paste) and reference electrode (Ag/AgCl). Thermo Shaker (Model. TS-100) from BIOSAN was used in the temperature controlled incubation steps.Procedure
EIS measurements were performed for: 1) Bare DEP electrode. 2) Nanoporous carbon modified DEP electrode. 3) hpDNA Probe modified DEP electrode. 4) Target DNA hybridized DEP electrode. Cyclic voltammetries were performed in steps 1 and 2.Specific details on the preparations, modifications and hybridization of the DEP electrode at each step is further described in the respective sections below.
Preparation of nanoporous carbon modified DEP electrode
3 μL of nanoporous carbon suspension were deposited on the working electrode, left to dry and gently washed with deionized water to remove any unabsorbed material.Preparation of hpDNA probe modified DEP electrode
3 μL of the hpDNA probe solution were deposited on the nanoporous carbon modified DEP electrode and left to dry at 60 °C for 15 min. The electrodes were then washed in TSC2 at 25 °C under stirring for 5 min. The washing step was repeated twice with fresh TSC2 each time. This was to ensure that any excess or physically unabsorbed hpDNA sequences were removed from the electrode surface.Hybridization with DNA target
Hybridization of hpDNA probe and target DNA sequences are carried out by incubating hpDNA modified DEP electrodes in an eppendorf tube containing the specific DNA target and left for 40 min at 55 °C under stirring. The electrodes were then washed in TSC2 buffer at 42 °C for 10 min under stirring. This was repeated twice using new TSC2 each time. The total volume used in all incubation steps was 100 μL. A schematic of the protocol is given in Scheme 1.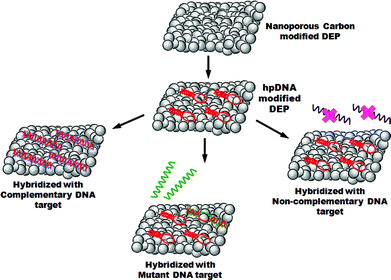 | ||
| Scheme 1 Preparation of DEP chips: immobilization of hairpin probe DNA and hybridization with DNA target sequences. | ||
EIS and CV measurements
All measurements were performed with the Autolab potentiostat using a mixture of K3Fe(CN)6/K4Fe(CN)6 as the redox marker. EIS measurements were carried out for a range of frequencies from 10 KHz to 0.05 Hz with amplitude of 10 mV. The results obtained were presented as Nyquist plots (Z′ against −Z′′). A Randles equivalent circuit [R1(Q[R2W])] was chosen to fit the obtained data.Results and discussion
The behavior and suitability of nanoporous carbon as sensing platform in the analysis of DNA sequences was studied using electrochemical impedance spectroscopy as the detection technique. The bare electrode surface was first modified with nanoporous carbon and the impedimetric signal was recorded. In Fig. 1 the Nyquist plots obtained for the bare DEP chip (purple color) and the nanoporous carbon modified electrode (black color) are represented.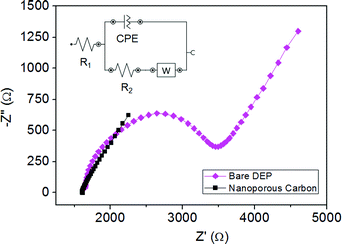 | ||
| Fig. 1 Comparison of impedimetric measurements between bare DEP-chip (purple color) and nanoporous carbon modified DEP-chip (black color). Measurements were performed in K3Fe(CN)6/K4Fe(CN)6 10 mM in PBS, pH 7. Inset: Randles equivalent circuit. | ||
The Randles equivalent circuit [R1(Q[R2W])] used for the data fitting is given in the inset. In the circuit the electrolyte solution resistance (R1) is in series with a parallel RC element. This consists of a constant phase element (Q), the Warburg impedance (W) and the charge transfer resistance (R2). We focus on R2 (diameter of the semicircle in the Nyquist plot) which denotes the charge transfer resistance of the redox marker between the solution and the electrode surface.10,11 Therefore, by monitoring the changes in R2 we can obtain information about the different steps of the biosensing. From Fig. 1 it is clear that the nanoporous carbon gives a much smaller and almost negligible semicircle in the Nyquist plot as compared to the bare DEP-chip, indicating a lower charge transfer resistance and higher electron transfer rate for nanoporous carbon. This result is in agreement with earlier works where nanoporous carbon was found to have a fast heterogeneous electron transfer rate in the presence of the same redox marker.21 This behavior can be due to the increased surface area of the nanoporous material.
After the impedimetric characterization, the electrode surface was modified with hairpin DNA probe (hpDNA) sequences. Nyquist plot obtained for EIS measurements are shown in Fig. 2A, B and C (red color). A much higher charge transfer resistance compared to nanoporous carbon modified DEP-chip (larger diameter in the Nyquist plot) was observed. This increase is generated by the introduction of an additional layer which carries a negatively charged DNA backbone. The repulsion between the latter and the negatively charged redox marker Fe(CN)63−/Fe(CN)64− results in the increase of R2.29
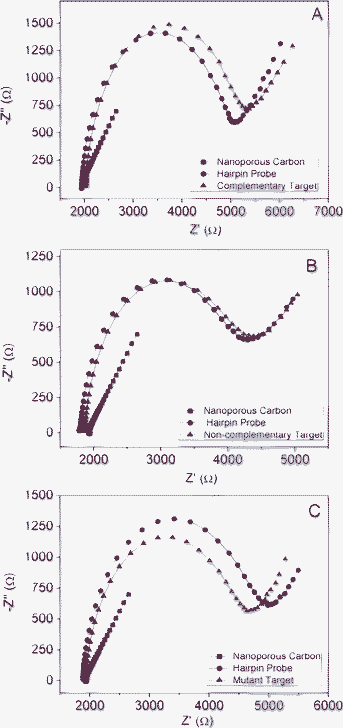 | ||
| Fig. 2 Nyquist plot for nanoporous carbon (black), hpDNA (red), DNA target (blue) for three different hybridization experiments. A) Complementary target DNA sequences. B) Non-complementary target DNA sequences. C) Mutant target DNA sequences. Concentration of hpDNA: 10 μmol L−1; concentration of DNA target: 3 nmol L−1. Measurements were performed in K3Fe(CN)6/K4Fe(CN)6 10 mM in PBS, pH 7. | ||
Detection of DNA sequences involves the final step of the protocol: hybridization of the hairpin DNA probes with target DNA sequences. Different target DNA molecules at the same concentration were used to observe if distinctive responses could be obtained with the nanoporous carbon platform: complementary, non-complementary and mutant (1 base-pair mismatch). Fig. 2A shows that in the presence of complementary DNA target sequences (blue color), an increase in R2 is recorded. This is because upon addition of the complementary target DNA strands, hybridization between the target and the probe DNA sequences occurs and a double stranded DNA is formed on the electrode surface.29 The formation of this double layer, together with the increased number of negatively charged phosphate groups gives rise to greater like-charge repulsion towards the redox marker and therefore, a greater charge transfer resistance.29 When either a non-complementary sequence (blue color in Fig. 2B) or a sequence with 1-mismatch (blue color in Fig. 2C) was employed in the hybridization step, the above mentioned increase in R2 was not observed, thus confirming that hybridization did not take place.
In order to obtain reliable EIS measurements, it is crucial to ensure that the hpDNA probe sequences have completely covered the electrode surface. This is to avoid any non-specific adsorption during the hybridization step which would provide a non-specific signal. Hence, an optimization of the concentration of the hpDNA sequences was performed to determine the amount of probes to immobilize on the nanoporous carbon modified DEP-chip.30,31 The impedimetric response was studied using a hpDNA concentration range from 0.1 μmol L−1 to 20 μmol L−1. The obtained results are shown in Fig. 3. The signal is represented as the ratio between the charge transfer resistance of hpDNA modified electrode and the bare electrode (R2probe/R2 bare). A trend could be observed in Fig. 3, where the signal increases with increasing concentration from and 0.1 μmol L−1 and 10 μmol L−1. The highest R2 variation, corresponding to the electrode surface full coverage was obtained at 10 μmol L−1 hpDNA. Therefore this value was selected as the optimized hpDNA concentration to be immobilized on nanoporous carbon modified DEP-chips.
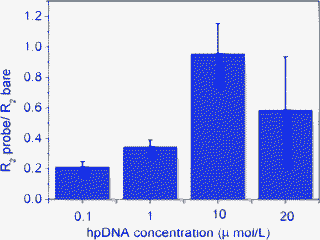 | ||
| Fig. 3 Optimization of hpDNA concentration. Concentration range from 0.1 μmol L−1 to 20 μmol L−1. | ||
Fig. 4 summarizes results obtained in the hybridization experiment with three different DNA target sequences. Signal is given as the variation of the target charge transfer resistance relative to the probe one. The discrimination between the completely complementary target and the sequence carrying one mismatch was detectable at 3 nmol L−1.
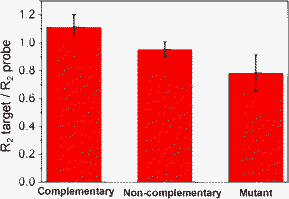 | ||
| Fig. 4 Comparison of the charge transfer resistance ratios between the different target DNA sequences: complementary, non-complementary and mutant target. | ||
Conclusions
The impedimetric detection of DNA hybridization and polymorphism was realized for the first time on nanoporous carbon material. The feasibility of nanoporous carbon as sensing platform was demonstrated in the analysis of synthetic oligonucleotides which can be correlated to the development of Alzheimer's disease. After further optimization of the experimental protocol, the incorporation of nanoporous carbon in bioanalytical devices can be considered, in order to develop a universal platform with the general purpose of biomolecule detection.References
- D. Chen, L. H. Tang and J. H. Li, Chem. Soc. Rev., 2010, 39, 3157 RSC.
- N. Chaniotakis and N. Sofikiti, Anal. Chim. Acta, 2008, 615, 1 CrossRef CAS PubMed.
- G. Pagona and N. Tagmatarchis, Curr. Med. Chem., 2006, 13, 1789 CrossRef CAS.
- K. R. Ratinac, W. R. Yang, J. J. Gooding, P. Thordarson and F. Braet, Electroanalysis, 2011, 23, 803 CrossRef CAS.
- E. Simon, Meas. Sci. Technol., 2010, 21, 112002 CrossRef.
- F. Teles, L. Tavira and L. J. P. da Fonseca, Crit. Rev. Clin. Lab. Sci., 2010, 47, 139 CrossRef CAS PubMed.
- Y. H. Yun, E. Eteshola, A. Bhattacharya, Z. Y. Dong, J. S. Shim, L. Conforti, D. Kim, M. J. Schulz, C. H. Ahn and N. Watts, Sensors, 2009, 9, 9275 CrossRef CAS PubMed.
- R. Rapley, S. Harbron, Molecular Analysis and Genome Discovery, Wiley: New York, 2004 Search PubMed.
- J. H. Zhai, H. Cui and R. F. Yang, Biotechnol. Adv., 1997, 15, 43 CrossRef CAS.
- J. R. Macdonald, Impedance Spectroscopy, Wiley: New York, 1987 Search PubMed.
- C. Gabrielli, Use and Application of Electrochemical Impedance Techniques, Solartron Analytical: Farnborough, UK, 1990 Search PubMed.
- J. S. Daniels and N. Pourmand, Electroanalysis, 2007, 19, 1239 CrossRef CAS PubMed.
- A. Bonanni and M. del Valle, Anal. Chim. Acta, 2010, 678, 7 CrossRef CAS PubMed.
- M. I. Pividori, A. Merkoci and A. Alegret, Biosens. Bioelectron., 2003, 19, 473 CrossRef CAS.
- I. Svancara, K. Vytras, J. Barek and J. Zima, Crit. Rev. Anal. Chem., 2001, 31, 311 CrossRef CAS.
- M. Pumera, Mater. Today, 2011, 14, 308 CrossRef CAS.
- L. B. McCusker, F. Liebau and G. Engelhardt, Pure Appl. Chem., 73, 2, 381 Search PubMed.
- C. Liang, Z. Li and S. Dai, Angew. Chem., Int. Ed., 2008, 47, 2 CrossRef PubMed.
- Y. Tao, M. Endo, M. Inagaki and K. Kaneko, J. Mater. Chem., 2011, 21, 313 RSC.
- N. Jia, Z. Wang, G. Yang, H. Shen and L. Zhu, Electrochem. Commun., 2007, 9, 233 CrossRef CAS PubMed.
- H. L. Poh and M. Pumera, Chem. Asian J., 2011 DOI:10.1002/asia.201100681 , in press.
- S. Liu, H. Li, L. Wang, J. Tian and X. Sun, J. Mater. Chem., 2011, 21, 339 RSC.
- Y. Zhang, S. Liu and X. Sun, Biosens. Bioelectron., 2011, 26, 3876 CrossRef CAS PubMed.
- J. D. Watson, T. A. Baker, S. P. Bell, A. Gann, M. Levine, R. Losick, Molecular Biology of the Gene, 5th ed., CSHL Press, 2004 Search PubMed.
- A. A. Lubin and K. W. Plaxco, Acc. Chem. Res., 2010, 43, 496 CrossRef CAS PubMed.
- C. H. Fan, K. W. Plaxco and A. J. Heeger, Proc. Natl. Acad. Sci. U. S. A., 2003, 100, 9134 CrossRef CAS PubMed.
- Y. W. Lin, H. T. Ho, C. C. Huang and H. T. Chang, Nucleic Acids Res., 2008, 36, e123 CrossRef PubMed.
- S. P. Song, Z. Q. Liang, J. Zhang, L. H. Wang, G. X. Li and C. H. Fan, Angew. Chem., Int. Ed., 2009, 48, 8670 CrossRef CAS PubMed.
- T. H. M. Kjallman, H. Peng, C. Soeller and J. Travas-Sejdic, Anal. Chem., 2008, 80, 9460 CrossRef CAS PubMed.
- F. Ricci, R. Y. Lai, A. J. Heeger, K. W. Plaxco and J. J. Sumner, Langmuir, 2007, 23, 6827 CrossRef CAS PubMed.
- A. Bonanni and M. Pumera, ACS Nano, 2011, 5, 2356 CrossRef CAS PubMed.
| This journal is © The Royal Society of Chemistry 2012 |