A general strategy for the production of photoluminescent carbon nitride dots from organic amines and their application as novel peroxidase-like catalysts for colorimetric detection of H2O2 and glucose†
Sen
Liu
a,
Jingqi
Tian
ab,
Lei
Wang
a,
Yonglan
Luo
a and
Xuping
Sun
*a
aState Key Lab of Electroanalytical Chemistry, Changchun Institute of Applied Chemistry, Chinese Academy of Sciences, Changchun, 130022, Jilin, China. E-mail: sunxp@ciac.jl.cn; Fax: (+86) 431-85262065; Tel: (+86) 431-85262065
bGraduate School of the Chinese Academy of Sciences, Beijing, 100039, China
First published on 15th November 2011
Abstract
The present communication reports on a general strategy for the production of photoluminescent carbon nitride dots (CNDs) by microwave heating of organic amines in the presence of acid. The resultant CNDs possess intrinsic peroxidase-like activity and have been successfully used as peroxidase mimetics for the colorimetric detection of H2O2 and glucose for the first time.
During the past few years, fluorescent semiconductor quantum dots (QDs) have attracted much interest due to their unique optical and biochemical properties and their significant practical applications in optoelectronic devices and biological labellingetc.1 However, such QDs suffer from some serious health and environmental concerns due to the use of heavy metals as the essential elements, which limits their wide applications.2 This issue was subsequently circumvented by developing new nanomaterials with similar optical properties.3 Fluorescent carbon dots (CDs) have unique properties including low toxicity, easy labelling, and high stability, and therefore, much attention has been paid to their preparation and a large number of preparative methods have been developed.4Carbon nitride materials have been another focus of materials research because of their unique properties and wide applications in catalysis, sensors, and corrosion protection etc.5 However, the carbon nitride materials previously reported have large particle size and thus are not suitable for optical applications.6 Until recently we have successfully prepared fluorescent carbon nitride dots (CNDs) by polymerization of CCl4 and 1,2-ethylenediamine (EDA) or heat-treatment of dimethylformamide (DMF) in the presence of acid.7 In this communication, we report a general preparative strategy involving microwave heat-treatment of various organic amines such as dimethylamine (DIA), ethylamine (EA) or tripropylamine (TPA) in the presence of acids including H2SO4, chlorosulfonic acid (CSA), HNO3 or HCl. It is interesting to have found that as-formed CNDs possess intrinsic peroxidase-like activity and can catalyze the oxidation of 3,3′,5,5′-tetramethylbenzidine (TMB) by H2O2 to develop a blue color. Based on these findings, we further demonstrate the application of such CNDs to the colorimetric detection of H2O2 and glucose.
Fig. 1a shows a TEM image of the products formed by microwave heating of a DIA solution in the presence of H2SO4 for 60 s (designated as CNDs–D, ESI†), showing that the products consist of small particles which are well separated from each other. The corresponding particle size distribution histogram shown in Fig. 1b indicates that these nanoparticles have diameters ranging from 2 to 8 nm. The chemical composition of these nanoparticles was further determined by collecting the corresponding energy-dispersed spectroscopy (EDS) spectrum, as shown in Fig. S1.† The peaks of C and N elements are observed, indicating that these nanoparticles are formed from DIA. Two other peaks due to S and O are also observed.
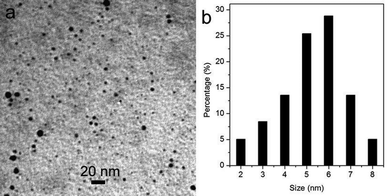 | ||
| Fig. 1 (a) TEM image and (b) the corresponding particle size distribution histogram of the products obtained by microwave heating of a DIA solution in the presence of H2SO4 for 60 s. | ||
The surface composition and elemental analysis for the overall composition of the resultant nanoparticles were characterized using the XPS technique. The XPS spectrum of the nanoparticles, shown in Fig. S2,† exhibits three peaks at 283, 399.2 and 530.0 eV, which are attributed to C1s, N1s, and O1s, respectively.8 Two other peaks at 167.1 and 231.1 eV, associated with S2p and S2s, are also observed. XPS results show that such nanoparticles are mainly composed of C and N (the ratio of C to N is 2.82). The observation of limited amounts of O and S elements may be due to the adsorption of H2SO4 on the particle surface. Furthermore, the C1sspectrum (Fig. S3†) exhibits three peaks at 284.5, 285.7 and 287.5 eV, which are attributed to C–C, C–N (sp2) and C–N (sp3), respectively. The N1sspectrum (Fig. S4†) exhibits four peaks at 398.3, 399.1, 400.3 and 401.5 eV, which are associated with C![[double bond, length as m-dash]](https://www.rsc.org/images/entities/char_e001.gif) N–C, C–N–C, N–(C)3 and N–H groups, respectively.9 The characteristic absorption bands of aromatic CN heterocycles at 1212 to 1629 cm−1 and of heptazine units at 617 cm−1 are observed in the FT-IR spectrum (Fig. S5†) for the sample, revealing that the local structure of the nanoparticles thus obtained is composed of CN units.10 The XRD pattern of these nanoparticles shown in Fig. S6† exhibits a weak reflection peak centered at around 26°, indicating that their (002) interlayer spacing is 3.48 Å, which is similar to the previously reported CDs.4i All these observations indicate that these particles are carbon nitride nanoparticles.
N–C, C–N–C, N–(C)3 and N–H groups, respectively.9 The characteristic absorption bands of aromatic CN heterocycles at 1212 to 1629 cm−1 and of heptazine units at 617 cm−1 are observed in the FT-IR spectrum (Fig. S5†) for the sample, revealing that the local structure of the nanoparticles thus obtained is composed of CN units.10 The XRD pattern of these nanoparticles shown in Fig. S6† exhibits a weak reflection peak centered at around 26°, indicating that their (002) interlayer spacing is 3.48 Å, which is similar to the previously reported CDs.4i All these observations indicate that these particles are carbon nitride nanoparticles.
Fig. 2 shows UV-vis absorption and photoluminescence (PL) spectra of the dispersion of the carbon nitride nanoparticles. The UV-vis spectrum shows a strong absorption peak at 262 nm, which is similar to our previous reports.7 It should be noted that a strong PL emission spectrum centered at 454 nm was observed when it was excited at 380 nm, indicating the production of fluorescent CNDs. The photograph of the dispersion under UV light (365 nm) exhibits an obvious blue color (inset), further revealing that the resultant CNDs exhibit strong blue fluorescence.
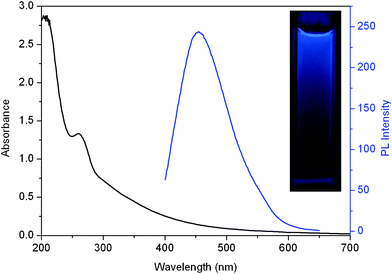 | ||
| Fig. 2 UV-vis absorption (black) and photoluminescence (blue) spectra of the CNDs–D dispersion. Inset: photograph of CNDs–D dispersion under UV light (365 nm). | ||
Fig. S7† shows PL emission spectra of the CNDs–D dispersion with various excitation wavelengths from 380 to 520 nm. It can be seen that the emission spectrum of the CNDs–D changes from violet (∼430 nm) to yellowish-green (∼550 nm), with a dependence on the excitation wavelengths from 380 to 520 nm. The emission peak position shifts to longer wavelengths and the intensity gradually decreases with increased excitation wavelengths. Such an observation is similar to that for carbon dots, which may be attributed to the optical selection of differently sized nanoparticles (quantum effect) or different emissive traps on the CNDs–D surface or another mechanism altogether.4a,b The full width at half maximum (FWHM) at 380 nm is about 97 nm, indicating the narrow size distribution of the CNDs–D. Furthermore, the quantum yield of the CNDs–D is 8.9% (ESI†).
We studied the effect of the pH value of the dispersion on the CNDs–D fluorescence. It was seen that an increase of pH value from 1 to 3 led to increased fluorescence intensity, but further increase to 13 led to a gradual decrease of fluorescence intensity, indicating that the fluorescence intensity of CNDs–D strongly depends on the pH value (Fig. S8†). Such observations are similar to those for carbon nanoparticles modified by –COOH groups or passivated by N-containing polymers, which are attributed to the presence of N-containing groups on the surface.4a Furthermore, the zeta potential of the CNDs–D dispersion is about 12.7 mV, further confirming the presence of N-containing groups on the CNDs–D. Note that the PL intensity of the CNDs–D exhibits no obvious decrease after 10 h excitation at 365 nm with a UV lamp (Fig. S9†), indicating the stable PL of the CNDs–D. It was also found that the CNDs–D thus obtained exhibit good stability, confirmed by no obvious change of the zeta potential being observed after 7 days, which can be attributed to electrostatic repulsions between the positively charged CNDs–D nanoparticles resulting in electrosteric stabilization.
We also performed one control experiment by mixing H2SO4 and DIA at room temperature and found that no fluorescent CNDs were formed even with a longer reaction time of 12 h. This indicates that reaction temperature plays an important role in the formation of CNDs. Furthermore, another control experiment of microwave heating of DIA in the absence of H2SO4 was also performed, resulting in no formation of fluorescent CNDs, which confirms the catalytic function of the acid. It should be pointed out that the use of another acid such as CSA, HNO3, or HCl also yields CNDs (designated as CNDs–S, CNDs–N and CNDs–C, respectively), under otherwise identical conditions. Fig. 3a–c show the UV-vis absorption and PL spectra of CNDs–S, CNDs–N, and CNDs–C, respectively, revealing that all the CNDs exhibit strong absorption and PL under an excitation wavelength of 360 or 380 nm. Fig. 3d shows the corresponding photographs. We also found that microwave heating of other organic amines such as EA or TPA in the presence of H2SO4 also yields fluorescent CNDs (designated as CNDs–E, and CNDs–T, respectively), as shown in Fig. S10.† All these observations indicate that the present method is general for the production of CNDs.
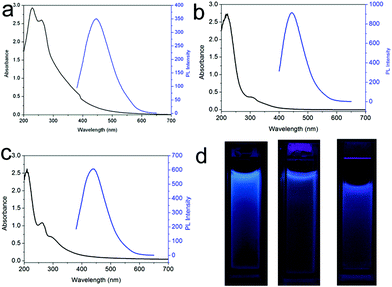 | ||
| Fig. 3 UV-vis absorption and PL emission spectra of (a) CNDs–S, (b) CNDs–N and (c) CNDs–C, respectively. (d) shows the corresponding photographs in water under UV light (365 nm). | ||
Interestingly, it was found that the CNDs possess intrinsic peroxidase-like activity, leading to a simple approach to the colorimetric detection of H2O2 and glucose. Fig. 4a inset shows the photographs of TMB solution under different conditions. It is seen that TMB solutions in the absence and presence of H2O2 exhibit no color change. In contrast, the TMB solution changes to a blue color after addition of CNDs. However, the addition of CNDs into TMB solution gives no color change in the absence of H2O2 (data not shown). Fig. 4a shows the corresponding UV-vis spectra. These observations reveal that the CNDs possess peroxidase-like activity capable of catalyzing the oxidation of TMB by H2O2.11 The effect of pH value and temperature on the catalytic activity of the CNDs was also examined (Fig. S11†). Fig. 4b shows the dependence of the absorbance at 653 nm on the concentration of H2O2. It can be seen that the intensity of the absorption peak at 653 nm increases with increased H2O2 concentration from 0 μM to 1 mM. Fig. 4b inset shows the corresponding calibration plot. The linear detection range is estimated to be from 1 μM to 100 μM (r = 0.994) and the detection limit is estimated to be 0.4 μM. When combined with glucose oxidase (GOD), the proposed colorimetric method can be used for the determination of glucose. Fig. 4c shows the dependence of the absorbance at 653 nm on the concentration of glucose, revealing the intensity of the absorption peak at 653 nm increases with increased glucose concentration from 1 μM to 1 mM. Fig. 4c inset shows the corresponding calibration plot. The linear detection range is estimated to be from 1 μM to 5 μM (r = 0.988) and the detection limit is estimated to be 0.5 μM. Furthermore, such a glucose biosensing system exhibits excellent selectivity for glucose, in comparison with fructose, lactose, and maltose (Fig. 4d). A comparison with other colorimetric glucose detection systems based on nanostructures is shown in Table S1,† which indicates that our biosensing system exhibits a relatively lower detection limit than most of them.
![(a) UV-vis spectra of TMB solutions under different conditions in pH 4.0 NaOAc buffer: TMB; TMB+H2O2; TMB+H2O2+CNDs; CNDs. Inset: the corresponding photographs (from left to right). (b) and (c) show the dependence of the absorbance at 653 nm on the concentration of H2O2 and glucose, respectively. The insets are the corresponding linear calibration plots. (d) Determination of the selectivity of glucose detection with 5 mM lactose, 5 mM fructose, 5 mM maltose, and 1 mM glucose. Inset: the color change with the different solutions. ([TMB] = 0.1 mM, [H2O2] = 44 mM, [CNDs] = 1 mg mL−1).](/image/article/2012/RA/c1ra00709b/c1ra00709b-f4.gif) | ||
| Fig. 4 (a) UV-vis spectra of TMB solutions under different conditions in pH 4.0 NaOAc buffer: TMB; TMB+H2O2; TMB+H2O2+CNDs; CNDs. Inset: the corresponding photographs (from left to right). (b) and (c) show the dependence of the absorbance at 653 nm on the concentration of H2O2 and glucose, respectively. The insets are the corresponding linear calibration plots. (d) Determination of the selectivity of glucose detection with 5 mM lactose, 5 mM fructose, 5 mM maltose, and 1 mM glucose. Inset: the color change with the different solutions. ([TMB] = 0.1 mM, [H2O2] = 44 mM, [CNDs] = 1 mg mL−1). | ||
In summary, a general strategy for the production of fluorescent CNDs has been developed involving microwave heat-treatment of organic amines in the presence of acids. Such CNDs are found to possess peroxidase-like activity and their use for the colorimetric detection of H2O2 and glucose has also been demonstrated successfully for the first time. Our present study is important because it provides us with a general preparative strategy toward fluorescent CNDs for applications.
This work was supported by the National Basic Research Program of China (No. 2011CB935800).
References
- (a) X. Peng, L. Manna, W. Yang, J. Wickham, E. Scher, A. Kadavanich and A. P. Alivisatos, Nature, 2000, 404, 59 CrossRef CAS; (b) X. Gao, Y. Cui, R. M. Levenson, L. W. K. Chung and S. Nie, Nat. Biotechnol., 2004, 22, 969 CrossRef CAS.
- A. M. Derfus, W. C. W. Chan and S. N. Bhatia, Nano Lett., 2004, 4, 11 CrossRef CAS.
- M. Bottini, F. Cerignoli, D. M. Mills, F. D'Annibale, M. Leone, N. Rosato, A. Magrini, M. Pellecchia, A. Bergamaschi and T. Mustelin, J. Am. Chem. Soc., 2007, 129, 7814 CrossRef CAS.
- (a) S. N. Baker and G. A. Baker, Angew. Chem., Int. Ed., 2010, 49, 6726 CrossRef CAS; (b) L. Cao, X. Wang, M. J. Meziani, F. Lu, H. Wang, P. G. Luo, Y. Lin, B. A. Harruff, L. M. Veca, D. Murray, S.-Y. Xie and Y.-P. Sun, J. Am. Chem. Soc., 2007, 129, 11318 CrossRef CAS; (c) R. Liu, D. Wu, S. Liu, K. Koynov, W. Knoll and Q. Li, Angew. Chem., Int. Ed., 2009, 48, 4598 CrossRef CAS; (d) G. Eda, Y.-Y. Lin, C. Mattevi, H. Yamaguchi, H.-A. Chen, I.-S. Chen, C.-W. Chen and M. Chhowalla, Adv. Mater., 2010, 22, 505 CrossRef CAS; (e) A. B. Bourlinos, A. Stassinopoulos, D. Anglos, R. Zboril, M. Karakassides and E. P. Giannelis, Small, 2008, 4, 455 CrossRef CAS; (f) J. Lu, J.-X. Yang, J. Wang, A. Lim, S. Wang and K. P. Loh, ACS Nano, 2009, 3, 2367 CrossRef CAS; (g) S. Chandra, P. Das, S. Bag, D. Laha and P. Pramanik, Nanoscale, 2011, 3, 1533 RSC; (h) H. Liu, T. Ye and C. Mao, Angew. Chem., Int. Ed., 2007, 46, 6473 CrossRef CAS; (i) H. Peng and J. Travas-Sejdic, Chem. Mater., 2009, 21, 5563 CrossRef CAS.
- (a) F. Goettmann, A. Fischer, M. Antonietti and A. Thomas, Angew. Chem., Int. Ed., 2006, 45, 4467 CrossRef CAS; (b) K. K. P. Datta, B. V. S. Reddy, K. Ariga and A. Vinu, Angew. Chem., Int. Ed., 2010, 49, 5961 CAS; (c) M. G. Schwab, B. Fassbender, H. W. Spiess, A. Thomas, X. Feng and K. Mullen, J. Am. Chem. Soc., 2009, 131, 7216 CrossRef CAS; (d) A. Liu and M. Cohen, Science, 1989, 245, 841 CrossRef CAS.
- (a) S. M. Lyth, Y. Nabae, S. Moriya, S. Kuroki, M.-a. Kakimoto, J.-i. Ozaki and S. Miyata, J. Phys. Chem. C, 2009, 113, 20148 CrossRef CAS; (b) Y.-J. Bai, B. Lu, Z. Liu, L. Li, D. Cui, X. Xu and Q. Wang, J. Cryst. Growth, 2003, 247, 505 CrossRef CAS; (c) L. Yang, P. W. May, Y. Huang and L. Yin, J. Mater. Chem., 2007, 17, 1255 RSC.
- (a) S. Liu, J. Tian, L. Wang, Y. Luo, J. Zhai and X. Sun, J. Mater. Chem., 2011, 21, 11726 RSC; (b) S. Liu, L. Wang, J. Tian, J. Zhai, Y. Luo, W. Lu and X. Sun, RSC Adv., 2011, 1, 951 RSC.
- S. Liu, J. Tian, L. Wang, H. Li, Y. Zhang and X. Sun, Macromolecules, 2010, 43, 10078 CrossRef CAS.
- D. R. Miller, J. R. Holst and E. G. Gillan, Inorg. Chem., 2007, 46, 2767 CrossRef CAS.
- M. J. Bojdys, J.-O. Muller, M. Antonietti and A. Thomas, Chem.–Eur. J., 2008, 14, 8177 CrossRef CAS.
- (a) L. Gao, J. Zhuang, L. Nie, J. Zhang, N. Gu, T. Wang, J. Feng, D. Yang, S. Oerrett and X. Yan, Nat. Nanotechnol., 2007, 2, 577 CrossRef CAS; (b) Y. Song, K. Qu, C. Zhao, J. Ren and X. Qu, Adv. Mater., 2010, 22, 2206 CrossRef CAS; (c) Y. Jv, B. Li and R. Cao, Chem. Commun., 2010, 46, 8017 RSC; (d) W. Shi, Q. Wang, Y. Long, Z. Cheng, S. H. Zheng and Y. Huang, Chem. Commun., 2011, 47, 6695 RSC; (e) S. Liu, L. Wang, J. Zhai, Y. Luo and X. Sun, Anal. Methods, 2011, 3, 1475 RSC; (f) S. Liu, J. Tian, L. Wang, Y. Luo, G. Chang and X. Sun, Analyst, 2011, 136, 4894 Search PubMed; (g) H. Wei and E. Wang, Anal. Chem., 2008, 80, 2250 CrossRef CAS; (h) A. Asati, S. Santra, C. Kaittanis, S. Nath and J. M. Perez, Angew. Chem., Int. Ed., 2009, 48, 2308 CAS.
Footnote |
| † Electronic supplementary information (ESI) available: Experimental section and supplementary figures. See DOI: 10.1039/c1ra00709b |
| This journal is © The Royal Society of Chemistry 2012 |