Promiscuous stabilisation behaviour of silicic acid by cationic macromolecules: the case of phosphonium-grafted dicationic ethylene oxide bolaamphiphiles†
Konstantinos D.
Demadis
*a,
Anna
Tsistraki
a,
Adriana
Popa
b,
Gheorghe
Ilia
b and
Aurelia
Visa
b
aCrystal Engineering, Growth and Design Laboratory, Department of Chemistry, University of Crete, Heraklion, Crete, GR-71003, Greece. E-mail: demadis@chemistry.uoc.gr
bInstitute of Chemistry Timisoara of Romanian Academy, 24 Mihai Viteazul Blv., RO-300223, Timisoara, Romania
First published on 15th November 2011
Abstract
Phosphonium-based bolaamphiphiles have been found to stabilise silicic acid beyond its solubility limit (∼150 ppm). Three bolaamphiphiles have been tested having a quaternary phosphonium group on each end, linked by a number of ethylene oxide (EO) units (5, 21, and 91, resulting in PEGP+-200, PEGP+-1000, and PEGP+-4000 dicationic bolaamphiphiles, respectively). Specifically, the ability of PEGP+-200, PEGP+-1000, and PEGP+-4000 to retard silicic acid condensation at circumneutral pH in aqueous supersaturated solutions was explored. The goal was to investigate the effect of P-based cationic molecules, EO chain length (and by inference the P-to-P spatial separation) on silicic acid stabilisation performance. PEGP+-200 showed no stabilisation ability in “long term” tests (i.e. 24, 48, 72 h). For PEGP+-1000, and PEGP+-4000, it was discovered that in “short-term” (0–8 h) and “long term” (> 24 h) studies the inhibitory activity is additive dosage-dependent, demonstrating that there is a clear increase in stabilisation ability upon phosphonium PEG dosage increase. Specifically, soluble silicic acid levels reach 420 ppm and 400 ppm after 24 h in the presence of 150 ppm PEGP+-1000, or PEGP+-4000, respectively. PEG additives (PEG-200, PEG-1000, and PEG-4000) containing no phosphonium cations were also tested. Although PEG-200 and PEG-1000 showed no silicic acid stabilisation effects, PEG-4000, surprisingly, was a strong stabiliser. In fact, the inhibitory efficiencies of PEGP+-4000 and PEG-4000 were virtually identical. These results present strong proof that the polyethylene chain beyond a certain length strongly contributes to silicic acid stabilisation. Lastly, the effects of these boloamphiphiles on silica particle morphology were investigated by SEM. Spherical particles and their aggregates, irregularly shaped particles and porous structures, are obtained depending on the additive.
Introduction
Biosilicification is the directed formation of amorphous hydrated silica (biosilica) in living organisms, such as marine/freshwater diatoms, sponges and terrestrial plants.1 It has been estimated that marine biological systems process the amount of about 6.7 gigatonnes of silicon.2 This translates into gross production of ∼240 ± 40 terramoles of “silicon” per annum in surface waters. Biosilicification presents itself as a special kind of biomineralization in that biosilica is different from the plethora of various biogenic, metal-containing minerals (e.g. calcite, aragonite, vaterite, octacalcium phosphate, hydroxyapatite, iron sulfides, strontium/barium sulfatesetc.). Metal carbonate, phosphate or sulfate solids are crystalline ionic materials whose formation is governed by cation–anion association and solubility equilibria, biosilica is an oxide of amorphous nature formed by a complicated inorganic condensation process, controlled by biomacromolecules. Thus, the “exotic” silica-containing elaborate morphologies at the micron scale.3The diatom is an ideal biosystem for investigation of the mechanism of silicon transport, which is an integral part of the biosilicification process.4 As the environmental concentrations of “dissolved silicon” are rather low (∼70 μM), diatoms must have an efficient transport system. Silicon (as orthosilicic acid or silicate) must not only be transported into the cell, but also transported intracellularly into the Silica Deposition Vesicle (SDV) where silica morphogenesis occurs. The cells maintain pools of dissolved silicon (in whichever chemical form) in relatively high silicon concentrations. It should be noted that although the intracellular silica pool can be as high as 450 to 700 nM/cell,5 the actual level seems to range from less than 1 mM to about 20 mM (equivalent to a solution of ∼1% w/v SiO2) as recalculated from the silica content and the biovolume for more than 70 species that have been compared for their silica content.6Silicon is taken up only during a specific time in the cell cycle (just prior to cell-wall synthesis), and the kinetic parameters for silicon transport were found to vary during the uptake period. The exact “timing” for the initiation of silicic acid condensation is not known. However, a set of silaffins isolated from diatom cell walls were shown to generate networks of silica nanospheres within seconds when added to a solution of silicic acid.7 Furthermore, natSil-2 lacks intrinsic silica formation activity but is able to regulate the activities of the previously characterized silica-forming biomolecules natSil-1A and long-chain polyamines. Combining natSil-2 and natSil-1A (or long-chain polyamines) generates an organic matrix that mediates precipitation of porous silica within minutes after the addition of silicic acid. Remarkably, the precipitate displays pore sizes in the range 100–1000 nm, which is characteristic for diatom biosilica nanopatterns.8 The above observations point to the necessity of maintaining a relatively high “Si” concentration (above the “normal” silicic acid solubility prior to condensation) for a period of time, before its condensation and uptake for the construction of the cell wall. Therefore, the research described herein on enhancement of soluble “Si” levels induced by specifically designed multifunctional biomacromolecules can be, from a biomimetic point of view, linked to a similar intracellular action in the SDV.
Biosilica formation/deposition is a process of great significance in sponges as well. According to the modern point of view, two different mechanisms of silicification in sponges are proposed: enzymatic (silicatein-based) and non-enzymatic, or self-assembling (chitin-and collagen-based).9 There are two possible mechanisms for enzyme catalysis:10 (i) stabilisation of one molecule of deprotonated silicic acid (the nucleophile) at the active site, which will then react with another molecule of silicic acid; or (ii) stabilisation of a protonated silicic acid (the electrophile) which will then react with another molecule of silicic acid.
There is a wealth of information on the effect of various additives (mainly polymers and dendrimers) on silicic acid condensation to form amorphous silica. Notably, studies have been published on the effect of various polymeric additives, such as poly-L-lysine,11 poly-L-histidine,12 polyallylamine,13 poly-L-arginine,14 polyethyleneimine15 and amine-terminated polyaminoamide dendrimers16 to form silica from a range of precursors in vitro.
Simmons et al. have studied the effects of a plethora of amine/ammonium compounds on silicic acid condensation to form colloidal silica.17 Among the compounds studied were various monoammonium salts, bis(quaternary ammonium) salts, highly alkylated diamines, etc., in phosphate-buffered silicic acid aqueous solutions. It was discovered that the degree to which a series of diamines in solution enhances condensation of silicic acid at neutral pH increases with increasing alkylation, a factor more important than amine pKa. These observations support a previously proposed mechanism in which neighbouring cationic amines “force” silicate oligomers into a configuration favouring condensation. Also, amines with a high degree of alkylation showed enhanced silicic acid condensation kinetics. Similar studies with a variety of amines, but using water-soluble silicates, were carried out by Menzel et al.18 Jones studied the effect of various compounds on tetraethylorthosilicate (TEOS) condensation, such as 1,4-diazabicyclo {222}octane (DABCO), imidazole and pyridine and their derivatives, by monitoring gelation times.19 Perry et al. synthesized linear poly(propylamines) in an effort to extend the N-methylpropylamine chain in a linear fashion, and then studied the effects of these molecules on silica formation.20 Neutral H2N(CH2)nNH2 bolaamphiphiles (n = 12–22) were studied as structure directors in TEOS hydrolysis to produce a family of silica molecular sieves with lamellar frameworks and hierarchical structure.21 The same type, but “shorter” diamines H2N(CH2)nNH2 (n = 2–10) were used as putrescine homologues to control silica morphogenesis by electrostatic interactions.22 Furthermore, a series of ionene polyviologens were synthesized and incorporated into silica networks prepared by the sol–gel route based on TEOS hydrolysis.23 Lastly, surfactant-influenced, directed growth of silica hollow spheres were studied. Compounds tested were mixtures of cetyltrimethylammonium bromide (CTAB) and sodium perfluorooctanoate (FC7) and also mixtures of cetyltrimethylammonium tosylate (CTAT) and sodium dodecylbenzenesulfonate (SDBS).24
Wallace et al. have studied the nucleation of silica on amine- (with 11-amino-1-undecanethiol hydrochloride) and carboxy-terminated (with 11-mercaptoundecanoic acid) gold surfaces.25 The data show that amine-terminated surfaces do not promote silica nucleation, whereas carboxyl and hybrid NH3+/COO− substrates are active for silica deposition. The rate of silica nucleation is ∼18× faster on the hybrid substrates than on carboxylated surfaces, but the free energy barriers to cluster formation are similar on both surface types.
These findings suggest that surface nucleation rates are more sensitive to kinetic drivers than previously believed and that cooperative interactions between oppositely charged surface species play important roles in directing the onset of silica nucleation. Further experiments to test the importance of these cooperative interactions with patterned NH3+/COO− substrates, and aminated surfaces with solution-borne anionic species, confirm that silica nucleation is most rapid when oppositely charged species are proximal.
It is interesting to note that virtually all in vitro studies performed so far on the effect of additives on amorphous silica formation focused on N-containing skeletons (primary, secondary, tertiary amines and organoammonium cations). Of course, this is not surprising because all thus far discovered biomacromolecules that are directly or indirectly related to biosilicification contain N moieties in their backbone. Therefore, the question that arises is whether N-based cations (–NH3+, –NH2R+, NHR2+, –NR3+) present either in biopolymers or synthetic polymers are specifically necessary to affect (either accelerate or retard) silicification.
In this paper we report the effect of three linear polyethylene glycol-based oligomers, Fig. 1, that possess phosphonium groups on both ends on the condensation of silicic acid at circumneutral pH.
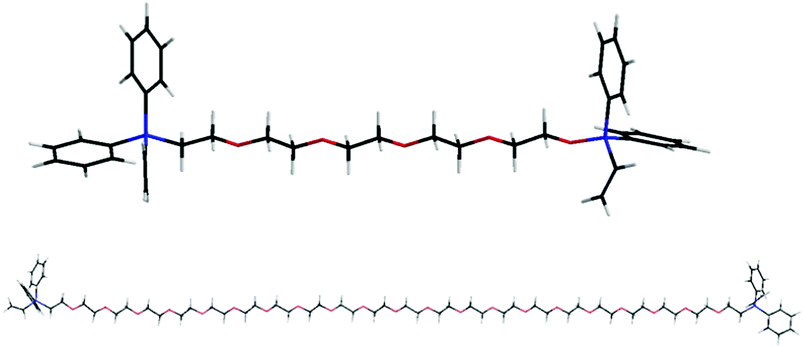 | ||
| Fig. 1 Schematic structure of PEGP+-200 (upper) and PEGP+-1000 (lower), drawn to scale. PEGP+-4000 is ∼4 times longer than PEGP+-1000. Colour codes: C black, P blue, O red, H white. | ||
Based on these results we can state that silicic acid condensation in vitro and at neutral pH is affected by cationic additives that possess P-based cationic groups, and not N-based cationic moieties. We can therefore propose that silicic acid stabilisation may be a “promiscuous” process that can be enabled by macromoleculesthat posses any cationic group in their backbone. It should be mentioned that these phosphonium dications are compounds of low toxicity.27
Results and discussion
Synthesis and characterization of phosphonium bolaamphiphiles
The polymer-analogous quaternization reaction is:HO–(EO)n–OH + HX + PR3−nR′n→−XR′n′R3−n′P+-(EO)n-P+R3−n′R′n′X−
where: R: C6H5, R′: −CH![[double bond, length as m-dash]](https://www.rsc.org/images/entities/char_e001.gif) CH2, n′:1, X
CH2, n′:1, X![[double bond, length as m-dash]](https://www.rsc.org/images/entities/char_e001.gif) Cl
Cl
The main characteristics of the poly(oxyethylene)s functionalized with phosphonium salts are presented in Table 1.
| Phosphonium Product | Phosphonium Moiety, X−R′nR3-nP+ | MW | P Content (weight%)b | yc | GM (mmoles X−R′nR3-nP+/g of polymer)d |
|---|---|---|---|---|---|
a Explanation of symbols. Gi: initial group of type hydroxyl. Gf: final group of type quaternary phosphonium salts. x: fraction of poly(oxyethylene) unit bearing initial group Gi, x = 1. y: fraction of poly(oxyethylene)unit bearing final group Gf. MGi: molecular weight of the initial group Gi. MGf: molecular weight of the final group Gf. EO: the chain of the poly(oxyethylene)s. n: the medium number of the groups of the oxyethylene type. MEO: molecular weight of the chain of the poly(oxyethylene)s. Mmi: average molecular weight of the initial polyethylene glycol. Mmf: average molecular weight of the poly(oxyethylene)s functionalized with phosphonium end groups. m: the medium number of the Gi groups from initial polyethylene glycol and respectively the number of the Gf groups in poly(oxyethylene)s functionalized with phosphonium end groups, m = 2% P: phosphorus percentage in the poly(oxyethylene)s functionalized with phosphonium end groups. AP: atomic weight of P. GM: the chemical modification degree.
b The phosphorus content in the functionalized copolymers was used in order to determine their functionalization degrees.26
c
 , Mmi = MEO + m x MGi
d , Mmi = MEO + m x MGi
d
 , Mmf = Mmi + m y (MGf − MGi) , Mmf = Mmi + m y (MGf − MGi)
|
|||||
| PEGP + -200 | (C6H5)3P+ | 623 | 3.45 | 0.15 | 0.53 |
| PEGP + -1000 | (CH![[double bond, length as m-dash]](https://www.rsc.org/images/entities/char_e001.gif) CH2)(C6H5)2P+ CH2)(C6H5)2P+ |
1417 | 2.79 | 0.57 | 0.45 |
| PEGP + -4000 | (C6H5)3P+ | 4497 | 1.16 | 0.95 | 0.21 |
The main absorption band in the IR spectra of the PEGP+ polymers is at 1430 cm−1 assignment P-C(phenyl) demonstrates that the quaternization reaction has taken place (see ESI,† Fig. S13–S15). The presence of the aromatic rings of the phenylphosphonium quaternary salts bonded on poly(oxyethylene)s was verified through the analysis of the UV spectra (see ESI,† Fig. S21–S23). The band corresponding to the π–π* transitions was determined at 271 nm. The presence of the phenylphosphonium quaternary salts bound on PEG support is confirmed by the 31P–NMR spectrum which shows a singlet at 14.59 ppm and by the 1H–NMR spectrum as follows: 3.60 (s, –CH2–), 4.67 (–CH![[double bond, length as m-dash]](https://www.rsc.org/images/entities/char_e001.gif) CH2), 8.00–7.20 (m, –C6H5) (see ESI,† Fig. S24–S25).
CH2), 8.00–7.20 (m, –C6H5) (see ESI,† Fig. S24–S25).
Silicification experiments
A simple, time-efficient and reliable screening method is used for assessing the stabilisation of silicic acid by water-soluble additives.28 This is based on the well-established silicomolybdate spectrophotometric method that allows quantitative determination of monomeric silicic acid (see Experimental).29 Thus, the efficiency of additives under study can be quantified by monitoring silicic acid levels over time. We have performed “long-term” (sampling times 24, 48, and 72 h) and “short-term” experiments (sampling times every hour for an 8 h period).Long-term experiments
In the absence of additives silicic acid condensation takes place readily at pH 7 to yield amorphous silica. The first measurement (at 24 h) indicates that its equilibrium concentration (∼180 ppm) is reached. The presence of PEGP+-200 essentially does not alter polymerization of silicic acid, Fig. 2. Various concentrations of the additive were tested (40–150 ppm), but no stabilisation effect was noted. PEGP+-1000 was then tested by the same methodology, and at the same concentrations (40–150 ppm), Fig. 3. A strong silicic acid stabilisation effect was observed, even at its lowest concentration, 40 ppm. It is worth-noting that in this case the stabilisation effect of PEGP+-1000 is concentration dependent, as it increases, as PEGP+-1000 concentration increases. At 150 ppm PEGP+-1000 stabilises ∼430 ppm silicic acid. Furthermore, the strong stabilizing effect of PEGP+-1000 is supported by the 48 h and 72 h measurements. For example, after 48 h (at 150 ppm concentration) ∼405 ppm silicic acid are stabilised, and after 72 h, ∼395 ppm silicic acid remain soluble. This is remarkable, as after 72 h, only 105 ppm (from the initial 500 ppm) silicic acid are “lost” to polymerization. The effect of PEGP+-4000 is similar to that of PEGP+-1000, Fig. 4.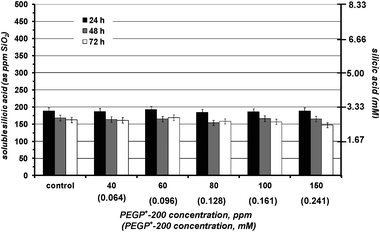 | ||
| Fig. 2 The effect of various concentrations of PEGP+-200 (40–150 ppm) on silicic acid stabilisation during a 3 day period. PEGP+-200 has virtually no effect on the condensation reaction. | ||
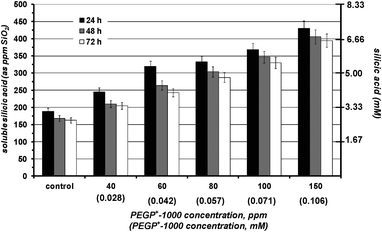 | ||
| Fig. 3 The effect of various concentrations of PEGP+-1000 (40–150 ppm) on silicic acid stabilisation during a 3 day period. A strong stabilizing effect is observed. | ||
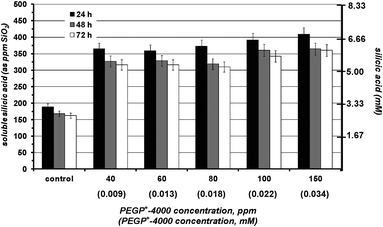 | ||
| Fig. 4 The effect of various concentrations of PEGP+-4000 (40–150 ppm) on silicic acid stabilisation during a 3 day period. A strong stabilizing effect is observed. | ||
One major difference is that PEGP+-4000 induces silicic acid stabilisation (∼365 ppm at 24 h) even at “low” concentrations (40 ppm). Upon concentration increase, there is a minor increase in stabilizing effect. Finally, PEGP+-4000 at 150 ppm concentration can stabilise ∼410 ppm silicic acid, after 24 h.
A meaningful comparison between the three PEGP+ additives can be done by examining the stabilised silicic acid (during 24–48–72 h studies) for the same concentration of the three additives, 150 ppm. This is shown in Fig. 5, clearly demonstrating the superb inhibitory activity of PEGP+-1000 and PEGP+-4000.
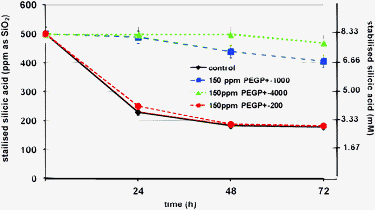 | ||
| Fig. 5 Comparison of silicic acid stabilisation by the three PEGP+ diphosphonium cations (at 150 ppm concentration). | ||
Short-term experiments
The above-described “long term” silicification experiments reveal valuable information about the stabilizing effect exerted by the PEGP+ additives at a time scale > 24 h. However, useful information can be extracted from “short-term” (8 h) silicification runs at the early stages of silicic acid condensation. During these studies, aliquots from the working solution are drawn every hour for the first 8 h. First, PEGP+-200 was tested, at concentrations 100 and 150 ppm, Fig. 6. The results show a negligible stabilisation effect, and confirm those of the 3-day runs that PEGP+-200 is unable to stabilise silicic acid, even during the first stages of the condensation reaction.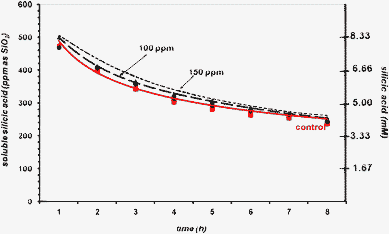 | ||
| Fig. 6 The effect of PEGP+-200 (at 100 (0.161) and 150 (0.241) ppm (mM) levels) on silicic acid stabilisation, during an 8 h period. | ||
When PEGP+-1000 is tested in 8 h runs, at concentrations 40, 80, and 100 ppm, a concentration-dependent stabilisation effect is observed, Fig. 7. First, at 40 ppm, PEGP+-1000 does not exert any stabilisation beyond the “control”. At the end of the 8 h period ∼280 ppm silicic acid remains soluble (compare these to the measurement of 244 ppm observed at 24 h during the 3 day experiments, Fig. 3). Increasing the PEGP+-1000 concentration to 80 ppm has a notable increase in its stabilizing ability. Now, there is a clear increase in soluble silicic acid (~360 ppm, after 8 h). Further a PEGP+-1000 concentration increase to 100 ppm causes additional stabilisation improvement (∼400 ppm after 8 h). The observed concentration-dependence of the stabilizing ability of PEGP+-1000 in these “short-term” runs is consistent with that observed during the “long-term” runs (see above).
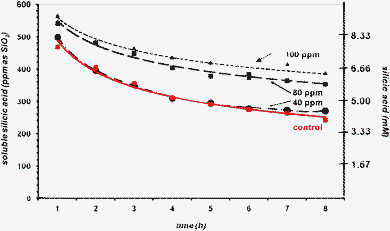 | ||
| Fig. 7 The effect of PEGP+-1000 (at 40 (0.028), 80 (0.057) and 100 (0.071) ppm (mM) levels) on silicic acid stabilisation, during an 8 h period. | ||
Finally, PEGP+-4000 was tested (at 40, 100 and 150 ppm levels) for silicic acid stabilisation in 8 h runs, Fig. 8. A strong stabilisation effect is observed at 100 ppm PEGP+-4000 concentration, causing ∼380 ppm silicic acid to remain soluble. Upon PEGP+-4000 concentration increase to 150 ppm, ∼440 ppm silicic acid are stabilised.
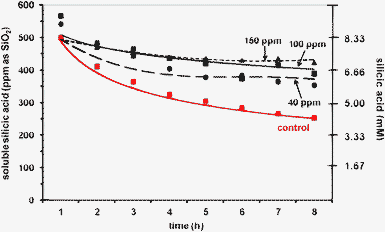 | ||
| Fig. 8 The effect of PEGP+-4000 (at 40 (0.009), 100 (0.022) and 150 (0.034) ppm (mM) levels) on silicic acid stabilisation, during an 8 h period. | ||
Characterization of colloidal silica precipitates
The colloidal silica precipitates were isolated after 7 days for scanning electron microscopy (SEM) studies. First, we wanted to ensure complete mass balance for silica. Silicic acid was ∼150 ppm (2.50 mM) for the control. This concentration corresponds to ∼18 mg of solid silica. The amount of silica precipitate isolated was 488 mg. The silicic acid content added to the precipitate weight comes up to 506 mg, very close to the calculated initial silica 500 mg. Similar calculations for selected experiments (corresponding to the SEM studies) in the presence of additives gave ∼200 ppm (3.33 mM) silicic acid, or 20 mg. This, added to ∼490 mg of precipitate gives a total silica weight of 510 mg. The final weight is consistently a bit higher that the calculated 500 mg, most likely due to adventitious water.We also studied silica precipitates by EDS and discovered the presence of P. For example, silica precipitates formed in the presence of 150 ppm PEGP+-1000 contain 1.83% P (see ESI,† Fig. S19). A line scan of a silica surface (22 μm in length) reveals that PEGP+-1000 is evenly distributed into the silica matrix (see ESI,† Fig. S20).
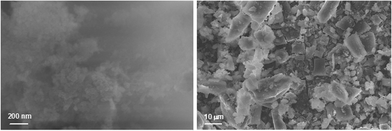 | ||
| Fig. 9 Silica precipitates in the absence of any additives (control) after 7 days. | ||
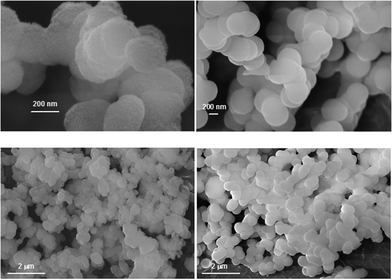 | ||
| Fig. 10 Silica precipitates in the presence of PEGP+-1000 (100 ppm (0.071 mM), left; 150 ppm (0.034 mM), right) after 7 days. | ||
In the presence of PEGP+-4000 silica precipitates present some important differences from those that form in the presence of PEGP+-1000 (Fig. 11). More specifically, in the presence of 100 ppm PEGP+-4000 silica particles seem to form a fairly uniform film. Particle size is < 10 nm (Fig. 11, upper left). In the presence of 150 ppm PEGP+-4000 silica particles are larger (∼100 nm, Fig. 11, upper right) and more round. It is worth-noting that in this case only larger silica particles are observed (Fig. 11, lower right).
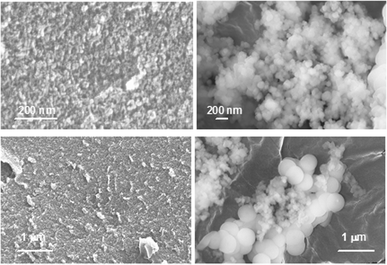 | ||
| Fig. 11 Silica precipitates in the presence of PEGP+-4000 (100 ppm, left; 150 ppm, right) after 7 days. | ||
The effect of the ethylene oxide chain (–CH2CH2O–)
In order to investigate whether the ethylene oxide chain (–CH2CH2O–) plays a role in silicic acid condensation or inhibition, we investigated three neutral, phosphorus-free PEG oligomers, PEG-200, PEG-1000 and PEG-4000, as phosphorus-free additives in silicification experiments. The results were intriguing, Fig. 12.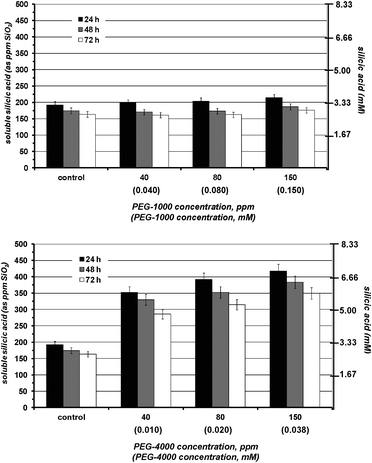 | ||
| Fig. 12 The effect of various concentrations (40, 80, 150 ppm) of PEG-1000 (upper) and PEG-4000 (lower) on silicic acid stabilisation during a 3 day period. A strong stabilizing effect is observed only for PEG-4000. | ||
PEG-200 showed no silicic acid stabilisation beyond the “control” in 3 day experiments (results not shown). PEG-1000 (Fig. 12, upper) showed a very minor stabilisation effect (23 ppm silicic acid stabilisation above the “control”) at 150 ppm concentration, after 24 h. However, PEG-4000 exhibited remarkable inhibitory activity, comparable to PEGP+ 4000, as shown in Fig. 12, lower. These results prompted us to further investigate the stabilisation effects of PEG-4000 in “short-term” experiments (< 8 h). The results are shown in Fig. 13. PEG-4000 exhibits a strong stabilisation effect, even at the level of 40 ppm, whereas, at 150 ppm quantitative stabilisation of silicic acid is observed. A possible explanation for the stabilizing behavior of PEG-4000 is given below.
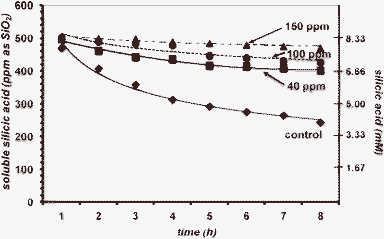 | ||
| Fig. 13 The effect of PEG-4000 (at 40, 100 and 150 ppm levels) on silicic acid stabilisation during an 8 h period. | ||
Structure/function relationships
Our present work is based on a number of approaches: (a) utilization of water-soluble silicate as the silica source. (b) The pH of the condensation reaction is 7.00. (c) The initial silicate concentration in our experiments is 500 ppm (as SiO2), corresponding to ∼8.33 mM. (d) The focus of our experiments was on delaying silicic acid condensation for an extended period of time, while collecting morphological characterization data on silica particles that formed due to inhibitor inability to cease silicic acid condensation.An analysis of the above results was sought in an effort to correlate molecular structure and inhibitory activity. This approach is presented in detail in Table 2. There are a number of facts and hypotheses taken into account for this: (a) The cationic phosphonium groups are involved in inhibition. (b) Each–PR3+ group stabilises one silicic acid molecule via, presumably, electrostatic interactions. Hydrogen bonding is not possible in this case, as it is with amine-containing additives. This theoretical estimation leads to 2 silicic acid molecules stabilised per one end-capped oligomeric chain of PEGP+. (c) Polyethylene glycol oligomers PEG-200 and PEG-1000 do not exhibit any appreciable inhibitory activity at concentrations of up to 150 ppm, as verified experimentally. This strongly implies that the ethylene oxide (EO, “–CH2CH2O–”) moieties in these two oligomers are not involved in silicic acid stabilisation. (d) PEG-4000 on the other hand exhibits remarkable inhibitory effects on silicic acid polymerization.
| Phosphonium additive(s) | Polymer molar concentration (M) | Initial [Si]/[P] molar ratio a | Soluble silicic acid stabilisation (ppm)b | Soluble silicic acid (M) | Soluble silicic acid/PEGP+ molar ratio | Estimated silicic acid/PEGP+ molar ratioc | Inhibitor efficiency (IE)d |
|---|---|---|---|---|---|---|---|
| a The initial [Si]/[P] molar ratio is calculated by dividing the initial silicic acid concentration (500 ppm, 8.33 mM) by twice the molar concentration of each additive (because each additive molecule contains two phosphorus atoms). b These data indicate measured soluble silicic acid (in ppm) at 24 h after subtraction of soluble silicic acid without additives (“control”). c The estimation of the predicted silicic acid/polymer molar ratio was based on the hypothesis that one phosphonium cationic group stabilises one silicic acid molecule. d Defined as the number of silicic acid molecules stabilised (beyond the “control”) as found experimentally divided by the estimated silicic acid molecules stabilised per chain of polymer. Inhibitor efficiency of 1 means that the predicted (“stoichiometric”) amount of silicate remains soluble. Naturally, the higher this number is, the more efficient the inhibitor is. When inhibitor efficiency is > 1, then the polymer acts as silicic acid condensation inhibitor. When inhibitor efficiency (IE) is < 1, then the polymer is an ineffective inhibitor. | |||||||
| PEGP + -200 (40 ppm) | 6.42 × 10⁻⁵ | 64.87 | 1 | 1.04 × 10⁻⁵ | 0.16 | 2 | 0.08 |
| PEGP + -200 (60 ppm) | 9.63 × 10⁻⁵ | 43.25 | 2 | 2.08 × 10⁻⁵ | 0.22 | 2 | 0.11 |
| PEGP + -200 (80 ppm) | 1.28 × 10⁻⁴ | 32.54 | 3 | 3.12 × 10⁻⁵ | 0.24 | 2 | 0.12 |
| PEGP + -200 (100 ppm) | 1.61 × 10⁻⁴ | 25.87 | 5 | 5.20 × 10⁻⁵ | 0.32 | 2 | 0.16 |
| PEGP + -200 (150 ppm) | 2.41 × 10⁻⁴ | 17.28 | 5 | 5.20 × 10⁻⁵ | 0.22 | 2 | 0.11 |
| PEGP + -1000 (40 ppm) | 2.82 × 10⁻⁵ | 147.69 | 14 | 1.46 × 10⁻⁴ | 5.18 | 2 | 2.59 |
| PEGP + -1000 (60 ppm) | 4.23 × 10⁻⁵ | 98.46 | 110 | 1.15 × 10⁻³ | 27.19 | 2 | 13.60 |
| PEGP + -1000 (80 ppm) | 5.65 × 10⁻⁵ | 73.72 | 123 | 1.28 × 10⁻³ | 22.65 | 2 | 11.33 |
| PEGP + -1000 (100 ppm) | 7.06 × 10⁻⁵ | 58.99 | 159 | 1.66 × 10⁻³ | 23.51 | 2 | 11.76 |
| PEGP + -1000 (150 ppm) | 1.06 × 10⁻⁴ | 39.29 | 220 | 2.29 × 10⁻³ | 21.60 | 2 | 10.80 |
| PEGP + -4000 (40 ppm) | 8.89 × 10⁻⁶ | 468.50 | 176 | 1.83 × 10⁻³ | 205.85 | 2 | 102.93 |
| PEGP + -4000 (60 ppm) | 1.33 × 10⁻⁵ | 313.16 | 171 | 1.78 × 10⁻³ | 133.83 | 2 | 66.92 |
| PEGP + -4000 (80 ppm) | 1.79 × 10⁻⁵ | 232.68 | 185 | 1.93 × 10⁻³ | 107.82 | 2 | 53.91 |
| PEGP + -4000 (100 ppm) | 2.23 × 10⁻⁵ | 186.77 | 204 | 2.13 × 10⁻³ | 22.70 | 2 | 11.35 |
| PEGP + -4000 (150 ppm) | 3.36 × 10⁻⁵ | 123.96 | 220 | 2.29 × 10⁻³ | 68.15 | 2 | 34.08 |
Inhibitor efficiency (IE) demonstrates the ability of the inhibitor to stabilise as much silicic acid as possible, at the lowest possible concentration. It should be noted that when “inhibitor efficiency” is 1, then the amount of silicic acid stabilised in soluble form is the same as that predicted by the appropriate calculations. It is obvious that for maintaining high “Si” levels soluble beyond silicic acid supersaturation, “inhibitor efficiency” should be > 1. PEGP+-200 is a poor inhibitor, as IE is invariably < 1, regardless of PEGP+-200 concentration. PEGP+-1000 shows low IE at 40 ppm, but there is a “jump” in IE, 13.60, at 60 ppm concentration. Further concentration increase induces a small drop in IE, but the latter remains > 10 for all higher concentrations. PEGP+-4000 at 40 ppm exhibits IE of 102.93. However, upon concentration increase a gradual drop in IE is observed: 66.92 (60 ppm), 53.91 (80 ppm), 11.35 (60 ppm), 34.08 (150 ppm).
Further useful information can be extracted from the dependence of IE on the –CH2CH2O– chain length. For this, we calculated the P···P distance for the three PEGP+ diphosphonium cations. The P···P distance is ∼19 Å for PEGP+-200, ∼79 Å for PEGP+-1000, and ∼328 Å for PEGP+-4000, assuming the oligomers are fully extended. In Fig. 14 we plotted IEvs. P···P distance (in Å) for three oligomer concentrations, 40, 80, and 150 ppm.
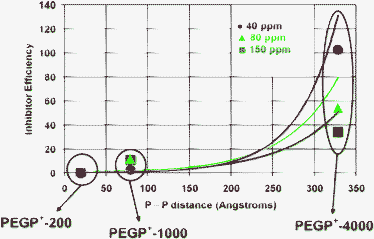 | ||
| Fig. 14 The effect of P···P distance on IE. It is clearly shown that IE increases as the P···P distance becomes longer. This effect is more dramatic in low concentrations, with IE(40 ppm) > IE(80 ppm) > IE(150 ppm) (see right side of the graph). Lines are drawn to aid the reader. | ||
IE data were taken from Table 2 and refer to 24 h polymerization time. It is apparent that IE increases, as the P···P distance increases. Furthermore, the dependence of IE on oligomer concentration is insignificant for PEGP+-200, rather small for PEGP+-1000, but dramatic for PEGP+-4000.
Another way to treat the results presented in Table 2 is to plot the stabilized (beyond the “control”) silicic acid concentration (in mM) vs. the molar concentration of the phosphonium groups, [P] (in mM). These results are shown in Fig. 15. It becomes immediately evident that there is no global linear (or other) concentration-dependence of stabilised silicic acid. The lack of any discernible dependence of [silicic acid] on [P] is a clear indication that inhibitory activity is not solely dependent on the –PR3+groups. However, the points can be easily grouped into three groups, corresponding to the three phosphonium additives. Within each group, there seems to be a linear dependence of [silicic acid] on [P].
![Stabilised silicic acid concentration (mM) dependence on concentration of P (mM). [P] is the molar concentration of the phosphonium groups. Red rhombi (◆) refer to PEGP+-200, blue squares (■) refer to PEGP+-1000, and green triangles (▲) correspond to PEGP+-4000.](/image/article/2012/RA/c1ra00448d/c1ra00448d-f15.gif) | ||
| Fig. 15 Stabilised silicic acid concentration (mM) dependence on concentration of P (mM). [P] is the molar concentration of the phosphonium groups. Red rhombi (◆) refer to PEGP+-200, blue squares (■) refer to PEGP+-1000, and green triangles (▲) correspond to PEGP+-4000. | ||
Furthermore, a similar analysis for the PEG additives was sought for the neutral, phosphorus-free PEG polymers (as was done for the PEGP+ additives in Table 2). In the absence of any cationic moieties, the interaction of silicic acid with the polymer backbone can only be envisioned through hydrogen bonds, (HO)3Si–O–H···O–CH2CH2–. It was assumed that one hydrogen bond forms for each EO unit. The IE (inhibitor efficiency) of PEG-1000 is < 0.10, which means that the polymer is a poor silicic acid stabiliser. The estimated number of stabilised silicic acid molecules per one molecule of PEG-4000 is 92. However, at 40 ppm concentration, it can stabilise 167 silicic acid molecules, with an IE of 1.82. At 80 ppm levels, PEG-4000 stabilises 108 silicic acid molecules, with IE = 1.17.
Fig. 16 shows the amount of stabilised silicic acidvs. the number of EO units. From this graph it becomes evident that as the number of EO units increases (from PEG-200, 9; to PEG-1000, 21; to PEG-4000, 91), the amount of stabilised silicic acid increases. In the absence of any other moieties besides EOs, these results convincingly demonstrate that the neutral –CH2CH2O– moieties are able to stabilise silicic acid.
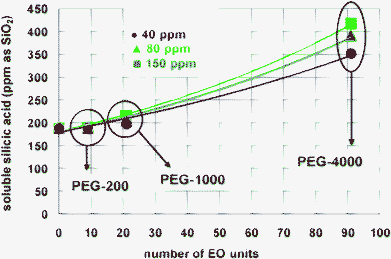 | ||
| Fig. 16 The effect of the number of –CH2CH2O– units on silicic acid stabilisation. As the number of EO units increases the PEG polymer becomes more efficient. The values for soluble silicic acid were taken from 24 h experiments. Lines are drawn to aid the reader. | ||
Another revealing feature of Fig. 14 (taken together with results shown in Table 2 and Fig. 12) is that both EO and –PR3+ moieties contribute to silicic acid stabilisation, but only when certain structural features are present. Silicification experiments with PEGP+-200 and PEG-200 demonstrate that both oligomers are virtually ineffective (same as the “control”). It appears that the close proximity of the two end phosphonium groups (P···P distance is ∼19 Å), together with the low number of –CH2CH2O– units (EO units = 5) result in poor silicic acid stabilisation efficiency.
The results obtained with PEGP+-1000 and PEG-1000 are convincing evidence that the two end phosphonium groups (P···P distance is ∼79 Å) strongly contribute to silicic acid stabilisation, when at the same time the contribution of –CH2CH2O– units (number of EO units = 21) is very minor (PEG-1000 is virtually ineffective). Lastly, the observations noted with PEGP+-4000 and PEG-4000 reveal that the roles of the two end phosphonium groups (P···P distance is ∼328 Å), and the –CH2CH2O– units (number of EO units = 91) are reversed. The contribution of the EO units is dominant (neutral PEG-4000 is a strong silicic acid stabiliser) and that of the phosphonium groups is minor. These arguments are presented in Table 3.
| Additives | Polymer charge | Polymer concentration (ppm) | Soluble silicic acid/polymer molar ratioa | % Contribution of phosphonium cationic moieties | % Contribution of EO units |
|---|---|---|---|---|---|
| a These values are taken from Table 2. | |||||
| PEGP + -1000 | cationic | 40 | 5.18 | 69.6 | 30.4 |
| PEG-1000 | neutral | 40 | 1.56 | — | 100 |
| PEGP + -4000 | cationic | 40 | 205.85 | 18.9 | 81.1 |
| PEG-4000 | neutral | 40 | 167.00 | — | 100 |
Inhibition of silica growth is not entirely understood. It should be emphasized that silicic acid polymerization inhibition and colloidal silica stabilisation are two completely different approaches. The latter aims at maintaining small silica colloids dispersed (in suspension) and at avoidance of deposition. In contrast, the former delays (ideally ceases) silicic acid polymerization, thus maintaining silicate in its soluble forms. Colloidal silica ideally does not form in that case. This approach is sought in this research. The inhibitor “disrupts” condensation polymerization of silicic acid by interfering with nucleophilic attack of neighboring silicate ions (an SN2-like mechanism).
PEGP+ oligomers associate with silicic acid molecules and silicate ions or small silica oligomers, thus preventing further growth. As mentioned above, the silica supersaturations achieved in the presence of PEGP+ (Table 2) support the conclusion that silicic acid stabilisation is not a stoichiometric phenomenon.32 Lastly, there appears to be an interplay of roles in the silicic acid stabilisation mechanism between the phosphonium cationic groups and the neutral EO moieties. Apparently, both contribute to activity, but their role strongly depends on structural features of the polymer (P···P separation, number of EO units).
Conclusion
The principal highlights/conclusions of this research are given below:(1) Our results herein strongly support the idea that silicic acid condensation can be inhibited by cationic additives (oligomers) that possess cationic moieties other than nitrogen-based cations. Phosphonium-based cationic additives can exert a profound stabilizing effect. In this regard, inhibition of silicic acid condensation appears to be “promiscuous” to any polymeric/oligomeric cationic additive.
(2) The stabilisation effect is expressed as the ability to inhibit/retard condensation of silicic acid to form amorphous silica. In this regard, PEGP+-200 has virtually no effect on silicic acid condensation, in contrast to PEGP+-1000 and PEGP+-4000, which both act as efficient inhibitors, both in “short-term” (8 h) and “long-term” (3 days) runs.
(3) The stabilizing effect of PEGP+-1000 and PEGP+-4000 is concentration-dependent, reaching its highest values at concentrations > 100 ppm of additive.
(4) Both PEGP+-1000 and PEGP+-4000 act as efficient silicic acid condensation inhibitors even in time scales in the order of 3 days.
(5) PEG polymers (the neutral, phosphorus-free analogs of PEGP+'s) also show silicic acid stabilisation activity, but only for the PEG-4000 analog (91 EO units). PEG-200 is totally ineffective and PEG-1000 is a mediocre stabiliser.
(6) It was calculated that for PEGP+-1000, 69.6% of inhibitory activity stems from the presence of the two end phosphonium groups and 30.4% from the EO units. By analogy, similar calculations for PEGP+-4000 showed a reversal of roles: only 18.9% of inhibitory activity originates in the two end phosphonium groups and 81.1% from the EO units.
Experimental
Materials
Schematic structures of the polymers used in this study are shown in Fig. 1. Polyethyleneglycol (PEG-200, Fluka, p.a.; PEG-1000 and PEG-4000, Merck, p.a.), vinyldiphenylphosphine (Aldrich, p.a.), triphenylphosphine (Merck, p.a.), benzene (Merck, p.a.), hydrogen chloride (Reactivul, 33% w/w, ρ = 1.167 g cm−3), ethylether (Reactivul, p.a.) were from commercial sources. Sodium silicate Na2SiO3·5H2O, ammonium molybdate((NH4)6Mo7O24·4H2O), and oxalic acid (H2C2O4·2H2O) were from EM Science (Merck). Sodium hydroxide (NaOH) was from Merck, hydrochloric acid 37% was from Riedel de Haen. All reagents were used as received from suppliers. Acrodisc filters (0.45 μm) were from Pall-Gelman Corporation. In-house, deionized water was used for all experiments. This water was tested for soluble silica and was found to contain negligible amounts.
Instrumentation
ATR-IR spectra were collected on a Thermo-Electron NICOLET 6700 FTIR optical spectrometer and ultraviolet spectral data were recorded with a CECIL AQUARIUS-SERIA 7000 spectrometer, in ethanol, at 298 K. IR spectra were recorded on a FT-IR Perkin–Elmer FT 1760. Measurements of soluble silicic acid were carried out using a HACH 890 spectrophotometer from the Hach Co., Loveland, CO, USA SEM images were collected on a scanning electron microscope LEO VP-35 FEM. All NMR spectra were recorded with a Bruker DRX 400 MHz spectrometer, in chloroform, at 298 K. All chemical shifts were measured using the XSI scale and TMS as internal standard.33Mass spectra were obtained using a mass spectrometer Esquire 6000 ESI (electrospray ionization) from Bruker-Daltonik. All the compounds were diluted before measurements; at 5 pmol μL−1 (each ml of solution contained 50 μl ammonia sol. 25%). The solvent used was acetonitrile. A small syringe pump is included with the instrument system to provide for the introduction of samples directly to the electrospray. The solution was injected into the spray chamber by a Hamilton syringe, with a constant flow of 240 μl h−1. The API-ESI (Atmospheric Pressure Interface-ElectroSpray Ionization) generates ions, focuses and transports them into the ion trap mass analyzer. All the mass spectra were obtained in the positive and in the negative mode.Syntheses and characterisation of phosphonium-grafted dicationic ethylene oxide bolaamphiphiles, PEG+-X (X = 200, 1000, 4000)
Silicification protocols
The protocols for all experiments and measurements described herein have been reported in detail elsewhere.34Molybdate-reactive silicic acid was measured using the silicomolybdate spectrophotometric method, which has a ± 5% accuracy.35 Reproducibility was satisfactory. Briefly, the procedures are outlined as follows.![[thin space (1/6-em)]](https://www.rsc.org/images/entities/char_2009.gif) 000 ppm stock solution) were added to achieve desirable inhibitor concentration. These ranged from 10–20–40–60–80 ppm and the volumes where added were 100–200–400–600–800 μL for the three inhibitors. After that the same procedure for the control test was followed.
000 ppm stock solution) were added to achieve desirable inhibitor concentration. These ranged from 10–20–40–60–80 ppm and the volumes where added were 100–200–400–600–800 μL for the three inhibitors. After that the same procedure for the control test was followed.
Acknowledgements
To the Secretariat of Science & Technology (Greece, contract # GSRT 170c) and to the Ministry of Education and Research (Romania) for funding this work in the framework of a Bilateral Research & Technology GR-RO Cooperation Program.References
- (a) G. Pohnert, Angew. Chem., Int. Ed., 2002, 41, 3167–3169 CrossRef CAS; (b) T. Coradin, P. J. Lopez, C. Gautier and J. Livage, C. R. Palevol, 2004, 3, 443–452 CrossRef; (c) H. C. Schröder, X. Wang, W. Tremel, H. Ushijima and W. E. G. Müller, Nat. Prod. Rep., 2008, 25, 455–474 RSC.
- P. Tréguer, D. M. Nelson, A. J. Van Bennekom, D. J. DeMaster, A. Leynaert and B. Quéguiner, Science, 1995, 268, 375–379 Search PubMed.
- Q. Sun, E. G. Vrieling, R. A. van Santen and N. A. J. M. Sommerdijk, Curr. Opin. Solid State Mater. Sci., 2004, 8, 111–120 CrossRef CAS.
- M. Hildebrand, B. E. Volcani, W. Gassmann and J. I. Schroeder, Nature, 1997, 385, 688–689 CrossRef CAS.
- D. H. Robinson and C. W. Sullivan, Trends Biochem. Sci., 1987, 12, 151–154 CrossRef CAS.
- D. J. Conley, S. S. Kilham and E. Theriot, Limnol. Oceanogr., 1989, 34, 205–213 CrossRef CAS.
- N. Kroger, R. Deutzmann and M. Sumper, Science, 1999, 286, 1129–1132 CrossRef CAS.
- N. Kroger, S. Lorenz, E. Brunner and M. Sumper, Science, 2002, 298, 584–586 CrossRef.
- (a) H. Ehrlich in Encyclopedia of Geobiology, J. Reitner and V. Thiel (ed.) Springer, 2011, pp.796-808 Search PubMed; (b) H. Ehrlich, K. D. Demadis, O. S. Pokrovsky and P. G. Koutsoukos, Chem. Rev., 2010, 110, 4656–4689 CrossRef CAS; (c) H. Ehrlich, Int. Geol. Rev., 2010, 52, 661–699 CrossRef.
- M. Fairhead, K. A. Johnson, T. Kowatz, S. A. McMahon, L. G. Carter, M. Oke, H. Liu, J. H. Naismith and C. F. van der Walle, Chem. Commun., 2008, 1765–1767 RSC.
- S. V. Patwardhan and S. J. Clarson, J. Inorg. Organomet. Polym., 2003, 13, 193–203 CrossRef CAS.
- S. V. Patwardhan and S. J. Clarson, J. Inorg. Organomet. Polym., 2003, 13, 49–53 CrossRef CAS.
- S. V. Patwardhan, N. Mukherjee and S. J. Clarson, Silicon Chem., 2002, 1, 47–55 CrossRef CAS.
- S. V. Patwardhan, N. Mukherjee and S. J. Clarson, J. Inorg. Organomet. Polym., 2002, 11, 193–198 CrossRef.
- S. V. Patwardhan, N. Mukherjee and S. J. Clarson, J. Inorg. Organomet. Polym., 2002, 11, 117–121 CrossRef.
- (a) M. R. Knecht and D. W. Wright, Langmuir, 2004, 20, 4728–4732 CrossRef CAS; (b) M. R. Knecht, M. R. S. L. Sewell and D. W. Wright, Langmuir, 2005, 21, 2058–2061 CrossRef CAS.
- D. B. Robinson, J. L. Rognlien, C. A. Bauer and B. A. Simmons, J. Mater. Chem., 2007, 17, 2113–2119 RSC.
- H. Menzel, S. Horstmann, P. Behrens, P. Bärnreuther, I. Krueger and M. Jahns, Chem. Commun., 2003, 2994 RSC.
- S. M. Jones, J. Non-Cryst. Solids, 2001, 291, 206–210 CrossRef CAS.
- (a) V. V. Annenkov, S. V. Patwardhan, D. Belton, E. N. Danilovtseva and C. C. Perry, Chem. Commun., 2006, 1521–1523 RSC; (b) D. J. Belton, S. V. Patwardhan, V. V. Annenkov, E. N. Danilovtseva and C. C. Perry, Proc. Natl. Acad. Sci.USA 2008, 105, 5963–5968 Search PubMed.
- P. T. Tanev, Y. Liang and T. J. Pinnavaia, J. Am. Chem. Soc., 1997, 119, 8616–8624 CrossRef CAS.
- D. Belton, S. V. Patwardhan and C. C. Perry, Chem. Commun., 2005, 3475–3477 RSC.
- M. J. Adeogun and J. N. Hay, Polym. Int., 1996, 41, 123–134 CrossRef CAS.
- H.-P. Hentze, S. R. Raghavan, C. A. McKelvey and E. W. Kaler, Langmuir, 2003, 19, 1069–1074 CrossRef CAS.
- A. F. Wallace, J. J. DeYoreo and P. M. Dove, J. Am. Chem. Soc., 2009, 131, 5244–5250 CrossRef CAS.
- (a) A. Popa, C. M. Davidescu, G. Ilia, S. Iliescu, G. Dehelean, R. Trif, R. L. Pacureanu and L. Macarie, Rev. Roum., 2003, 48(1), 41–48 Search PubMed; (b) A. Popa, G. Ilia, S. Iliescu, C. M. Davidescu, A. Pascariu and A. Bora, Rev. Chim., 2003, 54, 834–836 CAS; (c) A. Popa, M. Crisan, A. Visa and G. Ilia, Braz. Arch. Biol. Technol., 2011, 54, 107–112 CrossRef CAS.
- A. Popa, R. Trif, V. G. Curtui, G. Dehelean, S. Iliescu and G. Ilia, Phosphorus, Sulfur Silicon Relat. Elem., 2002, 177, 2195–2196 CrossRef CAS.
- (a) K. D. Demadis, E. Mavredaki, A. Stathoulopoulou, E. Neofotistou and C. Mantzaridis, Desalination, 2007, 213, 38–46 CrossRef CAS; (b) E. Mavredaki, E. Neofotistou and K. D. Demadis, Ind. Eng. Chem. Res., 2005, 44, 7019–7026 CrossRef CAS; (c) K. D. Demadis and A. Stathoulopoulou, Ind. Eng. Chem. Res., 2006, 45, 4436–4440 CrossRef CAS.
- R. K. Iler, The Chemistry of Silica; Wiley-Interscience: New York; 1979 Search PubMed.
- K. D. Demadis and E. Neofotistou, Chem. Mater., 2007, 19, 581–587 CrossRef CAS.
- (a) K. D. Demadis, A. Ketsetzi, K. Pachis and V. M. Ramos, Biomacromolecules, 2008, 9, 3288–3293 CrossRef CAS; (b) K. D. Demadis, K. Pachis, A. Ketsetzi and A. Stathoulopoulou, Adv. Colloid Interface Sci., 2009, 151, 33–48 CrossRef CAS.
- (a) E. Barouda, K. D. Demadis, S. Freeman, F. Jones and M. I. Ogden, Cryst. Growth Des., 2007, 7, 321–327 CrossRef CAS; (b) F. C. Meldrum, Int. Mater. Rev., 2003, 48, 187–224 CrossRef CAS; (c) N. H. de Leeuw and T. G. Cooper, Cryst. Growth Des., 2004, 4, 123–133 CrossRef CAS; (d) Y.-P. Lin and P. C. Singer, Water Res., 2005, 39, 4835–4843 CrossRef CAS.
- R. K. Harris, E. D. Becker, S. M. Cabral de Menezes, R. Goodfellow and P. Granger, Pure Appl. Chem., 2001, 73, 1795–1818 CrossRef CAS.
- (a) K. D. Demadis and E. Neofotistou, Desalination, 2004, 167, 257–272 CrossRef; (b) K. Spinde, K. Pachis, I. Antonakaki, E. Brunner and K. D. Demadis, Chem. Mater., 2011, 23, 4676–4687 CrossRef CAS; (c) K. D. Demadis and E. Mavredaki, Env. Chem. Lett., 2005, 3, 127–131 CrossRef CAS.
- (a) T. Coradin, D. Eglin and J. Livage, Spectroscopy, 2004, 18, 567–576 CAS; (b) G. B. Alexander, J. Am. Chem. Soc., 1953, 75, 5655–5657 CrossRef CAS; (c) V. W. Truesdale, P. J. Smith and C. J. Smith, Analyst, 1979, 104, 897–918 RSC; (d) V. W. Truesdale and P. J. Smith, Analyst, 1975, 100, 797–805 RSC; (e) V. W. Truesdale and P. J. Smith, Analyst, 1975, 100, 203–212 RSC.
Footnote |
| † Electronic Supplementary Information (ESI) available: Mass, FT-IR, UV-vis and NMR spectra of the three PEGP+ phosphonium compounds, and EDS of silica precipitates. See DOI: 10.1039/c1ra00448d/ |
| This journal is © The Royal Society of Chemistry 2012 |
