Carbon dioxide adsorption performance of N-doped zeolite Y templated carbons†
Jin
Zhou
,
Wen
Li
,
Zhongsheng
Zhang
,
Wei
Xing
and
Shuping
Zhuo
*
School of Chemical Engineering, Shandong University of Technology, Zibo, 255049, China. E-mail: zhuosp_academic@yahoo.com; Fax: +86 533 2781664; Tel: +86 533 2781664
First published on 28th October 2011
Abstract
N-Doped microporous carbons are prepared using zeolite NaY as a hard template with furfuryl alcohol/acetonitrile as carbon precursors. CO2 adsorption performances of these carbons are investigated intensively. Structure analysis shows that the replication of zeolite regularity, pore texture and the type of nitrogen functionalities strongly depends on the carbonization temperature. Basic nitrogen functionalities can be efficiently introduced into the carbon framework, which significantly facilitate CO2 uptake via chemical adsorption. The CO2 adsorption isotherms correlated with the Dubinin–Astakhov models, and the isosteric heats of adsorption are calculated using the Clausius–Clapeyron equation. The maximum CO2 adsorption capacity of 10.4 wt% is obtained for the YTC7 carbon due to its high surface area and abundant nitrogen functionalities. CO2 chemical adsorption on the carbons decreases with carbonization temperature due to the decomposition of basic nitrogen functionalities at higher temperature. High CO2 adsorption capacities of up to 9.3 wt% at 25 °C and 4.1 wt% at 70 °C are obtained for the YTC6 carbon. The present study suggests that low temperature vapor deposition of acetonitrile is a promising alternative method of toxic ammonia treatment for CO2 adsorption.
Introduction
Carbon dioxide (CO2) is one of the major greenhouse gases causing global warming. Therefore, there is growing interest in developing technologies for the efficient adsorption or storage of large quantities of carbon dioxide. Adsorption is considered to be one of the promising technologies available for capturing CO2 from flue gases.1–4 Up to now, several types of adsorbents have been used for CO2 adsorption, such as zeolites,5,6 mesoporous silica,7,8 metal oxide,9,10carbon nanotubes,11 and porous carbons.12–14 Porous carbons have attracted much more attention in CO2 adsorption than any other type of adsorbents due to their specific features such as high specific surface area, thermal and chemical stability, hydrophobic surface properties, and viable CO2-friendly sites on the pore surface. It is well known that carbon dioxide has a soft acidic nature, which indicates that the presence of strong basic functional groups such as amide groups can enhance the carbon dioxide adsorption capacity via chemical adsorption, especially at higher temperature or lower relative pressure of CO2.15,16 The nitrogen-rich carbons usually prepared by pyrolysis of nitrogen containing polymers17,18 or by ammoxidation of activated carbons,19,20 and CO2 adsorption experiments proved that the basic nitrogen-containing groups are much favorable for the adsorption of CO2. However, nitrogen containing polymers are always obtained via complicated synthesis routes, and ammonia is a chemical agent with severe pungency and high toxicity. Therefore, a simple method using lower toxicity chemicals has been a challenge for introducing basic nitrogen functionalities into the carbon adsorbents.Among different kinds of porous carbon materials, zeolite-templated carbons (ZTCs) are especially attractive due to their large surface area and highly ordered microporosity, which is helpful enhancing the capabilities of charge and gas storage. Since pioneering works performed by Kyotani and co-workers,22 many groups have prepared different types of ordered microporous carbons using various zeolites as templates,23–28 and those carbons have been investigated intensively for electrochemical double layer capacitors29–35 and hydrogen storage.33,36,37 However, studies of CO2 adsorption on ZTCs still have been very limited. The carbon replicas of zeolite Y prepared by the nanocasting process using acetylene and furfuryl alcohol (FA) as carbon precursors show larger CO2 capacities than the conventional activated carbons at high pressure.38 The recent work of Youn et al. shows that the nonoporous carbons templated from zeolite Y using furfuryl alcohol/butylenes as carbon precursors also exhibit high adsorption capacity of carbon dioxide at a high pressure of 40 bar.39 It was reported that the high adsorption capacity of ZTCs was due to their developed microporosity with large surface area. For the preparation of ZTCs, chemical vapor deposition (CVD) is usually adopted for carbon filling of the zeolite channels.26–28,32,36,38,39 Therefore, basic nitrogen-containing groups could be introduced by using nitrogen-containing molecules as a CVD substrate, such as acetonitrile.
In the present study, a series of N-doped microporous carbons were prepared by a two-step casting process using zeolite NaY (Na-form of zeolite Y) as the template and acetonitrile as the CVD substrate. The CO2 adsorption performance of those carbons is systematically studied.
Experimental
Reagents and instrumentation
Zeolite NaY (SiO2/Al2O3 ≥ 5.0) was supplied by Qingdao Wish Chemicals Co., Ltd. Acetonitrile and furfuryl alcohol (FA) were purchased from Sigma-Aldrich. All reagents were used as received from commercial sources without further purification.X-Ray diffraction (XRD) patterns were carried on a Brucker D8 Advance diffractometer with Cu Kα radiation. The microscopic features of the carbons were observed with a scanning electron microscope (SEM, Sirion 200 FEI Netherlands). The N-content and different types of N-containing functional groups on the carbon surface were determined by X-ray photoelectron spectroscopy (XPS). The XPS measurements were performed on PHI-700 (ULVAC-PHI, Japan) using a monochromated Al Kα excitation source. Nitrogen adsorption–desorption measurements were carried out at −196 °C with a Micromeritics ASAP 2020 static volumetric analyzer to determine surface area and pore size distribution (PSD) of the carbons. The carbon materials were degassed at 350 °C overnight before measurements. The surface area (SBET) was calculated using the BET (Brunauer–Emmett–Teller) method from N2 adsorption isotherms within the relative pressure ranging from 0.05 to 0.25. Total pore volume (VT) was obtained at P/P0 = 0.995. Micropore volume (Vmicro) was calculated by t-plot method. Mesopore volume (Vmeso) was determined by subtracting the micropore volume from the total pore volume. The pore size distribution was obtained from the adsorption isotherms using the nonlocal density functional theory (NLDFT), assuming a cyclindrical pore shape. The micropore size distribution was determined by CO2 adsorption at 0 °C and calculated by the Horvath–Kawazoe (HK) method applying the Saito–Foley modification. Finally, the CO2 adsorption isotherms of the prepared carbons were measured at 25, 50 or 70 °C, respectively, using the ASAP 2020 system.
Synthesis of N-doped microporous carbons
Zeolite NaY powder was placed in a flask and kept at 150 °C under dynamic vacuum for 10 h to activate the zeolite. Excess amount of furfuryl alcohol was mixed with zeolite powder under reduced pressure at room temperature for 2 h. Subsequently, zeolite NaY was filtered and rinsed by toluene to remove FA on the external surface of zeolite powder. The polymerization of FA was carried out by heating the powder at 80 °C for 24 h and then at 150 °C for 8 h under N2 atmosphere. The resulting poly(furfuryl alcohol)(PFA)/zeolite composites were placed in a quartz reactor and heated at a heating rate of 5 °C min−1 up to a predetermined temperature under N2 flow, and then a CVD process was performed for 4 h at the same temperature with acetonitrile vapor generated by bubbling nitrogen (80 mL min−1) through acetonitrile liquid at 15 °C. Finally, the resulting composite was etched by 20 wt% aqueous HF solution, and subsequently refluxed in concentrated HCl solution at 60 °C to liberate the carbons. For convenience, the carbon materials are denoted as YTCX, where the X stands for one hundredth of CVD temperature. For example, the abbreviation of YTC8 means the carbon was prepared by CVD method under 800 °C for 4 h. In order to investigate the effect of CVD duration on the texture of the carbon, a sample denoted as YTC8-2 was prepared with a short CVD duration of 2 h at 800 °C. For comparison, a carbon was prepared at 900 °C using acetylene as CVD substrate, which was denoted as YTCA.Results and discussion
Characterization of pore texture and surface chemical properties
Fig. 1 shows the XRD patterns for the original zeolite NaY and the prepared carbons. The typical structure of zeolite NaY was characterized by many sharp peaks at 2θ = 6.21 (111), 15.68 (331), 23.68° (533) and so on. As shown in Fig. 1, an XRD peak around 6° was observed for the carbons prepared at higher temperature (≥700 °C), similar to that present in zeolite Y, while there were no visible peaks around 6° for the XRD patterns of the carbons prepared at 500 or 600 °C. This peak originates from the ordering of (111) planes of zeolite Y, and the sharpness and intensity of this peak could be used as a measure of the structure regularity of the resulting carbons.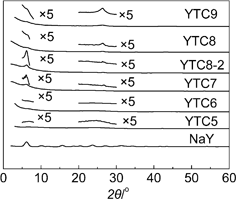 | ||
| Fig. 1 XRD patterns of zeolite NaY and the prepared carbons. | ||
At lower temperature (500 or 600 °C), the extent of carbonization is lower than the carbons prepared at higher temperature (≥700 °C). The poor regularity in YTC5 and YTC6 would arise from the fragile linkages between carbon clusters inside the zeolite channels, which may be easily broken during the acid washing process. At higher temperature, the extent of carbonization inside the pore channels became higher, resulting in rigid pore structure of carbon. Consequently, the ordering of the carbon became better than that of carbons prepared at lower temperature. The peak intensity around 6° of the prepared carbons decreases as the carbonization temperature increases from 700 to 900 °C, indicating the pore regularity deteriorates with the rise of carbonization temperature. It is thought that carbon may deposit more easily on the external surface of zeolite particles at higher temperatures (800 or 900 °C) and then some graphitic layer stacking on the external surface was produced, which was reflected by the peaks around 26° in the XRD patterns. This type of deposition would block the pore entrance of zeolite and result in the decrease of the structural regularity. Those facts mentioned above imply that the carbonization temperature dramatically influences the pore structure regularity of the prepared carbons, and the YTC7 and YTC8-2 carbons replicate well the pore structural regularity of the zeolite NaY, which is demonstrated by the high intensity of the peak around 6° in the XRD patterns.
Interestingly, a broad peak of 26° was observed from the XRD pattern of YTC5 which was prepared at a low temperature of 500 °C. Only a few acetonitrile molecules could deposit on the pore surface of zeolite at 500 °C, and some graphite-like mesophase material between graphite and polyarene maybe produced in the channels of zeolite due to the low extent of carbonization. This mesophase material could be further proved by the fact that some yellow oil was found in the degas process (350 °C, < 1 Pa) before the N2 adsorption measurement. Therefore, the broad peak around 26° is a reflection of this graphite-like mesophase material.
Additionally, the YTC8 gives a very weak peak around 6°, but an evident peak around 26°, while the YTC8-2 presents an evident peak around 6°, but a weak peak around 26°, demonstrating that short CVD time at high temperature is good for getting carbons with high structural ordering.
To further investigate the effect of carbonization temperature on carbons deposition, SEM observation was employed to image the external morphology of the prepared carbons. As shown in Fig. 2, the zeolite NaY exhibits a typical crystal-like morphology, and the primary particle size was about 1 μm. It could be seen that the carbons of YTC6, YTC7 and YTC8-2 present a smooth surface and no apparent difference in morphology with the zeolite template, indicating that the carbon almost deposited into the channels of zeolite NaY during the CVD, and well replicate the pore structure of zeolite template. Comparatively, the YTC8 carbon presents much rougher surface and lots of thin layers on the particle surface, indicating a greater portion of carbon deposited on the external surface of zeolite particles due to the accelerated carbonization process at high temperature. The YTC5 carbon presents lots of small-sized thin chips which may be caused by the collapse of the unstable mesophase carbon materials inside the zeolite channels during the acid washing process.
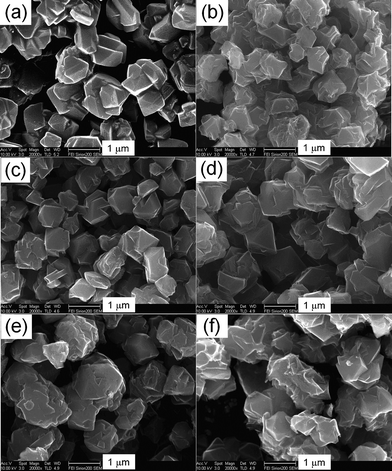 | ||
| Fig. 2 SEM images of zeolite NaY and the prepared carbons (a) NaY, (b) YTC5, (c) YTC6, (d) YTC7, (e) YTC8-2, (f) YTC8. | ||
The N2 sorption isotherm, PSD and data of pore structure are presented in Fig. 3 and Table 1, respectively. As shown in Fig. 3a, all the carbons present largely similar adsorption isotherms between type I and IV, indicating that not only micropores, but also small-sized mesopores were developed in these carbons. It is clear to see that the prepared carbons have a similar PSD determined from the isotherms with similar shapes. The PSD was determined via a NLDFT model using nitrogen adsorption data. The most pronounced peaks are at around 1.7, 2.0 and 2.5 nm. The small-sized pores (< 1.7 nm) are likely to be directly produced by the full filling of the zeolite channels, while the mesopores may arise from incomplete filling of the zeolite channels during the preparation process. CO2 adsorption at 273 K gave a more representative pore size of 0.5–0.9 nm (ESI,† Fig. S3) according to the DFT model. The formation of those ultra micropores (0.5–0.9 nm) is reasonably templated from the zeolite wall framework (which becomes the pore in the carbons). The surface area and pore volume of the prepared carbons is summarized in Table 1. It could be seen that the pore structure of the prepared carbons strongly depend on the carbonization temperature. As shown in Table 1, the carbons prepared above 700 °C possess very large surface area, larger than 1500 m2 g−1, while the carbons prepared at lower temperatures have a much lower surface area, especially for YTC5. Maximum surface area was obtained for the sample of YTC8-2 (2001 m2 g−1), which may be because most of the acetonitrile could efficiently diffuse into and decompose in the channels of zeolite Y during the CVD process.
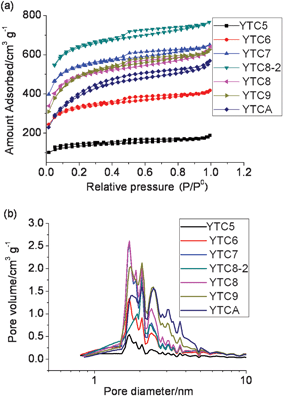 | ||
| Fig. 3 (a) N2 sorption isotherms and (b) pore size distribution of the prepared carbons. | ||
| Sample | SBET (m2 g−1) | Vt (cm3 g−1) | Vmeso (cm3 g−1) | Vmicro (cm3 g−1) |
|---|---|---|---|---|
| NaY | 679 | 0.36 | 0 | 0.36 |
| YTC5 | 427 | 0.28 | 0.11 | 0.16 |
| YTC6 | 1041 | 0.63 | 0.23 | 0.40 |
| YTC7 | 1685 | 1.01 | 0.31 | 0.70 |
| YTC8-2 | 2001 | 0.98 | 0.30 | 0.68 |
| YTC8 | 1544 | 0.99 | 0.38 | 0.61 |
| YTC9 | 1583 | 0.95 | 0.39 | 0.56 |
| YTCA | 1342 | 0.86 | 0.51 | 0.35 |
The chemical composition of the prepared carbons was determined by XPS measurement. As revealed in Table 2, N atoms were introduced into the prepared carbons through the pyrolysis of acetonitrile. The content of C atoms increased and the content of O atom decreased with the increasing of carbonization temperature, which is due to the increase of carbonization extent. The high oxygen content of YTC5, up to 8.1 at%, further proves that this carbon possesses much lower carbonization extent.
| Sample | Element composition (At%) | ||
|---|---|---|---|
| C | N | O | |
| YTC5 | 89.6 | 2.3 | 8.1 |
| YTC6 | 92 | 2.6 | 5.4 |
| YTC7 | 93.6 | 4.0 | 2.4 |
| YTC8-2 | 94.7 | 3.2 | 2.1 |
| YTC8 | 94.3 | 4.4 | 1.3 |
| YTC9 | 96.6 | 2.3 | 1.1 |
| YTCA | 98.7 | 0 | 1.3 |
Information on the nature of the binding between carbon and nitrogen atoms of the carbons were obtained from N1s spectra shown in Fig. 4. It is well known that the type of nitrogen groups include amide, pyridinic (N-6), pyrrolic (N-5), quaternary nitrogen (N-Q) and pyridine-N-oxide (N-X). As shown in Fig. 4, the type of nitrogen groups, reflected by the peaks of N1s spectra, depends on the treatment temperature of acetonitrile. For the YTC5 carbon, a complicated N1s spectrum was obtained which was split into the following six peaks: 397.5 eV (pyridinic N), 398.9 eV (–C![[double bond, length as m-dash]](https://www.rsc.org/images/entities/char_e001.gif) NH), 400 eV (amide or pyrrolic N), 402 eV (NH4+), 403.4 eV (pyridine-N-oxide) and 405.7 eV (–NO2). Comparatively, a significant decrease of the basic nitrogen species (including pyridinic N, amide, pyrrolic N, and –C
NH), 400 eV (amide or pyrrolic N), 402 eV (NH4+), 403.4 eV (pyridine-N-oxide) and 405.7 eV (–NO2). Comparatively, a significant decrease of the basic nitrogen species (including pyridinic N, amide, pyrrolic N, and –C![[double bond, length as m-dash]](https://www.rsc.org/images/entities/char_e001.gif) NH) is observed at temperatures above 600 °C. Additionally, quaternary nitrogen groups (responding to the peak around 401 eV) were observed for the YTC6 and YTC8 carbons, and this group is the major nitrogen species for the YTC8 carbon.4,40 The nitrogen groups on the carbons prepared at 500 and 600 °C are mainly amides/pyrrolic and pyridinic groups, which might serve as anchors for CO2 capture due to their basic property. These surface groups would decompose at higher temperature (>600 °C), and some nitrogen groups are converted into aromatic nitrogen species built into the carbon matrix (mainly quaternary N with typical Lewis acidity in this study). The loss of basic functionalities might result in the decrease of chemical adsorption of CO2.
NH) is observed at temperatures above 600 °C. Additionally, quaternary nitrogen groups (responding to the peak around 401 eV) were observed for the YTC6 and YTC8 carbons, and this group is the major nitrogen species for the YTC8 carbon.4,40 The nitrogen groups on the carbons prepared at 500 and 600 °C are mainly amides/pyrrolic and pyridinic groups, which might serve as anchors for CO2 capture due to their basic property. These surface groups would decompose at higher temperature (>600 °C), and some nitrogen groups are converted into aromatic nitrogen species built into the carbon matrix (mainly quaternary N with typical Lewis acidity in this study). The loss of basic functionalities might result in the decrease of chemical adsorption of CO2.
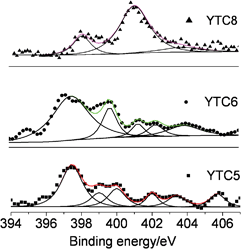 | ||
| Fig. 4 N1s spectra of the prepared carbons. | ||
CO2 adsorption performance of the prepared carbons
The CO2 adsorption isotherms of the templated carbons are presented in Fig. 5. The adsorption isotherms were analyzed by three different models, that is, Langmuir, Dubinin–Radushkevich (D–R) and Dubinin–Astakhov (D–A) models (ESI,† Fig. 4–6). The D–A model has been applied to the adsorption equilibria of several vapors and gases onto microporous activated carbons.41,42 The D–A equation is written as | (1) |
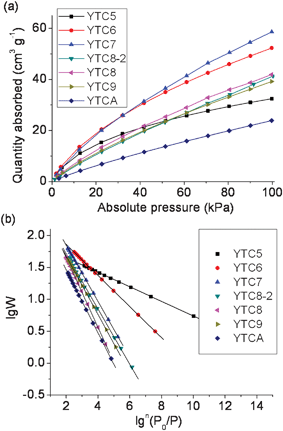 | ||
| Fig. 5 (a) CO2 adsorption isotherms of the prepared carbons and (b) the correlation of adsorption data with the Dubinin–Astakhov equation (solid lines are from the Dubinin–Astakhov model). | ||
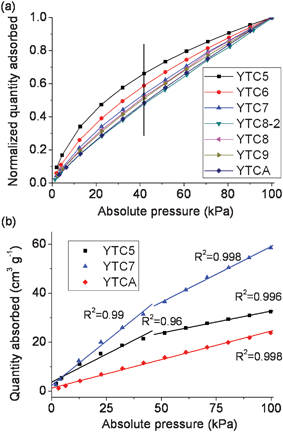 | ||
| Fig. 6 (a) Normalized CO2 quantity adsorbed and (b) the correlation between absolute pressure and quantity adsorbed for the prepared carbons. | ||
The adsorption potential A is given by
 | (2) |
Then the D–A equation could be expressed as
 | (3) |
 | (4) |
As shown in eqn (4), a plot of lgW versus lgn(P0/P) should give a straight line with a slope of −[2.303n−1(RT/E)n] and an intercept of lgW0 if the adsorption isotherms fit well with the D–A model. As shown in Fig. 5b, the adsorption data can be well simulated by the D–A model. The analysis of adsorption data using Langmuir and D–R models is presented in the ESI.†
It is well known that the CO2 adsorption capacity is a combination of physical and chemical adsorption, which is dependent on the micropore volume and the amount of basic nitrogen functionalities on the carbon surface, respectively. As shown in Fig. 5, the greatest adsorption capacity (59 cm3 g−1, corresponding to 0.104 g g−1) was obtained for the YTC7 carbon due to its higher surface area and abundant basic nitrogen functionalities. The carbons of YTC5 and YTC6 exhibit much higher adsorption capacity (32.4 and 52.3 cm3 g−1, corresponding to 0.057 and 0.099 g g−1, respectively) than the YTCA carbon which exhibits the smallest adsorption capacity (23.9 cm3 g−1, corresponding to 0.042 g g−1) among all the prepared carbons, although those two carbons have a much lower surface area than the YTCA carbon. This fact demonstrates that the presence of basic nitrogen functionalities contribute significantly to the enhancement of CO2 adsorption at room temperature.
The correlation between normalized CO2 adsorption capacity and absolute pressure is present in Fig. 6. As it can be clearly seen, the increasing rate of adsorption capacity differs for the prepared carbons with the increase of absolute pressure, and the curves are nonlinear for all the prepared carbons except YTCA. The CO2 adsorption capacity is always a combination of physical and chemical adsorption. Comparatively, the chemical adsorption possesses lower activation energy than the physical adsorption, facilitating CO2 adsorption at low relative pressure via much stronger interaction between the basic N-containing functional groups and CO2 molecules. In other words, the chemical adsorption occurs easily and reaches saturated state at low relative pressure (or at the initial pressure of adsorption) due to the strong interaction between the basic N-containing functional groups and CO2 molecules, while the physical adsorption derived from the van der Waals force between pore surface and CO2 molecules may play a more active role for the increase of adsorption capacity at high pressure. Therefore, the carbon materials which exhibit strong chemical adsorption present adsorption isotherms significantly depart from the linear, and have a fast increasing rate of adsorption capacity at an initial pressure.1,2,10,15 If a carbon with ordered pore structure showed purely physical adsorption, a linear relationship between adsorption capacity and relative pressure would be expected. As shown in Fig. 6b, the isotherm of YTCA is almost linear with a very high R2 coefficient of 0.998 because this carbon has no basic functionalities and shows pure physical adsorption. The isotherm of the YTC5 carbon is nonlinear with a much lower R2 coefficient of 0.96 within a low pressure range (0–40 kPa), and is nearly linear with an R2 coefficient of 0.996 within a high pressure range (40–100 kPa). The same situation could be observed for the isotherm of YTC7. These facts indicate that those carbons possess higher chemical adsorption capacity. It also can be seen that both the increasing rate of adsorption capacity (Fig. 6a) and the R2 coefficient (Fig. 6b) within the low pressure range decrease with the increase of carbonization temperature, indicating that the percentage of chemical adsorption in the total adsorption capacity decreases as the carbonization temperature increases, which may be ascribed to the loss of basic nitrogen functionalities under high carbonization temperatures.
The CO2 gravimetric adsorption capacity and CO2 adsorption capacity per surface area of the prepared carbons are shown in Fig. 7. The greatest CO2 capacity is obtained for the YTC7 carbon, reaching 0.104 g g−1 (10.4 wt%), much higher than the commercial activated carbon (3.86 wt%),18 KOH-activated graphite nanofibers (5.92 wt%),14 N-doped carbons derived from urea-formaldehyde resins (8.19 wt%),18 and ammonia-treated activated carbons (7.5–9.6 wt%).4,19–21 Most recently, Xia and his co-workers reported that the N-doped carbons templated from zeolite EMC-2 exhibit a very high CO2 capacity of 0.194 g g−1 at ambient temperature and pressure.43 This value of CO2 capacity is much higher than our experimental data, which may be because the EMC-2 templated carbons possess much higher surface area (> 2800 m2 g−1) and nitrogen content (3.7–7.6 wt%) as reported in the literature. As shown in Fig. 7, the mass of CO2 adsorbed per unit surface area decreases with the increase of carbonization temperature, and the YTC5 carbon presents the highest CO2 adsorption capacity per surface area, reaching 135 μg m−2. The YTC5 and YTC6 carbons have a higher adsorption capacity per surface area than the YTC7 and YTC8 carbons, although the latter carbons possess much more nitrogen functionality than the former ones. This fact indicates that the CO2 adsorption capacity depends not only on the amount of total nitrogen groups but also on the type of nitrogen groups introduced. The basic nitrogen groups, mainly including pyridinic N, –C![[double bond, length as m-dash]](https://www.rsc.org/images/entities/char_e001.gif) NH, amide and pyrrolic N, could be strong anchors for the acidic CO2 molecules. According to the results of the N1s measurement, basic amide groups decomposed at high carbonization temperature, and some nitrogen groups were converted into quaternary groups with Lewis acidity and built into the carbon matrix. The loss of basic nitrogen groups results in the decrease of the CO2 adsorption capacity per surface area. Additionally, it is necessary to ascertain that the YTC5 and YTC6 carbons have much higher CO2 capacity per surface area than the EMC-2 templated carbons with a maximum capacity of 59 μg m−2 calculated from the data in the Xia’s literature, although the latter carbons exhibit much higher gravimetric adsorption capacity than our carbons. That may be due to some basic nitrogen functional groups decomposing with further heat treatment during the preparation of the EMC-2 templated carbons.43
NH, amide and pyrrolic N, could be strong anchors for the acidic CO2 molecules. According to the results of the N1s measurement, basic amide groups decomposed at high carbonization temperature, and some nitrogen groups were converted into quaternary groups with Lewis acidity and built into the carbon matrix. The loss of basic nitrogen groups results in the decrease of the CO2 adsorption capacity per surface area. Additionally, it is necessary to ascertain that the YTC5 and YTC6 carbons have much higher CO2 capacity per surface area than the EMC-2 templated carbons with a maximum capacity of 59 μg m−2 calculated from the data in the Xia’s literature, although the latter carbons exhibit much higher gravimetric adsorption capacity than our carbons. That may be due to some basic nitrogen functional groups decomposing with further heat treatment during the preparation of the EMC-2 templated carbons.43
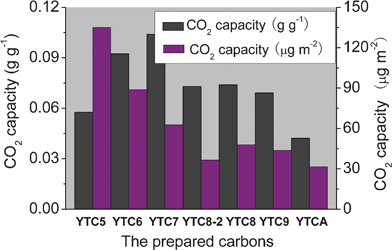 | ||
| Fig. 7 CO2 gravimetric adsorption capacity and CO2 adsorption capacity per surface area of the prepared carbons. | ||
To determine the strength of the interaction between CO2 and the prepared carbons, the isosteric heat of adsorption, Qst, for the prepared carbons was calculated based on the Clausius–Clapeyron equation using the CO2 adsorption isotherms measured at 25 and 50 °C. The plot of QstversusCO2 capacity is presented in Fig. 8. It could be found that the N-doped carbons present much higher isosteric heat of adsorption than the N-free YTCA carbon, indicating that the presence of nitrogen groups plays a positive role in the interaction between CO2 and carbon materials. It is necessary to mention that the YTC5 carbon presents a very high initial Qst (up to 40 kJ mol−1) at low CO2 capacity. This value is also much higher than the previously reported values.43 The high Qst value indicates that the YTC5 carbon strongly interacts with CO2 molecules. It could be further seen that the Qst of the prepared carbons drops with the increase of carbonization temperature, which may be due to the decrease of interaction between CO2 and carbon materials resulting from the loss of unstable basic nitrogen groups at high temperatures.
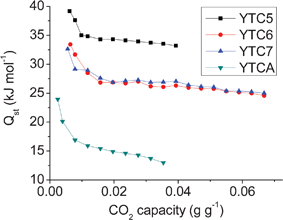 | ||
| Fig. 8 The isosteric heats of adsorption for the prepared carbons. | ||
To investigate the CO2 adsorption performance of the carbons at elevated temperatures, we measured the adsorption capacities of three carbons at 25, 50 and 70 °C. As shown in Fig. 9, the CO2 adsorption capacities of the investigated carbons significantly decrease with the increase of adsorption temperature, especially for the YTC7. The YTC6 carbon presents the highest adsorption capacity at 70 °C, reaching 0.041 g g−1. The decrease of CO2 adsorption capacity at high temperature is a common phenomenon for nanoporous carbons due to the exothermic character of physical adsorption where the molecular kinetic energy of CO2 molecules increases with increasing adsorption temperature. With the increase of carbonization temperature, the retention ratio of adsorption capacity decreases, further demonstrating that the chemical adsorption plays a more active role for the carbons prepared at low temperature as discussed above.
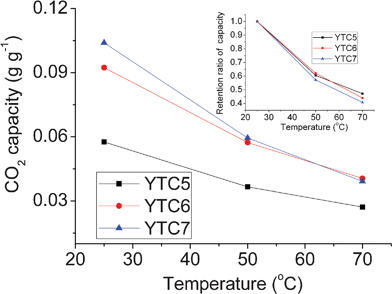 | ||
| Fig. 9 CO2 adsorption capacities at different temperature. | ||
Conclusions
N-Doped ordered microporous carbons were prepared using zeolite NaY as a hard template by a two-step casting method, and the CO2 adsorption performance of those carbons were systematically investigated. The temperature chosen for the CVD step is very important for the replication of zeolite regularity, pore texture and the type of nitrogen functionalities of the resulted carbon. The basic nitrogen functionalities would decompose at high carbonization temperature, and were partly conversed into aromatic nitrogen species, resulting in the loss of chemical adsorption for the carbons prepared at high temperature. The CO2 adsorption isotherms can be well simulated by the Dubinin–Astakhov model. The prepared carbons exhibit very high CO2 adsorption energy (Qst) of up to 40 kJ mol−1. High CO2 adsorption capacities of up to 9.3 wt% at 25 °C and 4.1 wt% at 70 °C were obtained for the YTC6 carbon. Those values of adsorption capacities are much higher than the activated carbon, N-doped carbons derived from urea-formaldehyde resins, and ammonia-treated activated carbons. This study also proves that the low temperature CVD using acetonitrile as substrate is a promising method for introducing basic nitrogen functionalities to carbon materials for CO2 capture, which avoids the use of toxic ammonia. This type of carbons also could be used as electrode materials for supercapacitors or as adsorbents for H2 adsorption, and those applications will be investigated next.Acknowledgements
This work was financially supported by Natural Science Foundation of China (51107076), Natural Science Foundation of Shandong Province (Y2008F36), Outstanding Young Scientist Foundation of Shandong Province (2008BS09007, BS2009NJ014), Key Sci-Tech Development Project of Shandong Province (2009GG10007006), Key Sci-Tech Research Project of Education Department of China (210125), and Young Teacher Supporting scheme of Shandong University of Technology.References
- G.-P. Hao, W.-C. Li, D. Qian and A.-H. Lu, Adv. Mater., 2010, 22, 853 CrossRef CAS.
- M. G. Plaza, C. Pevida, B. Arias, J. Fermoso, M. D. Casal, C. F. Martín, F. Rubiera and J. J. Pis, Fuel, 2009, 88, 2442 CrossRef CAS.
- M. Olivares-Marín and M. M. Maroto-Valer, Fuel Process. Technol., 2011, 92, 322 CrossRef.
- C. Pevida, M. G. Plaza, B. Arias, J. Fermoso, F. Rubiera and J.J. Pis, Appl. Surf. Sci., 2008, 254, 7165 CrossRef CAS.
- D. Saha, Z. Bao, F. Jia and S. Deng, Environ. Sci. Technol., 2010, 44, 1820 CrossRef CAS.
- F. Su, C. Lu, S.-C. Kuo and W. Zeng, Energy Fuels, 2010, 24, 1441 CrossRef CAS.
- S. Araki, H. Doi, Y. Sano, S. Yanaka and Y. Miyake, J. Colloid Interface Sci., 2009, 339, 382 CrossRef CAS.
- L.-Y. Lin and H. Bai, Microporous Mesoporous Mater., 2010, 136, 25 CrossRef CAS.
- M. Bhagiyalashmi, P. Hemalatha, M. Ganesh, P. M. Mei and H.T. Jang, Fuel, 2011, 90, 1662 CrossRef.
- B.-J. Kim, K.-S. Cho and S.-J. Park, J. Colloid Interface Sci., 2010, 342, 575 CrossRef CAS.
- S.-C. Hsu, C. Lu, F. Su, W. Zeng and W. Chen, Chem. Eng. Sci., 2010, 65, 1354 CrossRef CAS.
- Y. X. Wang, B. S. Liu and C. Zhang, J. Chem. Eng. Data, 2010, 55, 4669 CrossRef CAS.
- Z. Zhang, M. Xu, H. Wang and Z. Li, Chem. Eng. J., 2010, 160, 571 CrossRef CAS.
- L.-Y. Meng and S.-J. Park, J. Colloid Interface Sci., 2010, 352, 498 CrossRef CAS.
- C. Knöfel, C. Martin, V. Hornebecq and P.L. Llewellyn, J. Phys. Chem. C, 2009, 113, 21726 Search PubMed.
- M. L. Gray, Y. Soong, K. J. Champagne, J. Baltrus, R. W. Stevens, P. Toochinda and S. S. C. Chuang, Sep. Purif. Technol., 2004, 35, 31 CrossRef CAS.
- C. Pevida, T. C. Drage and C.E. Snape, Carbon, 2008, 46, 1464 CrossRef CAS.
- T. C. Drage, A. Arenillas, K. M. Smith, C. Pevida, S. Piippo and C. E. Snape, Fuel, 2007, 86, 22 CrossRef CAS.
- J. Przepiórski, M. Skrodzewicz and A. W. Morawski, Appl. Surf. Sci., 2004, 225, 235 CrossRef.
- M. S. Shafeeyan, W. M. A. W. Daud, A. Houshmand and A. Arami-Niya, Appl. Surf. Sci., 2011, 257, 3936 CrossRef CAS.
- M. G. Plaza, F. Rubiera, J. J. Pis and C. Pevida, Appl. Surf. Sci., 2010, 256, 6843 CrossRef CAS.
- T. Kyotani, T. Nagai, S. Inoue and A. Tomita, Chem. Mater., 1997, 9, 609 CrossRef CAS.
- P-X. Hou, T. Yamazaki, H. Orikasa and T. Kyotani, Carbon, 2005, 43, 2624 CrossRef CAS.
- F. Su, X. S. Zhao, L. Lv and Z. Zhou, Carbon, 2004, 42, 2821 CrossRef CAS.
- S. A. Johnson, E. S. Brigham, P. J. Ollivier and T. E. Mallouk, Chem. Mater., 1997, 9, 2448 CrossRef CAS.
- Z. X. Ma, T. Kyotani and A. Tomita, Carbon, 2002, 40, 2367 CrossRef CAS.
- K. Matsuoka, Y. Yamagishi, T. Yamazaki, N. Setoyama, A. Tomita and T. Kyotani, Carbon, 2005, 43, 876 CrossRef CAS.
- Z. X. Yang, Y. D. Xia and R. Mokaya, Microporous Mesoporous Mater., 2005, 86, 69 CrossRef CAS.
- C. O. Ania, V. Khomenko, E. Raymundo-Piñero, J. B. Parra and F. Bguin, Adv. Funct. Mater., 2007, 17, 1828 CrossRef CAS.
- C. Portet, Z. Yang, Y. Korenblit, Y. Gogotsi, R. Mokaya and G. Yushin, J. Electrochem. Soc., 2009, 156, A1 CrossRef CAS.
- H. Nishihara, H. Itoi, T. Kogure, P. Hou, H. Touhara, F. Okino and T. Kyotani, Chem.–Eur. J., 2009, 15, 5355 CrossRef CAS.
- H. Itoi, H. Nishihara, T. Kogure and T. Kyotani, J. Am. Chem. Soc., 2011, 133, 1165 CrossRef CAS.
- H. L. Wang, Q. M. Gao, J. Hu and Z. Chen, Carbon, 2009, 47, 2259 CrossRef CAS.
- H.L. Wang, Q. Gao and J. Hu, Microporous Mesoporous Mater., 2010, 131, 89 CrossRef CAS.
- A. Kajdos, A. Kvit, F. Jones, J. Jagiello and G. Yushin, J. Am. Chem. Soc., 2010, 132, 3252 CrossRef CAS.
- Y. Xia, R. Mokaya, D. M. Grant and G. S. Walker, Carbon, 2011, 49, 844 CrossRef CAS.
- C. Guan, K. Wang, C. Yang and X. S. Zhao, Microporous Mesoporous Mater., 2009, 118, 503 CrossRef CAS.
- C. Ducrot-Boisgontier, J. Parmentier, A. Faour, J. Patarin and G. D. Pirngruber, Energy Fuels, 2010, 24, 3595 CrossRef CAS.
- H.-K. Youn, J. Kim, G. Chandrasekar, H. Jin and W.-S. Ahn, Mater. Lett., 2011, 65, 1772 CrossRef CAS.
- R. J. J. Jansen and H. Bekkum, Carbon, 1995, 33, 1021 CrossRef CAS.
- B. B. Saha, S. Jribi, S. Koyama and I. I. El-Sharkawy, J. Chem. Eng. Data, 2011, 56, 1974 CrossRef CAS.
- S. Himeno, T. Komatsu and S. Fujita, J. Chem. Eng. Data, 2005, 50, 369 CrossRef CAS.
- Y. Xia, R. Mokaya, G. S. Walker and Y. Zhu, Adv. Energy Mater., 2011, 1, 678 CrossRef CAS.
Footnote |
| † Electronic Supplementary Information (ESI) available. See DOI: 10.1039/c1ra00247c |
| This journal is © The Royal Society of Chemistry 2012 |
