 Open Access Article
Creative Commons Attribution 3.0 Unported Licence
Well-defined polymeric vesicles with high stability and modulation of cell uptake by a simple coating protocol†
Gökçen
Yaşayan
,
Martin
Redhead
,
Johannes P.
Magnusson
,
Sebastian G.
Spain
,
Stephanie
Allen
,
Martyn
Davies
,
Cameron
Alexander
* and
Francisco
Fernández-Trillo
*
School of Pharmacy, The University of Nottingham, University Park, Nottingham NG7 2RD, UK. E-mail: cameron.alexander@nottingham.ac.uk; francisco.fernandez-trillo@nottingham.ac.uk
First published on 22nd June 2012
Abstract
Amphiphilic polymers have been synthesised by controlled free radical polymerisation techniques. These polymers self-assemble into well-defined vesicles in aqueous conditions, enabling encapsulation of a model hydrophilic molecule. The polymeric vesicles show high stability against a range of aqueous conditions with marginal release of cargo, even in the presence of known cell-membrane disruptive polymers such as branched poly(ethylene imine) (b-PEI). This stability allows for inversion of the surface charge of the polymeric vesicles by a simple coating protocol leading to an enhanced uptake by mammalian cells.
Introduction
Vesicles and membranes are vital components in nature, with critical roles at the cellular level such as compartmentalisation, storage, nutrient transport or information protection. It is not surprising then that the construction of vesicles with tailored properties is of interest in fields such as drug delivery,1–3 nano-science,4,5 and synthetic biology.6,7 Biological systems have relied on phospholipids to produce vesicles and have been able to create extremely complex cellular membranes. Unfortunately, phospholipidic membranes are inherently unstable. In nature this drawback is overcome by blending with other amphiphiles such as cholesterol. In addition, natural vesicles incorporate specialised membrane proteins to ensure that the right osmotic balance is maintained to prevent vesicle rupture. While this approach generates highly functional vesicles, it is extremely difficult and costly to reproduce in the laboratory. In recent years, synthetic chemistry has expanded the number of amphiphiles that can form vesicular aggregates, with some examples showing improved stabilities when compared to phospholipidic vesicles or liposomes.8–11 Among these amphiphiles, polymers offer great potential in the preparation of vesicles, as the correct choice of polymerisation techniques, allows for a wide range of physical, chemical and mechanical properties. In addition, factors such as polymer architecture and molecular weight (MW) can be controlled in order to enhance overall properties.12–18In this paper, we describe the synthesis of well defined polymeric vesicles from novel amphiphiles based on acrylamide polymers (Scheme 1). In addition, the stability of these polymersomes against different conditions, such as increased pH and buffer strength is evaluated and compared to model conventional liposomes. Biocompatibility and cellular uptake for these materials is also investigated.
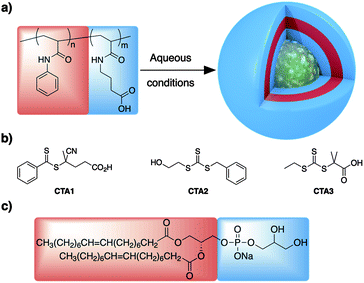 | ||
| Scheme 1 (a) Schematic representation of the polymers prepared in this work and their assembly into vesicles. (b) RAFT agent used in this work. (c) Model lipid used for vesicle stability comparison. | ||
Materials and methods
Phenylacrylamide (PAm) and N-ω-acrylamidobutanoic acid (4AmBA) were prepared according to a modified literature procedure (ESI†).19 4-Cyano-4-((thiobenzoyl)sulfanyl)pentanoic acid (CTA1), benzyl 2-hydroxyethyl carbonotrithioate (CTA2) and 2-(ethylthiocarbonothioylthio)-2-methylpropanoic acid (CTA3) were prepared according to literature procedures.20,21 4,4′-azobis(4-cyanopentanoic acid) (V-501) was purchased from Fluka® and recrystallised from MeOH. Branched polyethyleneimine (b-PEI) (average Mw: ∼25![[thin space (1/6-em)]](https://www.rsc.org/images/entities/char_2009.gif) 000 (LS)) was purchased from Aldrich®. All other chemicals were purchased from Sigma-Aldrich® and used without further purification. Dulbecco's Phosphate Buffered Saline (DPBS) was purchased from Lonza Group Ltd. All other solvents were HPLC grade, purchased from Sigma-Aldrich® or Fisher Scientific®, and used without further purification. Mica discs and specimen discs were purchased from Agar Scientific Ltd. ScanAsyst-Fluid+ AFM probes (resonant mechanical frequency: 120–180 kHz, spring constant: 0.7 N m−1) were purchased from Bruker®. Syringe filters (0.2 μm and 0.45 μm) were purchased from Millipore™. Disposable capillary cells for zeta potential measurements were purchased from Malvern Instruments. Copper grids coated with a formvar carbon film were purchased from TAAB Laboratories Equipment Ltd.
000 (LS)) was purchased from Aldrich®. All other chemicals were purchased from Sigma-Aldrich® and used without further purification. Dulbecco's Phosphate Buffered Saline (DPBS) was purchased from Lonza Group Ltd. All other solvents were HPLC grade, purchased from Sigma-Aldrich® or Fisher Scientific®, and used without further purification. Mica discs and specimen discs were purchased from Agar Scientific Ltd. ScanAsyst-Fluid+ AFM probes (resonant mechanical frequency: 120–180 kHz, spring constant: 0.7 N m−1) were purchased from Bruker®. Syringe filters (0.2 μm and 0.45 μm) were purchased from Millipore™. Disposable capillary cells for zeta potential measurements were purchased from Malvern Instruments. Copper grids coated with a formvar carbon film were purchased from TAAB Laboratories Equipment Ltd.
Nuclear Magnetic Resonance (NMR) spectra were recorded on a Bruker 400 MHz spectrometer. Chemical shifts are reported in ppm (δ units) downfield from internal tetramethylsilane. Mass spectra (MS) (TOF-ESI) were recorded on a Waters 2795 separation module/micromass LCT platform, under negative scan mode with direct injection of the purified compounds. Gel Permeation Chromatography (GPC) was carried out using Polymer Laboratories GPC 50 with RI detector. DPBS or DMF/0.1% w/v LiBr were used as the mobile phase. Molecular weights were calculated based on a standard calibration method using poly(ethylene glycol) (DPBS) or poly(methyl methacrylate) (DMF/LiBr) narrow standards. Fluorescence spectra were recorded on a Cary Eclipse fluorescence spectrometer (Agilent Technologies). Dynamic Light Scattering (DLS) was measured using a Viscotec Model 802 instrument equipped with an internal laser (825–832 nm) with a maximum radiation power of 60 mW. Atomic Force Microscopy (AFM) topography images and particle analysis of block copolymer vesicles were obtained in liquid at room temperature using a Multimode 8 Scanning Probe Microscopy station, operating in PeakForce Tapping™ mode under ScanAsyst auto control. Images were acquired using an E-scanner, at scan rates between 1 and 3 Hz, with a resolution of 512 × 512 pixels. Transmission Electron Microscopy (TEM) was performed on a FEI TecnaiTM 12 Biotwin transmission electron microscope. Zeta potential was measured using a Zetasizer Nano ZS (Malvern Instruments Ltd) at 25 °C.
NIH 3T3 Fibroblasts were cultured between passages 15–20, A549 cells were cultured from passage 6. Media for the two cell lines was MEM, supplemented with 10% FBS, 2 mM L-glutamine, 1000 au mL−1 penicillin and 10 μg mL−1 streptomycin. Cells were cultured at 37 °C and 5% CO2 in a humidified atmosphere. Images were obtained using a Leica DM IRB microscope with a QICAM FAST1394 camera (QImaging, Surrey Canada). Image analysis was performed using Origin 8 pro (Origin Labs, UK). Acute cytotoxicity was assessed using CytotoxONE™ assay kit (Promega Corporation, UK), chronic toxicity was measured using 1 mg mL−1 MTT reagent. Absorbance and fluorescence measurements were obtained using a TECAN colorimetric/fluorimetric plate reader (TECAN, Männedorf, Switzerland).
General protocol for reversible addition–fragmentation chain transfer (RAFT) polymerisation
Polymerisations were conducted in round bottom flasks sealed with a rubber septum and parafilm. An NMR spectrum was recorded at the beginning of the experiment. The polymerisation solutions were degassed using argon for at least 10 min and transferred to an oil bath preheated to 70 °C. To stop the polymerisation, the solution was quenched by cooling in ice-water and opening to air, and another NMR spectrum was recorded to enable calculation of degree of conversion. For the removal of the RAFT agent in the final block copolymers, the reaction was carried out at 80 °C.Polymer conversion and composition calculations
The overall monomer conversion was calculated by 1H NMR spectra by comparing the vinyl proton signals from the monomers (5.6 and 6.1 ppm) to the overall integration from the amide hydrogens (7.5–8.2 ppm) in the case of 4AmBA, and to the overall integration of the aromatic groups (7.0–7.7 ppm) for PAm and the block copolymers.![[thin space (1/6-em)]](https://www.rsc.org/images/entities/char_2009.gif) 127, PDI (GPC) 1.10.
127, PDI (GPC) 1.10.
![[thin space (1/6-em)]](https://www.rsc.org/images/entities/char_2009.gif) :
:![[thin space (1/6-em)]](https://www.rsc.org/images/entities/char_2009.gif) Et2O 1
Et2O 1![[thin space (1/6-em)]](https://www.rsc.org/images/entities/char_2009.gif) :
:![[thin space (1/6-em)]](https://www.rsc.org/images/entities/char_2009.gif) 1 and recovered as a white powder (250 mg, quantitative yield) after freeze-drying from water (dark, 2 days).
1 and recovered as a white powder (250 mg, quantitative yield) after freeze-drying from water (dark, 2 days).
General protocol for vesicle preparation
A solution of polymer (5–15 mg) in 1 mL of THF/MeOH (9![[thin space (1/6-em)]](https://www.rsc.org/images/entities/char_2009.gif) :
:![[thin space (1/6-em)]](https://www.rsc.org/images/entities/char_2009.gif) 1) was added drop-wise onto 1 mL of buffer (10 mM HEPES, 10 mM NaCl, pH 7.4), and the organic solvent was allowed to evaporate overnight. The resulting suspension was subjected to 8 freeze–thaw cycles (liquid N2, 40 °C water bath), and dialysed against osmotic buffer (10 mM HEPES, 100 mM NaCl, pH 10 and 7.4, 2 days).
1) was added drop-wise onto 1 mL of buffer (10 mM HEPES, 10 mM NaCl, pH 7.4), and the organic solvent was allowed to evaporate overnight. The resulting suspension was subjected to 8 freeze–thaw cycles (liquid N2, 40 °C water bath), and dialysed against osmotic buffer (10 mM HEPES, 100 mM NaCl, pH 10 and 7.4, 2 days).
Dye encapsulation assay
20 μL of polymeric vesicles solution prepared as described above, containing 50 mM 5(6)-carboxyfluorescein (CF), were diluted up to 1 mL with additional osmotic buffer (10 mM HEPES, 100 mM NaCl, pH 7.4). The change in fluorescence intensity (It) from 500 nm to 600 nm was monitored (λexc = 492 nm, λem = 517 nm) before and after disruption of the vesicle membrane by addition of 20 μL of Triton X-100 (20% w/w in H2O).General protocol for coating vesicles with b-PEI
15 mg mL−1 polymeric vesicle solutions prepared as described before and a 20 mg mL−1 solution of b-PEI were mixed with a polymer![[thin space (1/6-em)]](https://www.rsc.org/images/entities/char_2009.gif) :
:![[thin space (1/6-em)]](https://www.rsc.org/images/entities/char_2009.gif) b-PEI ratio of 1
b-PEI ratio of 1![[thin space (1/6-em)]](https://www.rsc.org/images/entities/char_2009.gif) :
:![[thin space (1/6-em)]](https://www.rsc.org/images/entities/char_2009.gif) 2, under stirring, and the system allowed to stand for 15 min. Excess of b-PEI was removed filtering through Sephadex G-25.
2, under stirring, and the system allowed to stand for 15 min. Excess of b-PEI was removed filtering through Sephadex G-25.
DLS
Polymeric vesicles were prepared as described above and diluted at least 10 times with additional osmotic buffer prior to DLS analysis. Hydrodynamic radii (RH) of the polymeric vesicles were measured via scattered light recorded at a 90° angle to incident radiation. Data processing was performed with the OmniSize 3.0 software. From standard auto correlation functions, measured diffusion coefficients were related to particle RHvia the Stokes–Einstein equation (eqn (1))| RH = kT/6πηD | (1) |
AFM
10 mM MgCl2 solution was incubated with freshly cleaved mica for 10 min, and then the mica was washed with distilled water several times and blown dry completely with nitrogen at room temperature. Polymeric vesicles were prepared as described above and filtered through 0.2 μm syringe filter, and diluted with additional osmotic buffer (10 mM HEPES, 100 mM NaCl, pH 7.4), to a final concentration of 500 μg mL−1 and filtered through a 0.45 μm syringe filter. Measurements quoted are the averages of at least 50 particles recorded at 25 °C. Image data were analysed using NanoScope Analysis software (Version 1.20 (Bruker)). For b-PEI coated vesicles, freshly cleaved mica without MgCl2 pre-treatment was employed.TEM
Polymeric vesicles prepared as described above, were diluted 100 times with additional osmotic buffer (10 mM HEPES, 100 mM NaCl, pH 7.4). 15 μL of sample were placed then for 1 minute on a copper grid coated with a formvar carbon film. The excess of sample was wicked away with the aid of filter paper, and the sample was stained with 15 μL of Uranyl Acetate (1%) for 3 min. The excess of staining solution was wicked away with the aid of filter paper and the sample was allowed to dry overnight prior to imaging by TEM. Measurements quoted are the averages of at least 100 particles.Zeta potential
Polymeric vesicles prepared as described above, were filtered through 0.2 μm syringe filter and diluted with additional osmotic buffer (10 mM HEPES, 100 mM NaCl, pH 7.4). The values reported are the average of 3 measurements.Vesicle stability
20 μL of polymeric vesicle solution prepared as described above, containing 50 mM CF, were diluted up to 1 mL with additional osmotic buffer. The time dependent change in fluorescence intensity (It) (λexc = 492 nm, λem = 517 nm) was monitored for at least 1 h in the case of pH stability, and at least overnight in the case of buffer stability. Encapsulated dye was released by disruption of the vesicle membrane as described above with Triton X-100. Time courses of It were normalised to relative intensity (IR) using the following equation (eqn (2)),| IR = (It − I0)/(IT − I0) × 100, | (2) |
Uptake
3T3 Fibroblasts or A549 cells were grown to a confluent monolayer in tissue culture treated 96 well plates. The cells were then incubated with a growth media, or media without FBS for b-PEI coated vesicles, containing polymeric vesicles (3 mg mL−1) loaded with 50 μM CF. The cells were incubated with the vesicles for up to 72 hours. At regular time point throughout the incubation the media was removed, the cells washed with PBS and fluorescent images were acquired. Uptake was measured via analysis of intensity of the green channel in the images.Cytotoxicity assays
Acute toxicity was measured via the LDH assay. Media removed from each well prior to the PBS washes for imaging was assessed for LDH activity using the CytotoxONE™ assay kit, whereby non fluorescent resazurin is reduced to resorufin in the presence of LDH. Plates containing the supernatant of the treated cells were incubated in the presence of the LDH reagent for 15 min at room temperature and the reaction stopped using the STOP solution. Fluorescence intensity (λexc = 560 nm, λem = 590 nm) was then measured compared to the fluorescence intensity of an untreated control (spontaneous LDH release) and cells treated with 4% Triton X-100 (100% LDH release).Chronic toxicity was measured via the MTT assay. Cells which had previously been treated with the vesicles were incubated for a further 24 hours in growth media, washed with PBS, and incubated for a further 2 hours with growth media containing 1 mg mL−1 MTT reagent. The cells were then washed once with PBS and 300 μL DMSO was added to each well and the plates incubated for 30 min to allow the formazan product to dissolve completely. A490 was measured for each treatment, and compared to untreated cells (100% MTT metabolism) and cells treated with 4% Triton X-100 (0% MTT metabolism).
Results
In order to produce robust vesicles that could withstand different aqueous conditions, acrylamide monomers were chosen. Amides have a higher stability against hydrolysis when compared to esters such as those in acrylates and methacrylates. In addition, a hydrophobic backbone with high crystallinity was desired, as it will provide a tighter packing than aliphatic residues, such as those in biologically relevant lipids. This way the mechanical properties of the vesicles will be improved leading to a higher resistance of the membrane to the diffusion of small molecules. With these considerations in mind, phenylacrylamide (PAm) and N-ω-acrylamidobutanoic acid (4AmBA) were chosen as the hydrophobic and hydrophilic components. Both monomers were prepared in good yields and high purity by modification of a previously reported protocol (ESI†).19To synthesise well defined polymers that could be chain extended into the desired amphiphilic blocks, controlled living polymerisation (CLP) techniques were required. From the currently available CLP, RAFT polymerisation is probably the most versatile and suitable for the preparation of acrylamide based polymers.22–26 The polymerisation of PAm using CTA1 as the RAFT agent and V-501 as the radical source, in DMF at 70 °C proved to be well controlled. As expected for any free radical polymerisation, the reaction followed pseudo-first order kinetics with a small induction period of approximately 30–40 min, typical of RAFT polymerisations. In addition there was a linear increase of MW with conversion while the polydispersity of the material was narrow throughout the polymerisation (Fig. 1). In this way, several materials could be prepared, with different MW (Table 1, entries 1–3, P1)
![Left: representative linear plot of ln[M]0/[M]tvs. time (solid) and plot of conversion vs. time (dashed). Right: representative plot of measured MW vs. conversion (solid) and PDI vs. conversion (dashed). Conditions: 70 °C; [PAm] = 1.6 M; [CTA1]/[PAm] = 100; [CTA1]/[V-501] = 3; DMF.](/image/article/2012/PY/c2py20352a/c2py20352a-f1.gif) | ||
| Fig. 1 Left: representative linear plot of ln[M]0/[M]tvs. time (solid) and plot of conversion vs. time (dashed). Right: representative plot of measured MW vs. conversion (solid) and PDI vs. conversion (dashed). Conditions: 70 °C; [PAm] = 1.6 M; [CTA1]/[PAm] = 100; [CTA1]/[V-501] = 3; DMF. | ||
| Entry | P | Solvent | CTA | [M] | Time min | c (%) | Final DP | Mn (NMR) | Mn (GPC) | PDI | |||||||||||||||||||||||||||||||||||||||||||||||||||||||||||||||||||||||||||||||||||||||||
|---|---|---|---|---|---|---|---|---|---|---|---|---|---|---|---|---|---|---|---|---|---|---|---|---|---|---|---|---|---|---|---|---|---|---|---|---|---|---|---|---|---|---|---|---|---|---|---|---|---|---|---|---|---|---|---|---|---|---|---|---|---|---|---|---|---|---|---|---|---|---|---|---|---|---|---|---|---|---|---|---|---|---|---|---|---|---|---|---|---|---|---|---|---|---|---|---|---|---|---|
| a CTA and V-501 added in EtOH. b Measured using DMF as the eluent. c Measured using DPBS as the eluent. | |||||||||||||||||||||||||||||||||||||||||||||||||||||||||||||||||||||||||||||||||||||||||||||||||||
| 1 | P1a | DMF | CTA1 | 1.60 | 944 | 85 | 22 | 3420 | 7309b | 1.35 | |||||||||||||||||||||||||||||||||||||||||||||||||||||||||||||||||||||||||||||||||||||||||
| 2 | P1b | DMF | CTA1 | 1.60 | 944 | 85 | 42 | 6404 | 13![[thin space (1/6-em)]](https://www.rsc.org/images/entities/char_2009.gif) 127b 127b |
1.37 | |||||||||||||||||||||||||||||||||||||||||||||||||||||||||||||||||||||||||||||||||||||||||
| 3 | P1c | DMF | CTA1 | 1.60 | 1020 | 84 | 66 | 9802 | 11![[thin space (1/6-em)]](https://www.rsc.org/images/entities/char_2009.gif) 575b 575b |
1.18 | |||||||||||||||||||||||||||||||||||||||||||||||||||||||||||||||||||||||||||||||||||||||||
| 4 | P1d | DMF | CTA2 | 0.81 | 205 | 76 | 42 | 6382 | 12![[thin space (1/6-em)]](https://www.rsc.org/images/entities/char_2009.gif) 330b 330b |
2.09 | |||||||||||||||||||||||||||||||||||||||||||||||||||||||||||||||||||||||||||||||||||||||||
| 5 | P2a | H2Oa | CTA3 | 0.75 | 181 | 92 | 28 | 4572 | 3492c | 1.09 | |||||||||||||||||||||||||||||||||||||||||||||||||||||||||||||||||||||||||||||||||||||||||
| 6 | P2b | H2Oa | CTA3 | 0.47 | 150 | 88 | 43 | 7006 | 13![[thin space (1/6-em)]](https://www.rsc.org/images/entities/char_2009.gif) 935c 935c |
1.06 | |||||||||||||||||||||||||||||||||||||||||||||||||||||||||||||||||||||||||||||||||||||||||
| 7 | P2c | H2Oa | CTA3 | 0.74 | 60 | 96 | 94 | 14![[thin space (1/6-em)]](https://www.rsc.org/images/entities/char_2009.gif) 985 985 |
19![[thin space (1/6-em)]](https://www.rsc.org/images/entities/char_2009.gif) 812c 812c |
1.19 | |||||||||||||||||||||||||||||||||||||||||||||||||||||||||||||||||||||||||||||||||||||||||
| 8 | P3a | DMF | P1c | 1.60 | 625 | 38 | 14 | 11![[thin space (1/6-em)]](https://www.rsc.org/images/entities/char_2009.gif) 946 946 |
17![[thin space (1/6-em)]](https://www.rsc.org/images/entities/char_2009.gif) 413b 413b |
1.20 | |||||||||||||||||||||||||||||||||||||||||||||||||||||||||||||||||||||||||||||||||||||||||
| 9 | P3b | Dioxane | P1b | 1.59 | 960 | 57 | 16 | 8896 | — | — | |||||||||||||||||||||||||||||||||||||||||||||||||||||||||||||||||||||||||||||||||||||||||
| 10 | P3c | DMSOa | P2a | 0.50 | 72 | 88 | 87 | 17![[thin space (1/6-em)]](https://www.rsc.org/images/entities/char_2009.gif) 245 245 |
— | — | |||||||||||||||||||||||||||||||||||||||||||||||||||||||||||||||||||||||||||||||||||||||||
| 11 | P3d | DMSOa | P2a | 0.50 | 77 | 86 | 78 | 21![[thin space (1/6-em)]](https://www.rsc.org/images/entities/char_2009.gif) 481 481 |
— | — | |||||||||||||||||||||||||||||||||||||||||||||||||||||||||||||||||||||||||||||||||||||||||
| 12 | P3e | DMSO | P2a | 0.50 | 70 | 57 | 31 | 9198 | — | — | |||||||||||||||||||||||||||||||||||||||||||||||||||||||||||||||||||||||||||||||||||||||||
| 13 | P3f | DMSO | P2a | 0.50 | 36 | 33 | 18 | 7225 | — | — | |||||||||||||||||||||||||||||||||||||||||||||||||||||||||||||||||||||||||||||||||||||||||
For the polymerisation of 4AmBA, the same conditions were initially investigated. However, monomer conversion was very low, even at the high concentrations employed (1.6 M). Several conditions were surveyed, that involved different solvents (H2O, H2O–EtOH) or the use of different RAFT agents. Interestingly, by employing trithiocarbonates CTA2 or CTA3, the polymerisations proceeded much faster. Once again, pseudo-first order kinetics was observed with good control both over the MW and the polydispersity of the materials obtained (Fig. S06, ESI†). In a similar fashion to PAm, a series of polymers with different MW were prepared (Table 2, entries 5–7, P2)
| P | Formula | D H (nm)a | D AFM (nm)b | D TEM (nm)c | Zeta potential (mV) | % 4AmBA | Vesicled | ||||||||||||||||||||||||||||||||||||||||||||||||||||||||||||||||||||||||||||||||||||||||||||
|---|---|---|---|---|---|---|---|---|---|---|---|---|---|---|---|---|---|---|---|---|---|---|---|---|---|---|---|---|---|---|---|---|---|---|---|---|---|---|---|---|---|---|---|---|---|---|---|---|---|---|---|---|---|---|---|---|---|---|---|---|---|---|---|---|---|---|---|---|---|---|---|---|---|---|---|---|---|---|---|---|---|---|---|---|---|---|---|---|---|---|---|---|---|---|---|---|---|---|---|
| a Measured in HEPES buffer (10 mM, 100 mM NaCl, pH 7.4) by DLS. Number distribution. b Measured in HEPES buffer (10 mM, 100 mM NaCl, pH 7.4) by AFM. c Measured over dry samples by TEM. d ✓ Denotes a positive result, where a significant increase in fluorescence was observed after addition of Triton, ✗ denotes a negative result where no increase or reduction of fluorescence was observed after addition of Triton. 5–10 mg mL−1 of P3 for vesicle preparation. | |||||||||||||||||||||||||||||||||||||||||||||||||||||||||||||||||||||||||||||||||||||||||||||||||||
| P3a | PAm66-b-4AmBA14 | 24 ± 9 | 36 ± 12 | 24 ± 14 | −39 ± 2 | 19% | ✓ | ||||||||||||||||||||||||||||||||||||||||||||||||||||||||||||||||||||||||||||||||||||||||||||
| P3b | PAm42-b-4AmBA16 | 18 ± 10 | 19 ± 5 | 23 ± 8 | −36 ± 2 | 29% | ✓ | ||||||||||||||||||||||||||||||||||||||||||||||||||||||||||||||||||||||||||||||||||||||||||||
| P3c | PAm87-b-4AmBA28 | 27 ± 8 | 34 ± 9 | 24 ± 4 | −29 ± 1 | 26% | ✓ | ||||||||||||||||||||||||||||||||||||||||||||||||||||||||||||||||||||||||||||||||||||||||||||
| P3d | PAm78-b-4AmBA28 | 14 ± 4 | 23 ± 9 | 16 ± 3 | −37 ± 2 | 34% | ✓ | ||||||||||||||||||||||||||||||||||||||||||||||||||||||||||||||||||||||||||||||||||||||||||||
| P3e | PAm31-b-4AmBA28 | 29 ± 10 | 32 ± 10 | 19 ± 3 | −29 ± 1 | 56% | ✓ | ||||||||||||||||||||||||||||||||||||||||||||||||||||||||||||||||||||||||||||||||||||||||||||
| P3f | PAm18-b-4AmBA28 | 23 ± 14/180 ± 14 | 26± 2/68 ± 28 | 26 ± 10 | −32 ± 6 | 69% | ✗ | ||||||||||||||||||||||||||||||||||||||||||||||||||||||||||||||||||||||||||||||||||||||||||||
For the preparation of amphiphilic block copolymers, the chain extension of p(PAm) (P1) was initially investigated. The choice of solvent proved to be complicated, due to the different solubility of both blocks. P1 are highly insoluble in the presence of water but can be solubilised in organic solvents such as alcohols, DMSO and DMF depending on their concentration and MW. P2, on the other hand, were only soluble in DMSO, low MW alcohols or aqueous solutions, with solubility in DMF strongly depending on their MW. Initially, the same conditions employed for the preparation of P1 were investigated (Table 1, entry 8, P3a). Polymerisations proceeded slowly, and only 38% of conversion could be achieved after more than 10 h, in agreement with the low reactivity of 4AmBA under these conditions (Fig. S09, ESI†).
The incompatible solubility of both blocks was also problematic for the analysis of the final materials. THF, CHCl3 or aqueous conditions could not be employed for the GPC analysis, and only DMF/0.1% LiBr seemed to be able to solubilise both blocks. However, the presence of two populations was detected after 20% of conversion was achieved. We infer that not all of the available starting blocks were able to initiate the polymerisation and give amphiphilic blocks, and those that did gave very high MW species (Fig. 2).
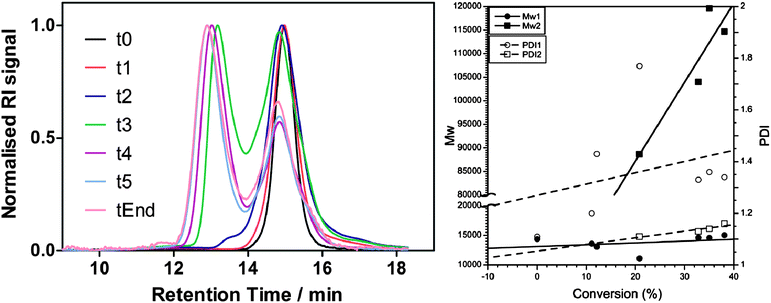 | ||
| Fig. 2 Left: GPC traces and Right: plot of measured MW vs. conversion and PDI vs. conversion for the two populations observed during the polymerisation of 4AmBA using P1c as the macro-RAFT agent to yield P3a. | ||
This behaviour was consistent with the macro-RAFT agents showing a slow initiation rate while the polymerisation proceeded with a high propagation rate. On the other hand, the hydrophilic block was sparingly soluble in DMF, and DLS analysis indicated that P3a might have aggregated in DMF. Therefore P3a, while dissolved in DMF/0.1% LiBr, could be forming colloidal aggregates, leading to materials with very high apparent MW when measured by GPC. If this were the case, the degree of aggregation would be affected by dilution and salt concentrations. Interestingly, the relative intensity of the two populations observed in the GPC was strongly dependent on both factors (Fig. 3), suggesting that aggregation was interfering with the characterisation.
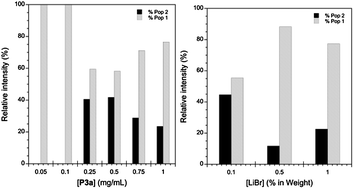 | ||
| Fig. 3 Left: percentage of the two populations observed in the GPC as a function of P3a concentration. Right: percentage of the two populations observed in the GPC as a function of LiBr concentration. | ||
In an attempt to improve the solubility of the hydrophilic block in DMF, the acid groups were esterified with EtOH. In all cases the percentage of the higher MW population was significantly reduced, supporting the idea that aggregation during GPC analysis could be compromising the characterisation of these amphiphilic block copolymers (Fig. S10, ESI†).
The polymerisation of 4AmBA with P1 as macroRAFT agents was also tested using different solvents, such as dioxane, but similar results were obtained, with 2 populations observed in the GPC. In addition, since trithiocarbonates were more efficient for the polymerisation of 4AmBA, the polymerisation of PAm with CTA2 as the RAFT agent was also investigated, with the aim of preparing a better macro-RAFT agent for the synthesis of (PAm)-b-(4AmBA) amphiphiles. Unfortunately, control over the polymerisation was lost in this case as reflected by the high PDI of the final material (Table 1, entry 4, P1d).
When the desired amphiphiles were prepared by chain extension of P2 using PAm as the monomer, similar results were obtained (Table 1, entries 10–13, P3c–f). Again, pseudo-first order kinetics was observed, but the polymerisation proceeded in shorter times, in relation to the faster kinetics observed so far with the trithiocarbonates (Fig. S09, ESI†). When analysed by GPC, again two populations could be detected.
While control over the polymerisation is desirable for the preparation of well-defined vesicles, it is not a key element. The MW of the polymer is important for vesicle formation, but it is expected that amphiphiles with a broad range of MW should be able to segregate the longer chains to the outer side of the vesicle while shorter polymers will accommodate in the inside.27 On the other hand, the most important parameter in order to predict if an amphiphile will form vesicular aggregates in solution is the volume fraction of the hydrophilic block. Volume fraction can be difficult to calculate, especially in the absence of ideal solvents for both blocks. Alternatively it has been estimated that for those amphiphiles having weight fractions of the hydrophilic block between 25 and 35%, a vesicle in aqueous solution could be expected.28 In order to investigate the best architecture for vesicle formation, we decided to prepare a series of polymers ranging hydrophilic weight percentage between 20 and 60% (Table 1, entries 7–14, P3). This weight percentage was estimated from the monomer composition measured by NMR. In all cases, the RAFT agent was removed by treatment with an excess of azo initiator,29 in order to prevent any side reaction derived from its cleavage.
Two main protocols were investigated for vesicle preparation: (a) a film method, in analogy to most of the work done with vesicles made from standard lipids and amphiphiles; and (b) a solvent exchange method, widely applied for the preparation of polymersomes. In our hands, the film method was less reliable, as the amphiphiles precipitated upon resuspension in the vesicle buffer, with no apparent relation between amphiphile concentration or formulation. On the other hand, the solvent exchange method, where the polymers were dissolved in a good volatile solvent that could be added onto vesicle buffer and left to evaporate overnight, gave better and more consistent results.
In order to confirm if the aggregates formed using these two protocols contained a hydrophilic core, a dye encapsulation method was employed. CF was chosen as a model hydrophilic dye, which should be encapsulated within the aqueous core of the vesicles. Therefore, 50 mM CF solutions, a concentration at which CF is self-quenched, were employed as the buffer for vesicle formation. The excess of dye was removed via extended dialysis against osmotic buffer (HEPES 10 mM, NaCl 100 mM, pH 10 and 7.4), and the encapsulation of CF confirmed by means of fluorescence (Fig. 4, Table 2). As expected, almost no fluorescence was observed when the vesicles were diluted 500 fold in the osmotic buffer, as the concentration of the dye should remain at 50 mM within the vesicles. When vesicles were burst with a surfactant, release of the encapsulated dye led to a significant increase in fluorescence, as the original self-quenching conditions no longer apply. It is worth noting that most of the block copolymer prepared in this work lead to the formation of vesicular aggregates (Table 2), suggesting that for these materials, the ratio of hydrophilic weight percentage suitable for vesicle formation was bigger than 25–35%
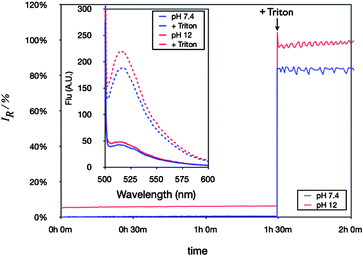 | ||
| Fig. 4 Evolution of fluorescence as a function of time, measured at pH 7.4 and 12. Inset: Representative fluorescence profiles of CF encapsulated in vesicles (P3b 5 mg mL−1 employed in this example, vesicles were burst after 1 h 30 min by addition of Triton). | ||
The characterisation of the vesicles by means of DLS revealed that the sizes of the aggregates in solution were, in most of the cases, below 100 nm in diameter, with very low polydispersities (Table 2). In order to have a better insight into the shape and morphology in solution of these vesicles, we used AFM analysis using PeakForce tapping mode. AFM analysis allows imaging in a liquid environment and this newly available imaging mode enables greater control of the probe–sample contact force when compared to tapping mode, and materials can be studied in liquid environment. Accordingly, artefacts, such as those resulting from drying, can be avoided.
AFM revealed that in all cases spherical objects were observed with sizes in close agreement with those measured by DLS (Fig. 5, Table 2), only slightly higher diameters were measured by AFM. This difference may arise from the fact that when calculating number distributions by DLS, the population of smaller objects tends to be overestimated. In addition, the features measured by AFM are usually a bit broader than the measured diameter by DLS, as a result of the finite size of the apex of the AFM probe.
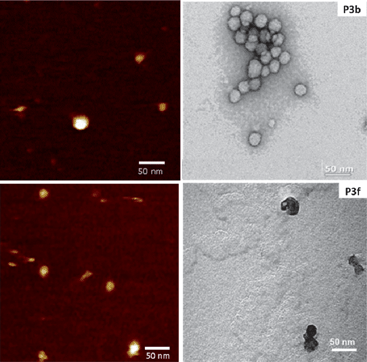 | ||
| Fig. 5 Representative examples of vesicle morphology as seen by AFM in solution (left) and negative staining TEM (right) (for AFM images vertical scales are 4 nm). 10 mg mL−1 of P3 for vesicle preparation. | ||
In order to confirm the spherical morphology of these aggregates, they were analysed using negative staining TEM. In this case, the sizes measured by TEM were slightly smaller than those measured by AFM. This reduction in size is expected, as the drying of the materials will lead to a collapse of the hydrophilic corona, which should be fully swelled in aqueous conditions. On the other hand, this drying did not have a strong impact on the integrity of the aggregates, and in all cases, spherical objects could be observed. In addition, TEM suggested that the aggregates prepared with P3a–e were hollow structures while for P3f micelles seemed to be the most common morphology (Fig. 5 and Fig. S12, ESI†).
Zeta potentials of the particles indicated, as expected, that particles were negatively charged, due to their carboxylic acid end groups.
Having prepared several amphiphilic block copolymers that assembled into spherical vesicles in solution, we were interested in determining stability under different aqueous conditions. CF-loaded vesicles were stable at neutral pH, with no apparent release of the dye for at least 1 h (Fig. 4, blue line). In a similar fashion, when those vesicles were placed in the same osmotic buffer but at a much higher pH, still no release of the vesicle contents could be observed (Fig. 4, red line). DLS analysis showed that almost no difference in size could be detected for the vesicles at both pH values (Fig. S13, ESI†).
Vesicle stability was also analysed by dilution into osmotic buffers containing different salts and ionic strengths. When CF loaded vesicles were diluted with an osmotic buffer containing 100 mM NaCl, the one used as a default osmotic buffer, only 15% of the CF was released after incubating overnight at room temperature (Fig. 6). Similar release of CF was observed when different ionic strengths were employed (NaCl, 10 mM and 1 M, Fig. 6) while no significant increase was observed when the vesicles were left to incubate for longer periods of time, even up to 4 days (Fig. S14, ESI†). This lack of further release after the first 24 h suggests that the initial release was probably due to CF loosely bound to the hydrophilic corona of the vesicles. Interestingly, similar levels of release were observed when other salts where employed such as Na2CO3, KCl or CaCl2. Only in the case of 1 M Na2CO3, was the amount of dye released notably different, being increased to almost 40% of the initial CF content (Fig. S14, ESI†). In all cases, DLS indicated that the size of the particles had not changed significantly after this incubation, and that the vesicles were stable in the presence of a wide range of salts under different ionic strengths (Fig. S15, ESI†).
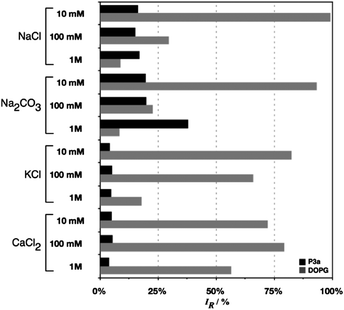 | ||
| Fig. 6 Percentage of CF released after incubating vesicles o.n. in the presence of different osmotic buffers containing different salts and ionic strengths. 5 mg mL−1 of P3b for vesicle preparation. | ||
The stability of these vesicles was in sharp contrast to that of liposomes prepared from 1,2-dioleoyl-sn-glycero-3-phospho-rac-(1-glycerol) sodium salt (DOPG), a model lipid that is also negatively charged in aqueous solutions. As expected, DOPG liposomes showed improved stability with increasing ionic strength. On the other hand, when NaCl was substituted for other salts, DOPG vesicles proved to be more unstable and for example more than 50% of the dye was released in the presence of 1 M CaCl2 (Fig. 6).
To test the biocompatibility of these materials, polymersomes were loaded with 50 μM CF and incubated with 3T3 fibroblasts and A549 cells; 3T3 fibroblasts represent a spontaneously immortalised embryonic fibroblast cell line while A549 cells represent an epithelial lung tumour cell line. These specific cell lines were chosen as difference in uptake of liposomal complexes has been reported by normal and tumour derived cell lines.14,30 Uptake of the vesicles was observed in both cell lines, without significant acute or chronic toxicity, up to 72 hours. However the uptake was slow, taking 16 hours to saturate in 3T3 fibroblasts (Fig. 7). This slow uptake was expected due to the repulsive forces between the negative surface of the vesicles and the negatively charged outer leaflet of the cell membrane.31
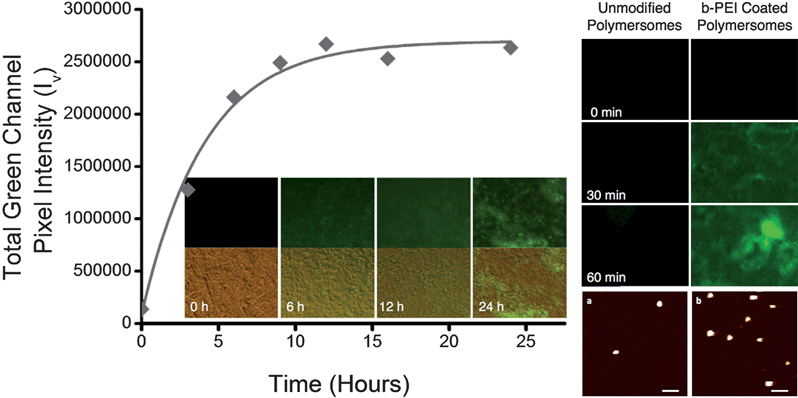 | ||
| Fig. 7 Left: uptake of polymersomes by 3T3 fibroblast and representative fluorescent (top) and merged (bottom) micrographs. Right: fluorescent micrographs of uptake by A549 cells of unmodified vs.b-PEI coated polymersomes, and representative example of vesicle morphology by AFM before (a) and after (b) coating with b-PEI. Scale bars: 200 nm, vertical scales: 20 nm. | ||
In order to improve uptake, a simple coating protocol, for which polymersomes solutions were mixed with b-PEI, was employed. Using this simple step, the charge on the surface of the vesicles was inverted (zeta potential 41 ± 2 mV). To minimise polymersome membrane disruption by b-PEI (Fig. S16, ESI†), an excess of this polymer was employed. After coating with b-PEI, vesicles could be imaged by AFM, using now negatively charged freshly cleaved mica. The spherical shape of the particles was not affected, and no aggregation could be observed (Fig. 7). In addition, uptake was significantly enhanced, saturating after about 30 min in A549 cells, at the expense of biocompatibility. Polymersomes modified with b-PEI caused 25% cell lysis after a 30 min incubation and 100% following a 60 min incubation, as determined by the LDH release assay. When chronic toxicity was measured 24 hours post incubation, only 18% of the cells remained metabolically active following a 30 min incubation. Cytotoxicity was reduced when a 15 min incubation was employed, and 90% of the cells remained metabolically active, as determined by the MTT assay. The acute toxicity is more than likely caused by the membrane disruptive effects of b-PEI, as can be observed from the brightfield images of the cells following a 60 min incubation (Fig. S17, ESI†). This is in sharp contrast with the stability of the polymeric vesicles, which were able to stand this concentration of b-PEI without significant changes to their morphology (Fig. 7) or the release of the loaded CF. The increase between acute and chronic toxicity in the 30 min incubation can be accounted for by the destabilisation of organelle membranes by b-PEI and the subsequent trigger of both apoptotic and necrotic cell death.32 Due to the greatly enhanced uptake of the b-PEI modified polymersomes, much smaller concentrations of polymersomes could be employed in further experiments to extend the incubation window at which the polymersomes are biocompatible whilst still maintaining rapid saturation of polymersome uptake.
Conclusions
In conclusion, a series of polymeric amphiphiles with the general structure p(4AmBA)-b-(PAm) have been prepared. Those amphiphiles with percentages of hydrophilic monomer between 20 and 55% in weight, self assemble in aqueous environment to yield well defined polymersomes. These vesicular aggregates have been characterised by means of DLS, AFM and TEM, showing that in most cases the size and shape of the aggregates obtained were well defined, with sizes ranging 20–30 nm and in very narrow size distributions. The ability of these polymersomes to encapsulate hydrophilic molecules was evaluated using CF. The polymersomes proved to be remarkably stable across a range of conditions such as increased pH, in the presence of different buffer strengths and regardless of the salt nature. This stability is in sharp contrast to those vesicles prepared with DOPG. In addition, the vesicles are biocompatible, showing no toxicity towards 3T3 and A549 cell lines, and their cell uptake can be improved by a simple coating protocol. Alternatively, decoration of the surface of the vesicles with targeting ligands via covalent linkages could also lead to improved uptake. All of these properties suggest that polymersomes of this type may find potential applications in fields such as materials science, diagnostics and imaging.Acknowledgements
We thank the UK EPSRC and BBSRC (Grants EP/G042462/1, EP/D022347/1, D021847/1 and BB/F01855X/1) and the University of Nottingham, U.K., for funding. We thank Dr Jonathan Aylott (University of Nottingham) for access to Fluorometer, Dr Chis Parmenter and Dr Emma King (University of Nottingham) for help with TEM imaging.Notes and references
- F. Meng, Z. Zhong and J. Feijen, Biomacromolecules, 2009, 10, 197–209 CrossRef CAS.
- O. Onaca, R. Enea, D. W. Hughes and W. Meier, Macromol. Biosci., 2009, 9, 129–139 CrossRef CAS.
- W. T. Al-Jamal and K. Kostarelos, Acc. Chem. Res., 2011, 44, 1094–1104 CrossRef CAS.
- R. P. Brinkhuis, F. P. J. T. Rutjes and J. C. M. van Hest, Polym. Chem., 2011, 2, 1449–1462 RSC.
- K. Renggli, P. Baumann, K. Langowska, O. Onaca, N. Bruns and W. Meier, Adv. Funct. Mater., 2011, 21, 1241–1259 CrossRef CAS.
- U. J. Meierhenrich, J.-J. Filippi, C. Meinert, P. Vierling and J. P. Dworkin, Angew. Chem., Int. Ed., 2010, 49, 3738–3750 CrossRef CAS.
- P. Walde, K. Cosentino, H. Engel and P. Stano, ChemBioChem, 2010, 1–19 Search PubMed.
- B. M. Discher, Y. Y. Won, D. S. Ege, J. C. Lee, F. S. Bates, D. E. Discher and D. A. Hammer, Science, 1999, 284, 1143–1146 CrossRef CAS.
- J. C. Lee, H. Bermudez, B. M. Discher, M. A. Sheehan, Y. Y. Won, F. S. Bates and D. E. Discher, Biotechnol. Bioeng., 2001, 73, 135–145 CrossRef CAS.
- H. Bermudez, A. Brannan, D. Hammer, F. Bates and D. Discher, Macromolecules, 2002, 35, 8203–8208 CrossRef CAS.
- M. Antonietti and S. Forster, Adv. Mater., 2003, 15, 1323–1333 CrossRef CAS.
- B. Discher, D. Hammer, F. Bates and D. Discher, Curr. Opin. Colloid Interface Sci., 2000, 5, 125–131 CrossRef CAS.
- D. E. Discher and A. Eisenberg, Science, 2002, 297, 967–973 CrossRef CAS.
- P. L. Soo and A. Eisenberg, J. Polym. Sci., Part B: Polym. Phys., 2004, 42, 923–938 CrossRef CAS.
- T. Smart, H. Lomas, M. Massignani, M. V. Flores-Merino, L. R. Perez and G. Battaglia, Nano Today, 2008, 3, 38–46 CrossRef CAS.
- A. Blanazs, S. P. Armes and A. J. Ryan, Macromol. Rapid Commun., 2009, 30, 267–277 CrossRef CAS.
- J. Du and R. K. O'reilly, Soft Matter, 2009, 5, 3544–3561 RSC.
- C. Lopresti, H. Lomas, M. Massignani, T. Smart and G. Battaglia, J. Mater. Chem., 2009, 19, 3576 RSC.
- J. Auernheimer, C. Dahmen, U. Hersel, A. Bausch and H. Kessler, J. Am. Chem. Soc., 2005, 127, 16107–16110 CrossRef CAS.
- S. Thang, Y. Chong, R. Mayadunne, G. Moad and E. Rizzardo, Tetrahedron Lett., 1999, 40, 2435–2438 CrossRef CAS.
- J. Skey and R. K. O'reilly, Chem. Commun., 2008, 4183–4185 RSC.
- K. Matyjaszewski, in Controlled/Living Radical Polymerization: Progress in ATRP, ed. K. Matyjaszewski, American Chemical Society, Washington, DC, 2009, vol. 1023, pp. 3–13 Search PubMed.
- G. Moad, E. Rizzardo and S. Thang, Aust. J. Chem., 2004, 58, 379–410 CrossRef.
- A. Lowe and C. McCormick, Prog. Polym. Sci., 2007, 32, 283–351 CrossRef CAS.
- C. Barner-Kowollik, Handbook of RAFT Polymerization, Wiley-VCH, Weinheim, 2008 Search PubMed.
- C. Boyer, V. Bulmus, T. Davis, V. Ladmiral, J. Liu and S. Perrier, Chem. Rev., 2009 Search PubMed.
- O. Terreau, L. Luo and A. Eisenberg, Langmuir, 2003, 19, 5601–5607 CrossRef CAS.
- D. E. Discher and F. Ahmed, Annu. Rev. Biomed. Eng., 2006, 8, 323–341 CrossRef CAS.
- S. Perrier, P. Takolpuckdee and C. Mars, Macromolecules, 2005, 38, 2033–2036 CrossRef CAS.
- I. Ito, G. Began, I. Mohiuddin, T. Saeki, Y. Saito, C. D. Branch, A. Vaporciyan, L. C. Stephens, N. Yen, J. A. Roth and R. Ramesh, Mol. Ther., 2003, 7, 409–418 CrossRef CAS.
- C. R. Miller, B. Bondurant, S. D. McLean, K. A. McGovern and D. F. O'Brien, Biochemistry, 1998, 37, 12875–12883 CrossRef CAS.
- O. M. Merkel, A. Beyerle, B. M. Beckmann, M. Zheng, R. K. Hartmann, T. Stöger and T. H. Kissel, Biomaterials, 2011, 32, 2388–2398 CrossRef CAS.
Footnote |
| † Electronic supplementary information (ESI) available: Monomer synthesis, polymer characterisation, additional AFM and TEM micrographs, vesicle stability data and further cell imaging. See DOI: 10.1039/c2py20352a |
| This journal is © The Royal Society of Chemistry 2012 |
