 Open Access Article
DFT study of the structures and energetics of 98-atom AuPd clusters†
Alina
Bruma
a,
Ramli
Ismail
bc,
L.
Oliver Paz-Borbón
bd,
Haydar
Arslan
e,
Giovanni
Barcaro
f,
Alessandro
Fortunelli
f,
Z. Y.
Li
a and
Roy L.
Johnston
*b
aNanoscale Physics Research Laboratory, School of Physics and Astronomy, University of Birmingham, Edgbaston, Birmingham, B152TT, UK
bSchool of Chemistry, University of Birmingham, Edgbaston, Birmingham, B152TT, UK. E-mail: r.l.johnston@bham.ac.uk
cMax Planck Institute for Solid State Research, Heisenbergstrasse 1, D-70569 Stuttgart, Germany
dCompetence Centre for Catalysis, Chalmers University of Technology, Gothenburg, SE-41296, Sweden
eDepartment of Physics, Bulent Ecevit University, Zonguldak, 67100, Turkey
fCNR-IPCF, Istituto per i Processi Chimico-Fisici del Consiglio Nazionale delle Ricerche, Via G. Moruzzi 1, 56124, Pisa, Italy
First published on 23rd November 2012
Abstract
The energetics, structures and segregation of 98-atom AuPd nanoclusters are investigated using a genetic algorithm global optimization technique with the Gupta empirical potential (comparing three different potential parameterisations) followed by local minimizations using Density Functional Theory (DFT) calculations. A shell optimization program algorithm is employed in order to study the energetics of the highly symmetric Leary Tetrahedron (LT) structure and optimization of the chemical ordering of a number of structural motifs is carried out using the Basin Hopping Monte Carlo approach. Although one of the empirical potentials is found to favour the LT structure, it is shown that Marks Decahedral and mixed FCC-HCP motifs are lowest in energy at the DFT level.
Introduction
Bimetallic nanoparticles (“nanoalloys”)1 have received considerable attention for their unique properties, which are different from those of pure clusters2,3 especially in the domain of nanocatalysis.4–9 Gold–palladium (AuPd) nanoparticles are one of the most attractive systems because of their promising activity in catalysis.10 This superior performance has been widely attributed to electronic and/or geometric effects.11,12 Previous experimental studies have emphasized that it is possible to design various configurations of the same catalyst (i.e. alloy structure,13 PdcoreAushell,14 AucorePdshell15 or even 3 layer onion-like AuPd nanoparticles16) whereas theoretical studies17 have emphasized that a PdcoreAushell structure is favoured. From a theoretical point of view, empirical potentials (EP) have been widely employed for the determination of the structural and energetic configurations of nanoclusters in order to overcome the computational limitations imposed by more computationally expensive first principles approaches. The EP are suitable and versatile for modelling noble and quasi-noble metals. However, as it is known that important modifications can be introduced by electronic effects,18 it is important to verify the predictions of the EP using first principles calculations. Density Functional Theory (DFT) is one of the most accurate methods for describing such effects. We have previously reported19 that a systematic search of the global minimum (GM) for 50-atom PdAu clusters is highly demanding for high level calculations because of the computational limitations in exploring vast areas of the configurational space. In the case of bimetallic clusters, it is generally accepted20,21 that the search is even more difficult due to the existence of homotops (isomers related by swapping the positions of one or more heterometallic pairs). In the present study, a hybrid approach has been adopted, based on a genetic algorithm (GA) for structural searching and Basin-Hopping Monte Carlo homotop searching22 at the EP level, followed by DFT local relaxation, to perform a thorough search of the configurational space for 98 atom AuPd nanoclusters. Three different parameterisations of the Gupta many-body empirical potential have been investigated and DFT local relaxations are performed for the putative global minimum (GM) structures identified for all parameter sets.Fig. 1 shows a series of typical experimental images of AuPd nanoparticles obtained with a 200 kV Aberration-Corrected JEOL JEM2100F Scanning Transmission Electron Microscope (STEM) equipped with a High Angle Annular Dark Field (HAADF) detector. The images show AuPd nanoparticles deposited via physical vapour deposition onto amorphous carbon substrate and subsequently annealed in situ for 2 hours at 473 K. It can be seen that, for the same sample, a variety of sizes (from 1 to ∼3 nm) and morphologies can be encountered, with chemical ordering ranging from alloy to Janus nanoparticles. However, although DFT calculations are limited to smaller sizes, these studies can be considered important starting points in understanding the metal–metal interactions in larger nanoparticles.
 | ||
| Fig. 1 Structural evolution with size of AuPd nanoparticles deposited via physical vapor deposition on amorphous carbon substrate and annealed at 473 K for 2 hours. Various morphologies of AuPd nanoparticles can be observed as size increases, from alloy to Janus structures. | ||
Computational details
The first step of this study involves the use of an empirical atomistic potential to allow a rapid search for the lowest energy isomers in configurational space. The Gupta potential has been used in order to model the interatomic interactions, with parameters chosen as described by Cleri and Rosato23 and Ismail and Johnston.24 The Gupta potential is based on the second moment approximation to tight-binding theory. The configurational energy of a cluster is written as the sum over all atoms of the many body attractive (Vm) and pair repulsive (Vr) energy components: | (1) |
 | (2) |
 | (3) |
In eqn (1)–(3), the parameters α and β represent the atomic species of atoms i and j. Parameters A, r0, ξ, p and q are usually fitted to the experimental values of the cohesive energy, lattice parameters and independent elastic constants for the reference crystal structure of pure metals and bulk alloys at 0 K. The values of the Gupta potential parameters describing the Pd–Pd, Pd–Au and Au–Au interactions are described in Table 1 and are taken from ref. 23 and 24. Here, the three sets of parameters are described as: (a) ‘Average’: the heteronuclear Pd–Au parameters are obtained by averaging the pure Pd–Pd and Au–Au parameters; (b) ‘Exp-fit’: the Pd–Pd, Au–Au and Pd–Au parameters are fitted to the experimental properties of bulk Pd, Au and features of the bulk Pd–Au phase diagrams; (c) ‘DFT-fit’: the homo- and heteronuclear parameters were fitted to DFT calculations of solid phases.19
| Parameter | Pd–Pd | Pd–Au | Au–Au | ||||||
|---|---|---|---|---|---|---|---|---|---|
| Average | DFT-fit | Exp-fit | Average | DFT-fit | Exp-fit | Average | DFT-fit | Exp-fit | |
| A (eV) | 0.1746 | 0.1653 | 0.171493044 | 0.19 | 0.1843 | 0.2764 | 0.2016 | 0.2019 | 0.209570656 |
| ξ (eV) | 1.718 | 1.6805 | 1.701873210 | 1.75 | 1.7867 | 2.082 | 1.79 | 1.8097 | 1.815276400 |
| p | 10.867 | 10.8535 | 11.000 | 10.54 | 10.5420 | 10.569 | 10.229 | 10.2437 | 10.139 |
| q | 3.742 | 3.7516 | 3.794 | 3.89 | 3.8826 | 3.913 | 4.036 | 4.0445 | 4.033 |
| r 0 | 2.7485 | 2.7485 | 2.7485 | 2.816 | 2.8160 | 2.816 | 2.884 | 2.8840 | 2.884 |
Global structural optimization has been performed using a GA, as encoded in the Birmingham Cluster Genetic Algorithm (BCGA) program.26 The GA parameters are: population size = 40; crossover rate = 0.8 (i.e. 32 offspring are produced per generation); crossover type = 1-point weighted (the splice position is calculated based on the fitness values of the parents); selection = roulette wheel; mutation rate = 0.1; mutation type = mutate_move; number of generations = 400; the number of GA runs for each composition is 100. This high number of GA runs is necessary due to the relatively large size of clusters and the presence of homotops.
For selected compositions, homotop optimization has been performed using the Basin Hopping Monte Carlo algorithm30,31 allowing only Pd–Au atom exchange moves,31–33 for a fixed structural configuration and composition. Typically, for each size and composition, a search of 50![[thin space (1/6-em)]](https://www.rsc.org/images/entities/char_2009.gif) 000 steps at kBT = 0.05 eV has been performed, followed by a final refinement of 20
000 steps at kBT = 0.05 eV has been performed, followed by a final refinement of 20![[thin space (1/6-em)]](https://www.rsc.org/images/entities/char_2009.gif) 000 steps at kBT = 0.01 eV.
000 steps at kBT = 0.01 eV.
The 98-atom Leary Tetrahedron (LT) cluster is of interest as it has been discovered by Leary and Doye as the GM for the 98-atom Lennard-Jones cluster (LJ98).35 Furthermore, this structure has also been proposed as the lowest in energy for 98-atom silver clusters, described by the Sutton-Chen (SC) potential and for an aggregate of C60 molecules.36 Paz-Borbon et al. have established that the LT is the preferred structure over a wide compositional range for 98-atom Pd–Pt clusters at the Gupta potential level.22 A shell optimization program has been used to generate all possible high symmetry Leary Tetrahedron (LT) isomers, in order to assess how stable this structure is for 98-atom AuPd clusters. A substantial reduction in the search space is obtained if all sets of symmetry-equivalent atoms (i.e. ‘atomic shells’ or orbits of the Td point group) in the LT structure are constrained to be of the same chemical species.34 This reduces the number of inequivalent compositional and permutational isomers (homotops) to 2S where S is the total number of atomic shells. The 98-atom LT has S = 9 shells (in order of increasing distance from the centre of the clusters these shells contain 4![[thin space (1/6-em)]](https://www.rsc.org/images/entities/char_2009.gif) :
:![[thin space (1/6-em)]](https://www.rsc.org/images/entities/char_2009.gif) 12
12![[thin space (1/6-em)]](https://www.rsc.org/images/entities/char_2009.gif) :
:![[thin space (1/6-em)]](https://www.rsc.org/images/entities/char_2009.gif) 12
12![[thin space (1/6-em)]](https://www.rsc.org/images/entities/char_2009.gif) :
:![[thin space (1/6-em)]](https://www.rsc.org/images/entities/char_2009.gif) 12
12![[thin space (1/6-em)]](https://www.rsc.org/images/entities/char_2009.gif) :
:![[thin space (1/6-em)]](https://www.rsc.org/images/entities/char_2009.gif) 4
4![[thin space (1/6-em)]](https://www.rsc.org/images/entities/char_2009.gif) :
:![[thin space (1/6-em)]](https://www.rsc.org/images/entities/char_2009.gif) 6
6![[thin space (1/6-em)]](https://www.rsc.org/images/entities/char_2009.gif) :
:![[thin space (1/6-em)]](https://www.rsc.org/images/entities/char_2009.gif) 12
12![[thin space (1/6-em)]](https://www.rsc.org/images/entities/char_2009.gif) :
:![[thin space (1/6-em)]](https://www.rsc.org/images/entities/char_2009.gif) 12
12![[thin space (1/6-em)]](https://www.rsc.org/images/entities/char_2009.gif) :
:![[thin space (1/6-em)]](https://www.rsc.org/images/entities/char_2009.gif) 24 atoms) resulting in a total of 29 = 512 LT isomers.22
24 atoms) resulting in a total of 29 = 512 LT isomers.22
DFT calculations were carried out using the Plane Wave Self Consistent Field (PWscf) code in Quantum Espresso (QE).27 Calculations were made using the Perdew–Burke–Ernzerhof (PBE)28 exchange-correlation functional and ultrasoft pseudopotentials. Following convergence and accuracy tests, the following parameters have been selected: values of 40 and 160 Ry (1Ry = 13.606 eV) were used as the energy cut-off for the selection of the plane-wave basis set for the description of the wave function and the electron density respectively. Eigenvalues and eigenstates of the Kohn–Sham Hamiltonian have been calculated at the Gamma point only of a cubic cell of side of approximately 20 Å, applying a Gaussian smearing technique with a broadening of the one-particle levels of 0.03 eV. The DFT local relaxations were performed by fully relaxing the coordinates of the metal atoms until the forces were smaller than 0.1 eV Å−1.
Energetic analysis
The potential energy of a cluster calculated at the Gupta level, Vclus, can be written as:| Vclus = −NEGuptab | (4) |
 | (5) |
The excess energy quantifies the energy of mixing (the energy associated with alloying) between two different metals. The most negative values of the excess energy indicate the presence of compositions for which mixing between the two metals is most favourable18,29 and thus more stable clusters. At the DFT level, the calculated total potential energy of a cluster is Eclus and the total energy of a single atom is Eatom (corresponding to the atom type present in the cluster, Pd or Au). The average binding energy of a pure N-atom cluster is:
 | (6) |
The average binding energy of a bimetallic cluster is then given by:
 | (7) |
Results and discussions
The energetics of the 98-atom AuPd clusters have been investigated using a combination of BCGA and Basin Hopping Monte Carlo (BHMC) approaches for all the three Gupta potentials. First, the potential energy surface (PES) has been investigated using a GA search for all compositions, PdmAu98−m; then the BHMC approach has been employed in order to optimize the chemical ordering corresponding to the structures located around the minima of the excess energy curves.Gupta potential with DFT-fit parameters
In Fig. 2, the DFT-fit potential excess energy curve is shown in blue. The lowest values of the excess energy have been found in the compositional range Pd39Au59–Pd59Au39, indicating that these are relatively stable structures. The vast majority of compositions in the range Pd34Au54–Pd74Au42 are Marks Decahedron (M-Dh) structures (see Fig. 3 at Pd98). Several other structural families such as Ino Decahedron (Ino-Dh) (e.g. Pd2Au96, Pd14Au84), incomplete icosahedron (In-Ico) (e.g. Pd21Au77), FCC (e.g. Pd1Au97) and FCC-HCP (e.g. Pd93Au5 and Au98) with geometries exemplified in Fig. 3 can also be identified. The Ino-Dh clusters have been also reported for 98-atom Ni clusters modelled by the Sutton-Chen potential.35 Other structures identified as a function of composition are described in detail in ESI S1.†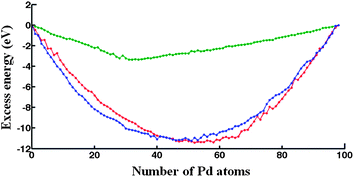 | ||
| Fig. 2 Excess energy for 98-atom PdmAu98−m clusters determined for the: DFT fit (blue curve), Exp-fit (red curve) and Average (green curve) Gupta potentials. | ||
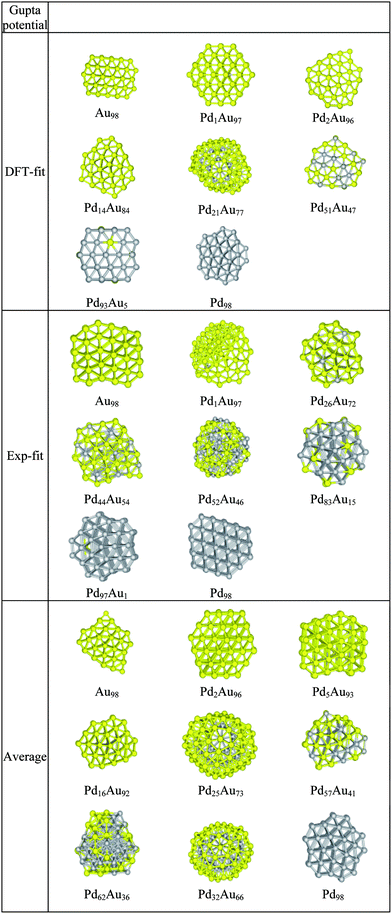 | ||
| Fig. 3 Structural motifs found for selected PdmAu98−m clusters using the three Gupta potentials. | ||
Gupta potential with Exp-fit parameters
The Exp-fit excess energy curve is shown in red in Fig. 2. For this choice of potential, in terms of structural variety, a structural transition from In-Ico to Ino-Dh or M-Dh appears on the left side of the minimum excess energy (i.e. biased towards pure Au), from Pd47Au51 to Pd24Au64 with exceptions including Pd32Au66 and Pd45Au53 (In-Ico) and Pd37Au61 with an FCC-HCP structure (see ESI S2†). The Au98 cluster has an FCC-HCP structure, whereas Pd98 is FCC-like. These structures are shown in Fig. 3 along with other interesting motifs.Gupta potential with Average parameters
The excess energy for the Average potential is plotted in Fig. 2 (green curve). Compared with the other two potentials, the values of the excess energies are noticeably less negative and the shape of the curve is quite different. The minimum excess energy is found for Pd32Au66. This is an interesting structure, as the 32 Pd atoms sit in the centre of an In-Ico configuration, surrounded by a shell of Au atoms (Fig. 3). Also (see ESI S3†), we notice that Dh structures are predominantly encountered for Pd-rich compositions and there is a general trend of a transition to In-Ico and Dh clusters for Au-rich compositions. From a structural point of view, the pure Au98 cluster has a low symmetry Dh structure, whereas Pd98 has a M-Dh structure. As we increase the concentration of Au, the Au atoms tend to occupy surface sites forming patches distributed over the cluster surface. Another interesting cluster is Pd62Au36 which has a structure based on a fragment of the Leary Tetrahedron (Fig. 3).It is interesting to note that both DFT-fit and Exp-fit Gupta potentials offered a larger degree of mixing between Pd and Au, than for the Average Gupta potential. This is confirmed by the quantification of the homonuclear and heteronuclear bonds, as shown in ESI S4.† As shown in Table 1, the Exp-fit potential has a pair (repulsive) energy scaling parameter (A) that is larger for Pd–Au than for either Pd–Pd or Au–Au. This has been shown to favour layer segregation in PdPt structures, in the paper of Massen et al.37 However, this potential also has a larger value of the many-body energy scaling parameter, ξ, which is greatest for Pd–Au, favouring heteronuclear mixing.19 The value of the ξ parameter will eventually dominate overall, so the fitted potentials should favour more Pd–Au mixing.
Leary Tetrahedron (LT) clusters
Based on previous studies, the LT structure is difficult to find using the GA program – in the case of PdPt clusters, it is typically found about 1% of the time.25 This is probably due to the existence of a narrower but deeper potential energy basin for the LT structures. The shell program constraints the structure to be LT (and in particular the high symmetry isomers and homotops) such that if the shell program finds (for a given composition) a LT isomer lower in energy than the structure found by the GA it shows that the GA obviously has not found the true GM. Possibly there could be a lower structure still – or even a lower symmetry LT – by exchanging positions of unlike atoms. This possibility has been tested using the BHMC technique, with exchange-only moves, as carried out for 98-atom Pd–Pt clusters.25The excess energy of LT clusters with respect to LT Au98 and Pd98 clusters are plotted in Fig. 4 as a function of Pd content for all three Gupta potentials. After optimization of the chemical ordering, the energies of the LT clusters are in close competition with those of other structural motifs; for example, when using the Average potential, the LT is found to be the lowest energy motif over a broad range, around the 50%/50% composition. Analysis of the LT structures with the lowest excess energies reveal that they possess segregated PdcoreAushell chemical ordering. Segregation of Au atoms to the surface can be rationalized in terms of the lower surface energy and cohesive energy of Au. The smaller atomic radius of Pd also favours Pd occupation of core sites.25,38
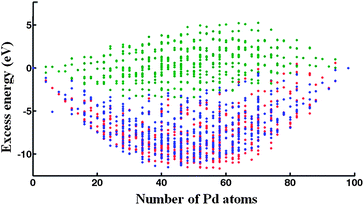 | ||
| Fig. 4 Plot of the LT excess energy as a function of Pd content for high-symmetry 98-atom clusters modeled by the DFT-fit (blue dots), Exp-fit (red dots), Average (green dots) Gupta potentials. | ||
DFT relaxation calculations and study of competition between different structural families
GM structures found at the EP level for compositions Pd46Au52–Pd52Au46 (i.e. in the region of the minima in the excess energy curves) were relaxed at the DFT level before the optimization of the chemical ordering with the BHMC code. The variation of excess energies as a function of number of Pd atoms, calculated at the DFT level (ΔDFT98), is shown in Fig. 5.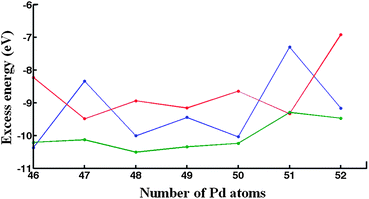 | ||
| Fig. 5 DFT excess energies of the ‘putative’ GM for the DFT-fit (blue curve), Exp-fit (red curve) and Average (green curve) Gupta potentials, in the range Pd46Au52–Pd52Au46. | ||
In contrast to the plots of ΔGupta98 shown in Fig. 2, which are quite smooth, the ΔDFT98plots are rather jagged, especially for the isomers produced by the DFT-fit and Exp-fit potentials. Fig. 5, shows that the Average potential leads to more negative excess energies at the DFT level for nearly all compositions compared to the DFT-fit and Exp-fit isomers (the exceptions are Pd46Au52, for which the DFT-fit isomer is lower, and Pd51Au47, for which the Exp-fit isomer is lower). As mentioned above, the Average potential stabilises PdcoreAushell homotops in contrast to the DFT-fit and Exp-fit, which prefer more mixed configurations. This is supported by the quantification of the homonuclear and heteronuclear bonds, as shown in ESI S4,† as well as the isomers shown in ESI S5.† It seem therefore that the Exp-fit and DFT-fit potentials overestimate the stability of mixed isomers relative to DFT calculations.
Fig. 6a–c shows the excess energies after optimization of chemical ordering for each of the three Gupta potentials, starting from the lowest-energy homotops of each structural motif found in the GA runs (FCC-HCP, M-Dh, In-Ico and LT). For compositions for which these structural motifs have not been found by GA and BH, these have been constructed, and subsequently subjected to BH atom-exchange in order to optimize the chemical ordering.
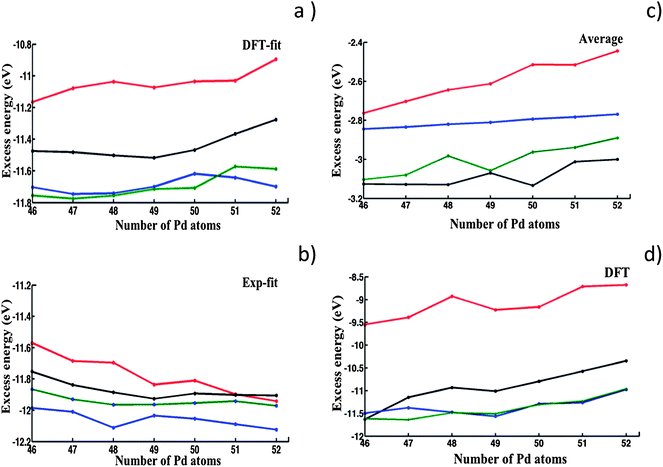 | ||
| Fig. 6 Excess energy plots comparing LT (black), FCC-HCP (blue), M-Dh (green) and In-Ico (red) structural motifs in the range Pd46Au52–Pd52Au46. (a–c) Results of BHMC optimization of chemical ordering for: (a) DFT-fit; (b) Exp-fit; and (c) Average Gupta potentials. (d) Results of relaxation of Average potential isomers at the DFT level. | ||
We have then performed DFT local relaxations on the optimized homotops obtained with the Average potential, with the DFT excess energies shown in Fig. 6d. This is justified because the Average potential was earlier shown to yield homotops with the lowest excess energy values after relaxation at the DFT level (Fig. 5).
In Fig. 6a and b it is interesting to note that, at the EP level, for the DFT-fit and Exp-fit potentials there is a close competition between the FCC-HCP and M-Dh motifs, which are significantly lower in energy than the LT motif by approximately 0.3 eV. The order is reversed for the Average potential (Fig. 6c), for which the LT isomers are competitive with M-Dh but are much lower in energy by 0.3 eV or more than FCC-HCP. All three potentials agree in predicting the In-Ico to lie higher in energy than the other three motifs (apart from the Exp-fit potential which finds In-Ico < LT for the composition Pd52Au46).
As shown in Fig. 6d, DFT relaxation of the structural motifs optimized for the Average potential (see also ESI S5†) leads to a change in the stability order, with the lowest excess energies now belonging (as for the DFT-fit and Exp-fit potentials) to the FCC-HCP and M-Dh motifs. It is clear that the LT is destabilised at the DFT level compared to the FCC-HCP and M-Dh structures, though it still lies considerably lower in energy than the In-Ico structures and is almost degenerate with the M-Dh (and lower than FCC-HCP) for Pd46Au52. This theoretical prediction can be directly linked to our experimental study of evaporated AuPd nanoparticles (Fig. 1), where structural motifs such as FCC are often encountered, whereas LT structures have not yet been observed for AuPd nanoparticles.
Conclusions
Three parameter sets (DFT-fit, Exp-fit and Average) have been compared for the Gupta potential in order to study the structures and energetics of 98-atom PdAu nanoclusters. An extensive search of the configurational space has been performed using a genetic algorithm in order to identify the global minimum for all three potentials, at the empirical potential level. It was found that the DFT-fit and Exp-fit potentials favour a higher degree of Pd–Au mixing compared to the Average potential, which favours core–shell configurations – which are in better agreement with DFT calculations. A shell optimization program has been employed to generate Leary Tetrahedron structures, which were found to be the most stable motif for the Average potential. However, Basin Hopping Monte Carlo optimization of the homotops of a number of low-energy structures, followed by DFT relaxation, reveal that the FCC-HCP and Marks Decahedron structural motifs are lower in energy than Leary Tetrahedron and Icosahedron structures. These observations seem to be consistent with our experimental study of evaporated AuPd nanoparticles.Acknowledgements
We acknowledge support from the Engineering and Physical Science Research Council (EPSRC), COST Action MP0903: “Nanoalloys as Advanced Materials-from Structure to Properties and Applications”, including COST STSM MP0903-240712-021238. The STEM used in this research was obtained through the Birmingham Science City project “Creating and Characterizing Next Generation Advanced Materials” supported by Advantage West Midlands (AWM) and partly funded by the European Regional Development Fund. Calculations have been performed on the University of Birmingham's BlueBEAR high performance computer.39 AB thanks Paul West for helpful discussions and valuable advice.References
- R. Ferrando, J. Jellinek and R. L. Johnston, Chem. Rev., 2008, 168, 845–910 CrossRef.
- V. Ortalan, A. Uzun, B. C. Gates and N. Browning, Nat. Nanotechnol., 2010, 5, 843–847 CrossRef CAS.
- T. Shibata, B. A. Bunker, Z. Zhang, D. Meisel, C. F. Vardeman and J. D. Gezelter, J. Am. Chem. Soc., 2002, 124, 11989–11996 CrossRef CAS.
- J. Huang, T. Akita, J. Faye, T. Fujitani, T. Takei and M. Haruta, Angew. Chem., Int. Ed., 2009, 48, 7862–7866 CrossRef CAS.
- J. K. Edwards, Science, 2009, 323, 1037–1041 CrossRef CAS.
- H. Zhang, T. Watanabe, M. Okumura, M. Haruta and N. Toshima, Nat. Mater., 2012, 11, 49–52 CrossRef.
- A. Naitabi and B. R. Cuenya, Appl. Phys. Lett., 2007, 91, 113110 CrossRef.
- J. Zhang, F. H. B. Lima, M. H. Shao, K. Sasaki, J. X. Wang, J. Hanson and R. R. Adzic, J. Phys. Chem. B, 2005, 109, 22701–22704 CrossRef CAS.
- M. P. Humbert, L. E. Murillo and J. G. Chen, ChemPhysChem, 2008, 9, 1262–1264 CrossRef CAS.
- M. S. Chen, D. Kumar, C. W. Yi and D. W. Goodman, Science, 2005, 310, 291–293 CrossRef CAS.
- J. H. Sinfelt and G. D. Meitzner, Acc. Chem. Res., 1993, 26, 1–6 CrossRef CAS.
- B. R. Cuenya, Thin Solid Films, 2010, 518, 3127–3150 CrossRef CAS.
- N. T. Tran, D. R. Powell and L. F. Dahl, Dalton Trans., 2004, 217–223 RSC.
- R. C. Tiruvalam, J. C. Pritchard, N. Dimitratos, J. A. Lopez-Sanchez, J. K. Edwards, A. F. Carley, G. J. Hutchins and C. J. Kiely, Faraday Discuss., 2011, 152, 63–86 RSC.
- T. Akita, T. Hiroki, S. Tanaka, T. Kojima, M. Kohyama, A. Iwase and F. Hori, Catal. Today, 2008, 131, 90–97 CrossRef CAS.
- D. Ferrer, D. A. Blom, L. F. Allard, S. Mejia, E. P. Tijerina and M. J. Yacaman, J. Mater. Chem., 2008, 18, 2242–2446 RSC.
- L. O. Paz-Borbon, R. L. Johnston, G. Barcaro and A. Fortunelli, J. Chem. Phys., 2008, 128, 134517 CrossRef.
- R. Ferrando, A. Fortunelli and G. Rossi, Phys. Rev. B: Condens. Matter Mater. Phys., 2005, 72, 085449 CrossRef.
- F. Pittaway, L. O. Paz-Borbon, R. L. Johnston, H. Arslan, R. Ferrando, C. Mottet, G. Barcaro and A. Fortunelli, J. Phys. Chem. C, 2009, 113, 9141–9152 CAS.
- J. Jellinek and E. B. Krisinel, Theory of Atomic and Molecular Clusters, Springer, Berlin, 1999 Search PubMed.
- R. L. Johnston, Atomic and Molecular Clusters, Taylor and Francis, London, 2002 Search PubMed.
- L. O. Paz-Borbon, T. V. Mortimer-Jones, R. L. Johnston, A. Posada-Amarillas, G. Barcaro and A. Fortunelli, Phys. Chem. Chem. Phys., 2007, 9, 5202–5208 RSC.
- F. Cleri and V. Rosato, Phys. Rev. B: Condens. Matter Mater. Phys., 1993, 48, 22–32 CrossRef CAS.
- R. Ismail and R. L. Johnston, Phys. Chem. Chem. Phys., 2010, 12, 8607–8619 RSC.
- L. O. Paz-Borbon, R. L. Johnston, G. Barcaro and A. Fortunelli, J. Phys. Chem. C, 2007, 111, 2936–2941 CAS.
- R. L. Johnston, Dalton Trans., 2003, 4193–4207 RSC.
- P. Giannozzi, S. Baroni, N. Bonini, M. Calandra, R. Car, C. Cavazzoni, D. Ceresoli, G. L. Chiarotti, M. Cococcioni, I. Dabo, A. D. Corso, D. De Gironcoli, S. Fabris, G. Fratesi, R. Gebauer, U. Gerstmann, C. Gougoussis, A. Kokalj, M. Lazzeri, L. Martin-Samos, N. Marzari, F. Mauri, R. Mazzarello, S. Paolini, A. Pasquarello, L. Paulatto, C. Sbraccia, S. Scandolo, G. Sclauzero, A. P. Seitsonen, A. Smogunov, P. Umari and R. M. Wentzcovich, J. Phys.: Condens. Matter, 2009, 21, 395502 CrossRef.
- J. P. Perdew, K. Burke and M. Erzenhorf, Phys. Rev. Lett., 1996, 77, 3865 CrossRef CAS.
- A. Rapallo, G. Rossi, R. Ferrando, A. Fortunelli, B. C. Curley, L. D. Lloyd, G. M. Tarbuck and R. L. Johnston, J. Chem. Phys., 2005, 122, 194308 CrossRef.
- J. Doye and D. Wales, J. Phys. Chem. A, 1997, 101, 5111–5116 CrossRef.
- G. Rossi and R. Ferrando, in Nanomaterials: Design and Simulation, ed. P. B. Balbuena and J. M. Seminario, Elsevier, Amsterdam, 2006 Search PubMed.
- G. Schmid, A. Lehnert, J. O. Malm and J. O. Bovin, Angew. Chem., Int. Ed. Engl., 1991, 30, 874–876 CrossRef.
- A. F. Lee, C. J. Baddley, C. Hardacre, R. M. Orneord, R. M. Lambert, G. Schmid and H. West, J. Phys. Chem., 1995, 99, 6096 CrossRef CAS.
- G. Barcaro, A. Fortunelli, M. Polak and L. Rubinovich, Nano Lett., 2011, 11, 1766–1769 CrossRef CAS.
- R. H. Leary and J. P. K. Doye, Phys. Rev. E: Stat. Phys., Plasmas, Fluids, Relat. Interdiscip. Top., 1999, 60, R6320 CrossRef CAS.
- J. P. K. Doye, D. J. Wales, W. Branz and F. Calvo, Phys. Rev. B: Condens. Matter Mater. Phys., 2001, 64, 235409 CrossRef.
- C. Massen, T. V. Mortimer-Jones and R. L. Johnston, J. Chem. Soc., Dalton Trans., 2002, 23, 4375–4388 RSC.
- G. Rossi, R. Ferrando, A. Rapallo, A. Fortunelli, B. C. Curley, L. D. Lloyd and R. L. Johnston, J. Phys. Chem., 2005, 122, 194309 CrossRef.
- http://www.bluebear.bham.ac.uk .
Footnote |
| † Electronic supplementary information (ESI) available. See DOI: 10.1039/c2nr32517a |
| This journal is © The Royal Society of Chemistry 2013 |
