Dual-electrode microfluidic cell for characterizing electrocatalysts†
Ioana
Dumitrescu
,
David F.
Yancey
and
Richard M.
Crooks
*
Department of Chemistry and Biochemistry, Center for Electrochemistry, and the Center for Nano- and Molecular Science and Technology, The University of Texas at Austin, 1 University Station, A5300, Austin, Texas 78712-0165, USA. E-mail: crooks@cm.utexas.edu
First published on 26th January 2012
Abstract
In this paper we introduce a microelectrochemical cell configured for generation-collection experiments and designed primarily for examining the kinetics of electrocatalysts. The heart of the device consists of two, closely spaced, pyrolyzed photoresist microband electrodes enclosed within a microchannel. The cell is suitable for evaluating the efficiency of electrocatalysts under an unprecedented range of conditions. Specifically, compared to the gold-standard rotating ring-disk electrode (RRDE), this device offers four major advantages. First, collection efficiencies of 97% are easily achieved, compared to values of 20–37% that are characteristic of RRDEs. Second, mass transfer coefficients of 0.5 cm s−1 are accessible for typical redox species, which is significantly higher than RRDEs (up to 0.01 cm s−1). Third, we show that the device can operate effectively at temperatures up to 70 °C, which is important for measuring electrochemical kinetics that are relevant to fuel cell catalysts. Finally, much less catalyst and much smaller volumes of electrolyte solution are required to make kinetic measurements using the microelectrochemical device compared to the RRDE. Here, we present the simple procedure used to fabricate the device, fundamental electroanalytical characterization, and electrocatalytic measurements relevant to the oxygen reduction reaction.
Introduction
In this paper we introduce a microelectrochemical cell configured for generation-collection experiments and designed primarily for examining the kinetics of electrocatalysts, specifically, nanoparticles that catalyze the oxygen reduction reaction (ORR). As shown in Fig. 1a, the principal components of the device are a poly(dimethylsiloxane) (PDMS) channel and a pair of closely spaced pyrolyzed photoresist carbon (PPC) microband electrodes. Compared to the more commonly used rotating ring-disk electrode (RRDE) approach for investigating electrocatalysts, this device offers four major advantages. First, collection efficiencies (η) of 97% are easily achieved, compared to values of 20–37% that are characteristic of RRDEs.1 Second, mass transfer coefficients (kt) of 0.5 cm s−1 are accessible for the electrolysis of a typical redox species, which is significantly higher than RRDEs (up to 0.01 cm s−1).2 This means that fast kinetics can be measured with the microelectrochemical device, which would typically require the use of the scanning electrochemical microscope (SECM).3 Third, we show that the device can operate effectively at temperatures up to 70 °C, which is important for measuring electrochemical kinetics that are relevant to fuel cell catalysts.4 Finally, much less catalyst and much smaller volumes of electrolyte solution are required to make kinetic measurements using the microelectrochemical device compared to the RRDE. | ||
| Fig. 1 (a) Schematic representation of the microelectrochemical cell used for the experiments reported here (the dimensions are not to scale). (b) Photograph of the quartz substrate and patterned PPC microband electrodes, leads, and bonding pads (after pyrolysis). The inset is an optical micrograph of the dual-microband electrode region. (c) Raman spectra of PPC and freshly polished and cleaned GC. | ||
Hydrodynamic methods are widely used for enhancing mass transfer in electrochemical systems, serving as a means for expanding detection limits in electroanalysis and the dynamic range for kinetic measurements.5,6 Recently, hydrodynamic methods have undergone a resurgence in popularity as approaches for probing the efficacy of fuel cell electrocatalysts.7,8 Specifically, the development of polyelectrolyte membrane fuel cells (PEMFC) as a useful energy source4,9 has prompted intense interest in electrocatalysts for the ORR.10–12 Particular attention has been given to understanding the correlation between the size, composition, and structure of catalyst nanoparticles and their electrocatalytic performance, which is quantified by the kinetics of the ORR8 and the amount of H2O2 generated.13–16 Furthermore, for applications related to fuel cells, it is often desirable to understand the effects of catalyst loading,17,18 high kt conditions,19–22 and elevated temperatures23–25 (50–80 °C) on catalyst performance.
The method of choice for the study of ORR electrocatalysts has been the RRDE,7,8,13,26 but, as alluded to earlier, it suffers from a number of deficiencies that have motivated the development of other techniques designed to accomplish the same types of measurements. These include the SECM,15,16,27,28 micro-19 and nano-electrodes,20 thin layer devices21 and microfluidic fuel cells.29–31 Although all these methods have certain desirable characteristics, none of them combines all of necessary features (described earlier) required for complete electrocatalyst evaluation. For example, nanoelectrodes20 or microfluidic fuel cells31 lack a collecting electrode for amperometric H2O2 detection. Consequently, the presence of H2O2 can only be evaluated indirectly from the mass-transfer limited current for ORR. In addition, most techniques available, including the SECM, are difficult to implement at higher temperatures.
Channel flow electrochemical devices with embedded dual-electrodes operating in generation-collection mode, similar to the device described here, have been reported previously. For example, several groups have developed theories and numerical simulations relating the device geometry and experimental parameters to the electrochemical signal.32–35 In addition, dual-electrode flow cells have been used successfully for sensitive and selective electrochemical detection,36–40 electrochemical titrations,41–43 mechanistic reaction studies,44 flow rate monitoring,45 and as detection systems for electrophoresis.40,46,47 In spite of this extensive history, the potential of dual-electrode microfluidic cells for studying electrocatalysts has not been investigated.
In the present study, PPC electrodes were used to support catalyst nanoparticles. As discussed later, these types of electrodes have much in common with glassy carbon (GC),48 and because the ORR is kinetically hindered at the surface of GC,48 it does not interfere with the electrochemical signal arising from the immobilized electrocatalyst. The device described here (Fig. 1a) consists of a PDMS microchannel having typical cross-sectional dimensions of 100 μm × 20 μm. Two PPC electrodes, usually 40 μm long, spaced by a 15 μm gap, and spanning the width of the channel, are microfabricated onto a quartz substrate. Solution is pumped through the microchannel at flow rates ranging from 0.05 to 100 μL min−1 (0.04 to 83 cm s−1). This configuration makes it possible to interrogate the electrocatalytic properties of nanoparticles under steady-state conditions.7,8 We demonstrate this function by immobilizing electrocatalysts in the form of dendrimer-encapsulated nanoparticles (DENs), each consisting of ∼147 Pt atoms, onto the generator electrode. Because the design includes a collector electrode, it is also possible to measure the extent of parasitic peroxide generation. We demonstrate that under similar kt conditions, the microelectrochemical device and the RRDE method give similar results for the kinetics of ORR and the effective number of electrons involved in the reaction.
Experimental section
Chemicals
PDMS channels were prepared using a Sylgard 184 elastomer kit obtained from K. R. Anderson, Inc. (Morgan Hill, CA). Quartz microscope slides (25 mm × 75 mm, 1 mm thick) were purchased from Technical Glass Products (Painesville Twp., OH). Positive-tone photoresist (AZ 1518) and developer (AZ 400 K) were purchased from Capitol Scientific, Inc. (Austin, TX). Sixth-generation poly(amidoamine) (PAMAM) dendrimers terminated with hydroxyl groups (G6-OH) were purchased as a 5% (w/w) solution in methanol (Dendritech, Inc., Midland, MI). Prior to use, the methanol was removed under vacuum and the dendrimer was reconstituted in water at a concentration of 100 μM. K2PtCl4 (99.99%), NaBH4 (99.99%), and LiClO4 (99.99%) were purchased from Sigma-Aldrich, Inc.; HClO4 (Ultrex II) was from J. T. Baker and ferrocenemethanol (FcMeOH, 97%) was from Acros Organics. These reagents were used without further purification. Deionized water having a resistivity of 18.2 MΩ cm was used for all experiments (Milli-Q gradient system, Millipore, Bedford, MA).Preparation of PPC electrodes
PPC microband electrodes were fabricated on quartz substrates, previously cut into ca. 25 mm × 38 mm pieces. Photoresist AZ 1518 was spin coated onto quartz substrates at 3500 rpm for 45 s, and then soft baked on a hot plate at 100 °C for 1 min to remove excess solvent. After exposure through a photomask printed with the pattern of interest (CAD/Art Services, Inc., Brandon, OR), the photoresist was developed in AZ 400 K developer, diluted 1/4 (v/v) with deionized water. Quartz substrates with patterned photoresist were pyrolyzed in a quartz tube furnace (model 55035, Lindberg) with a forming gas of 5% H2 and 95% N2 (Praxair, Inc., Danbury, CT) continuously flowing at 100 sccm. The temperature was ramped from 25 °C to 1000 °C at a rate of 5 °C min−1, and then held at 1000 °C for 1 h.49 After pyrolysis, substrates were allowed to cool to 25 °C under constant flow of the forming gas before being exposed to air. PPC microbands were bonded to copper wires via larger bonding pads using conductive silver paste, which was subsequently insulated with epoxy resin. Profilometry (Dektak 6M, Bruker Corporation) results indicated a decrease in the photoresist thickness from 2.0 μm prior to pyrolysis to 300 nm afterward (Fig. S-1a, ESI†).An optical microscope (Nikon AZ 100, Nikon Co., Tokyo, Japan) equipped with a CCD camera (Cascade, Photometrics Ltd., Tucson, AZ) was employed to determine the lateral dimensions of the PPC microbands. Atomic force microscopy (AFM) analysis of the PPC surface was performed in tapping mode using a model 5500 Agilent Technologies AFM. Raman spectra of PPC and GC surfaces were recorded using a Renishaw inVia Raman microscope. Raman shifts were calibrated against the standard Si peak at 521 cm−1. The excitation wavelength was the 514.5 nm line of an Ar laser.
Fabrication of microfluidic devices
As discussed in the Results and Discussion, it was necessary to use PDMS microchannels having different cross-sectional dimensions for different types of experiments. However, unless otherwise noted, the channels were 6 mm long, 100 μm wide and 20 μm high), and in all cases they were prepared using a previously described replica micromolding method.50,51 Two reservoirs (1.0 mm diameter) were punched at the ends of each channel to accommodate introduction of solution. The PDMS layer and quartz substrate were exposed to an air plasma (60 W, model PDC-32G, Harrick Scientific, Ossining, NY) for 45 s and joined together under an optical microscope such that the microchannel was configured perpendicular to the PPC microbands. The entire assembly was then placed over a hot plate, at 80 °C for 5 min, to promote irreversible bonding.52 A syringe pump (Pump 11, Pico Plus Elite, Harvard Apparatus, Holliston, MA), connected to the left reservoir using Teflon tubing, was used to push solution through the PDMS/quartz device.Preparation of Pt DENs
Pt DENs comprised of 147 atoms were prepared by a previously reported procedure.53,54 Briefly, an aqueous solution containing 10.0 μM G6-OH dendrimer and 1.47 mM K2PtCl4 (metal:dendrimer ratio of 147![[thin space (1/6-em)]](https://www.rsc.org/images/entities/char_2009.gif) :1) was stirred for 3 days to ensure Pt2+ complexation to interior tertiary amines of the dendrimer,55 and then aqueous 1.00 M NaBH4 was added to reduce Pt2+. The final concentration of NaBH4 was 20.0 mM. After addition of NaBH4, the solution was kept sealed for 24 h to maximize reduction of Pt2+.55 Finally, the resulting solution of Pt DENs was dialyzed for 24 h using a cellulose dialysis sack having a molecular weight cut-off of 12,000 (Sigma-Aldrich, Inc.) to remove impurities.56 The DENs resulting from this procedure are denoted as G6-OH(Pt147), where the subscript represents the average number of atoms in the nanoparticle. The UV-vis absorption spectrum of G6-OH(Pt147) (Fig. S-2, ESI†) was collected using a Hewlett-Packard HP8453 UV-vis spectrometer and a quartz cuvette having an optical path length of 0.20 cm (Starna Cells, Inc., Atascadero, CA). After dialysis, but prior to immobilization onto PPC and GC electrodes, the DEN solution was added to an appropriate amount LiClO4 to yield a solution containing 0.10 M LiClO4.
:1) was stirred for 3 days to ensure Pt2+ complexation to interior tertiary amines of the dendrimer,55 and then aqueous 1.00 M NaBH4 was added to reduce Pt2+. The final concentration of NaBH4 was 20.0 mM. After addition of NaBH4, the solution was kept sealed for 24 h to maximize reduction of Pt2+.55 Finally, the resulting solution of Pt DENs was dialyzed for 24 h using a cellulose dialysis sack having a molecular weight cut-off of 12,000 (Sigma-Aldrich, Inc.) to remove impurities.56 The DENs resulting from this procedure are denoted as G6-OH(Pt147), where the subscript represents the average number of atoms in the nanoparticle. The UV-vis absorption spectrum of G6-OH(Pt147) (Fig. S-2, ESI†) was collected using a Hewlett-Packard HP8453 UV-vis spectrometer and a quartz cuvette having an optical path length of 0.20 cm (Starna Cells, Inc., Atascadero, CA). After dialysis, but prior to immobilization onto PPC and GC electrodes, the DEN solution was added to an appropriate amount LiClO4 to yield a solution containing 0.10 M LiClO4.
Electrochemistry
The microelectrochemical device was configured in either a two- or a three-electrode arrangement, comprising the PPC microband working electrodes and a Ag/AgCl reference/counter electrode (RE/CE) positioned in the outlet reservoir. All potentials are referenced to Ag/AgCl (3.4 M KCl, model 66-EE009 “no-leak” Ag/AgCl, Dionex, Bannockburn, IL) unless otherwise noted. Cyclic voltammetry (CV), linear scan voltammetry (LSV), and chronoamperometry were carried out using a computer-based bi-potentiostat (Model CHI760B potentiostat, CH Instruments, Austin, TX). A RRDE (E7R9 Series, Pine Instruments, Raleigh, NC), comprising a GC disk (5.61 mm diameter) and a Pt ring, was used to benchmark the microelectrochemical device. The RRDE was prepared by successive polishing with 1.0 and 0.3 μm alumina slurries on a polishing cloth (Buehler), followed by sonication in water for 5 min. Electrochemical experiments were performed in a glass cell using a standard three-electrode configured with a Au wire CE and a Hg/Hg2SO4 RE (CH Instruments, Inc., Austin, TX). CV and rotating disk voltammetry were performed using a computer-controlled Pine Instruments (Grove City, PA) AFRDE4 potentiostat and ASR rotator. All electrochemical experiments were performed at 22 ± 1 °C, unless otherwise stated.Finite element modeling
A 2D model was formulated to treat mass transfer in a microchannel having dual-microband electrodes in a generator-collector configuration (additional details are provided in the ESI†). Modeling was carried out using a commercial finite element method package (COMSOL Multiphysics, version 3.5a).Results and discussion
Surface characterization of PPC electrodes
PPC electrodes were characterized using profilometry, optical microscopy, AFM, and micro-Raman spectroscopy. Fig. 1b is a photograph of the PPC electrodes, leads, and bonding pads with the inset representing an optical micrograph of the generator and collector electrodes. Further details on the physical properties of PPC are provided in the ESI† (Fig. S-1). Fig. 1c provides a comparison of the Raman spectra of PPC and freshly polished GC. Raman spectra were acquired in the 500–2500 cm−1 region, where characteristic tangential modes derived from sp2carbon (G-band, 1500–1600 cm−1) and the sp3 disorder modes (D-band, 1300–1400 cm−1)48 are observed. The ratio of the peak intensities of the D- and G-bands has been correlated with disorder in the graphitic carbon matrix, with higher values indicative of low crystallite sizes and/or the presence of surface oxygenated functionalities.57,58 Interestingly, this ratio is lower for PPC than for GC, indicating lower surface oxygen content in the former.58,59 The lack of native surface oxides makes PPC less prone to adsorption than GC,58 which may negatively impact on the immobilization of catalytic nanoparticles. However, the oxygen-plasma treatment, used for bonding PDMS to the quartz substrate, is known to introduce oxygen-containing surface functionalities onto PPC, thereby increasing its surface energy and encouraging adsorption.60Characterization of the microelectrochemical cell
The microelectrochemical cell used for the studies reported here is shown in Fig. 1a. Solution is introduced into the microchannel via the reservoir on the left using a syringe pump. The PPC microbands are the working electrodes and the Ag/AgCl electrode present in the outlet reservoir acts as a RE/CE. Note that the microbands are positioned ∼200 μm from the edge of the reservoir on the right. This ensures that the effect of the ohmic potential (iR) drop on the voltammetric currents is minimized2 and that there is no electric coupling between the two working electrodes.61 For the currents measured here (on the order of tens of nA) and using electrolyte solutions of 0.10 M KNO3 (with the conductivity, σ = 1.2 Ω−1 m−1)62 calculated iR values are less than 0.5 mV.Fig. 2 presents electrochemical characterization data for the microfluidic cell. These experiments were carried out by recording generation-collection CVs at the PPC microband electrodes, while pumping an aqueous electrolyte solution containing 0.10 mM FcMeOH and 0.10 M KNO3 through the microchannel at different flow rates. The experiments were set up to oxidize FcMeOH at the generator electrode by sweeping its potential from +0.10 to +0.65 V, and simultaneously reduce the resulting ferrocenium methanol (Fc+MeOH) at the collector electrode by holding its potential at 0.00 V. Fig. 2a shows typical generation-collection CVs for FcMeOH at 40 μm long PPC microband electrodes separated by a 15 μm gap. The flow rate in these experiments ranged from 0.05 to 100 μL min−1 (0.04 to 83 cm s−1). Note that, for clarity, the CVs taken at some intermediary flow rates are omitted. However, the full set of CVs is provided in the ESI, Fig. S-3.† At flow rates <0.05 μL min−1 uneven pressure pulses were observed, which resulted in some variation in the steady-state limiting currents. At flow rates >100 μL min−1delamination of the PDMS layer was occasionally observed. Presumably, however, more robust microdevices would allow even higher flow rates, thereby extending the dynamic range of the method. The CVs in Fig. 2a exhibit well-defined sigmoidal shapes, characteristic of steady-state behavior under efficient mass transport conditions.
 | ||
| Fig. 2 Electrochemical characterization of the microelectrochemical cell. (a) Generation (red) - collection (blue) CVs for the oxidation of 0.10 mM FcMeOH in aqueous 0.10 M KNO3, acquired over a flow rate range of 0.05 to 100 μL min−1. The PPC microband electrodes were 40 μm long and separated by a 15 μm gap. The microchannel was 6 mm long, 100 μm wide and 20 μm high. The collector potential was held at 0.00 V (vsAg/AgCl). (b) Plot of ilimvs. the cube root of the volume flow rate. The black data points were determined from the experimental data in (a) and the red line was calculated using the Levich equation (eqn (1)). (c) Plot of η vs volume flow rate. The black data points were calculated using the data in (a), and the red dots and line were obtained using finite element simulations (described in the ESI†). (d) Generation (red) - collection (blue) CVs for 0.20 mM FcMeOH in aqueous 0.10 M KNO3, acquired at a flow rate of 0.01 μL min−1. The microchannel was 6 mm long, 10 μm wide, and just 1.5 μm high. The scan rate for all CVs was 50 mV s−1. | ||
Under laminar flow, and using the Lévêque approximation,5 the steady-state limiting current, ilim, at a band electrode is given by the Levich equation (eqn (1)).63
 | (1) |
It is useful to consider the shape of CVs obtained at different flow rates. The calculated quartile potentials, |E1/4 − E3/4|, for FcMeOH/Fc+MeOH at the generator electrode increases monotonically from 57 mV at flow rates <10 μL min−1 to 68 mV at higher flow rates. According to the Tomeŝ criterion, |E1/4 − E3/4| is a measure of the heterogeneous reaction kinetics (k0) of the electrode reaction, with 56.5/n mV the expected value for a reversible redox reaction.2 Departure from reversibility, observed as a shift in CVs toward higher |E1/4 − E3/4| values, requires that kt become comparable or larger than k0.2 A simple kinetic analysis of the quasi-reversible CV obtained at 100 μL min−1 (kt = 0.122 cm s−1), reveals k0 = 0.19 cm s−1 for the oxidation of FcMeOH at the PPC electrode.66 This value is consistent with the experimentally measured k0 value for ferrocene at GC surfaces (also 0.19 cm s−1).67
The data points in Fig. 2c represent a plot of η versus volume flow rate for the generation-collection CVs presented in Fig. 2a, and the red line is the result of corresponding finite element simulations (additional information about the simulations is provided in the ESI†). The experimental values of η were calculated as the ratio of steady-state, mass-transfer-limited currents at the generator and collector electrodes at each flow rate. For typical microfluidic device dimensions (vide supra), η was in the range 32–40%. These values are higher than typical values of η obtained using commercially available RRDEs (20–37%).1 The experimental data and simulations are consistent, with the exception of η values calculated at flow rates <0.25 μL min−1. This is in agreement with the slight departure from the Levich equation observed for ilim at low flow rates in Fig. 2b.65 The value of η is highest at low flow rates, because as the flow rate increases, some of the Fc+MeOH produced at the generator electrode is swept downstream faster than it can undergo reduction at the collector electrode (Fig. S-4b, ESI†).68
Importantly, numerical simulations indicate that there is a strong dependence between η and the height of the microchannel, h (Fig. S-4c, ESI†). Specifically, as h decreases, diffusional losses are minimized, leading to higher values of η. To test this expectation experimentally, we fabricated microchannels having a value of h more than 10 times smaller than was used to obtain the results shown in Fig. 2a–2c. Fig. 2d shows a typical generator-collector CV for 0.20 mM FcMeOH flowed at 0.01 μL min−1 through a microchannel 1.5 μm high and 10 μM wide. The small hysteresis observed in the current response for FcMeOH oxidation at the generator electrode is due to background capacitance that is more apparent here than in Fig. 2a due to the more sensitive current scale. The capacitive current at the collector electrode is minimal because its potential is constant. The value of η determined from the data in Fig. 2d is 97.1%, which is consistent with the 97.3% value obtained from numerical simulations.
Measurements at elevated temperature and under conditions of high mass transfer
The performance of the dual-electrode microfluidic device was tested at ∼70 °C by recording generation-collection LSVs of FcMeOH. The microelectrochemical cell was placed atop a hotplate, which was used to maintain a temperature of 70 ± 2 °C in the microchannel, as measured by a thermocouple positioned in one of the reservoirs. A solution of 0.10 mM FcMeOH, heated to 70 °C, was then flowed through the microchannel at flow rates ranging from 10 to 75 μL min−1 (8.3 to 63 cm s−1). Fig. 3a displays the resulting steady-state, generation-collection LSVs. The data points in Fig. 3b represent an experimentally determined plot of ilimversus the cube root of volume flow rate, and the solid line is the theoretical fit calculated using the Levich equation (note that the diffusion coefficient for FcMeOH was adjusted for the elevated temperature: D = 21.6 × 10⁻⁶ cm2 s−1 at 70 °C).2 The good agreement between theory and experiment indicate that both the PDMS microchannel and the PPC microbands are sufficiently robust to carry out electrochemical experiments at temperatures relevant to real PEMFCs. | ||
| Fig. 3 (a) Generation (red) - collection (blue) LSVs for the oxidation of 0.10 mM FcMeOH in aqueous 0.10 M KNO3, acquired at 70 °C in a microelectrochemical cell having the same dimensions as in Fig. 2a. The flow rate ranged from 10 to 75 μL min−1. (b) Plot of ilimvs. the cube root of volume flow rate. The black data points were obtained from the experimental data in (a), and the red line was calculated from the Levich equation (eqn (1)). (c) Generation (red) - collection (blue) LSVs for 0.10 M FcMeOH in an aqueous 0.10 M KNO3 electrolyte solution. The PPC microband electrodes were just 5 μm long, and the microchannel was 6 mm long, 50 μm wide, and just 7.5 μm high. The range of flow rates examined was 10 to 75 μL min−1. (d) Plot of ilimvs. the cube root of volume flow rate. The black data points were obtained from the experimental data in (c), and the red line was calculated from the Levich equation (eqn (1)). The scan rate for all LSVs was 50 mV s−1. | ||
Mass transport in the microelectrochemical cell can be controlled over a very wide range. For example, as shown in Fig. 2a, volume flow rates over three orders of magnitude (0.05 to 100 μL min−1) were accessed. However, kt can be controlled over an even greater range by changing the cell height, h, and the electrode length, xe.5 Accordingly, we fabricated microfluidic channels 7.5 μm high and 50 μm wide, and having microband electrodes just 5 μm long. Fig. 3c shows generation-collection LSVs for 0.10 M FcMeOH, recorded over a flow rate range of 1.0 to 50 μL min−1. These volume flow rates correspond to linear velocities ranging from 4.5 to 225 cm s−1, and kt values from 0.14 to 0.51 cm s−1. For comparison, a RRDE would have to be operated at 107 rev min−1, well outside the typical value of ∼103 rev min−1, to attain a kt of 0.51 cm s−1. Note that, even under these high flow rate conditions, the microelectrochemical cell did not leak and could be re-used multiple times.
The data points in Fig. 3d relate ilim to the cube root of volume flow rate, and the line represents the theoretical correlation predicted by eqn (1). The close correspondence between theory and experiment confirm that laminar flow was maintained in the microchannel. However, it should be stressed that the conditions required for high kt measurements, e.g. high volume flow rates and small electrodes, cannot be fulfilled simultaneously with the conditions required for high η values, e.g. shallow microchannels and low flow rates. As such, lower η values, in the range 18–22%, are obtained at high flow rates. More robust cell materials would undoubtedly provide a better balance in this regard, because the limiting factor in the present design is the seal between the PDMS layer and the quartz surface.
Comparison of ORR kinetics measured using the microelectrochemical cell and the RRDE
To demonstrate that the microelectrochemical cell can be used for studying electrocatalysts, we measured the ORR activity of G6-OH(Pt147) DENs and compared the results with those obtained using the RRDE method (GC disk/Pt ring). G6-OH(Pt147) DENs were immobilized on the PPC generator electrode using a previously reported procedure.53,54 Briefly, a 10.0 μM G6-OH(Pt147) solution containing 0.10 M LiClO4 was flowed through the microchannel at 0.05 μL min−1 while the electrode potential was swept three times between +0.10 and +1.00 V. Fig. 4a shows three CVs obtained during electrochemical immobilization of G6-OH(Pt147) onto the PPC generator. The first CV exhibits the characteristic features previously observed during immobilization of Pt DENs onto GC electrodes: an oxidation wave at potentials >0.60 V, tentatively attributed to electrochemical oxidation of the PPC surface, and a decrease in current after the first scan, attributable to the irreversible immobilization of Pt DENs onto PPC after the first scan.53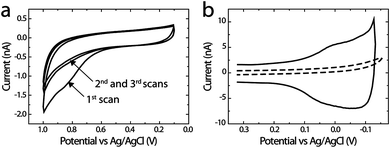 | ||
| Fig. 4 (a) Immobilization of Pt DENs on the PPC generator electrode. Three consecutive CVs were obtained using an aqueous solution containing 10.0 μM G6-OH(Pt147) DENs and 0.10 M LiClO4. The solution flow rate was 0.05 μL min−1 and the scan rate was 10 mV s−1. (b) CVs obtained at the PPC generator electrode before (dashed line) and after (solid line) modification with G6-OH(Pt147). The data were obtained in N2-saturated, aqueous 0.10 M HClO4, and the solution flow rate was 0.05 μL min−1. Prior to electrochemical experiments, the microelectrochemical cell was kept in a N2-purged glove bag for 12 h. The scan rate was 150 mV s−1. | ||
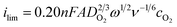
To test the effectiveness of the attachment of G6-OH(Pt147) to the PPC electrode, the total surface area of the Pt DENs was determined after electrochemical immobilization. These experiments were carried out in a N2-containing glove bag to ensure the absence of O2. Fig. 4b shows CVs recorded at the generator PPC electrode, while flowing N2-saturated 0.10 M HClO4 through the microchannel, before and after modification with Pt DENs. After immobilization of the Pt DENs, the capacitance of the electrode increases,53 and the typical hydrogen adsorption and desorption features associated with Pt electrochemistry are observed at potentials <0.20 V.53 The total surface area of G6-OH(Pt147) was determined by measuring the total charge between +0.20 and −0.13 V, and then subtracting the capacitive charge, estimated using the current at +0.20 V. This results in QH, the charge arising from hydrogen atom desorption, which is converted to surface area using the widely accepted conversion factor of 210 μC cm−2.69 It is important to note that this value is only proven for bulk, polycrystalline Pt, and the surface areas estimated for DENs must be considered with this caveat in mind.54 The surface area determined experimentally can be compared to a calculated estimate by making the following assumptions:54 (1) there is one nanoparticle per dendrimer; (2) the nanoparticles are spherical; (3) the projected area of the dendrimer on the electrode surface is 35 nm2; (4) the dendrimers form a close-packed monolayer on the GC electrode; and (5) the average diameter of a Pt nanoparticle in G6-OH(Pt147) is 1.7 nm.54 With this in mind, the total Pt surface area calculated for a 40 μm × 100 μm microband is 1.2 × 10⁻⁵ cm2. The experimentally measured Pt surface area, determined from QH is 4.3 × 10⁻⁵ cm2. Considering the limitations of the assumptions used for the calculation, there is reasonable agreement between measured and calculated values indicating that electrochemical immobilization results in robust attachment of ∼1 monolayer of Pt DENs onto PPC surfaces.
The ORR activity of G6-OH(Pt147) DENs was evaluated using the microelectrochemical cell and the RRDE. To ensure the validity of the comparison, measurements were carried out using similar kt conditions. The microelectrochemical device consisted of 40 μm long electrodes, separated by 15 μm and a microchannel 6 mm long, 100 μm wide and 20 μm high. In both cases, an aqueous, air-saturated 0.10 M HClO4 electrolyte solution was used for the ORR measurements. Under these conditions, the concentration (cO2) and diffusion coefficient (DO2) of O2 are 0.20 mM70 and 1.67 × 10⁻⁵ cm2 s−1, respectively.71 Solution was flowed through the microfluidic device at 0.05 μL min−1 while the RRDE was operated at 1600 rev min−1. Both conditions correspond to kt = 0.01 cm s−1.
Before acquiring ORR generation-collection LSVs, the DEN-modified electrodes were scanned 20 times at 100 mV s−1 between +1.25 V and −0.20 V (vsAg/AgCl) in air-saturated 0.10 M HClO4 solution. These types of conditioning scans are commonplace in the ORR literature,72 and they are required to achieve stable and reproducible LSVs.54 In addition, Pt was electrodeposited onto the PPC collector electrode to increase its efficiency for amperometric H2O2 detection (Fig. S-5, ESI†). Fig. 5a and 5b are generation-collection LSVs for the ORR obtained using the microelectrochemical cell and the RRDE, respectively. To be consistent with the ORR literature,54 the potentials here are given versus the reversible hydrogen electrode (RHE). For both cells, the potential of the generator electrode was swept from +0.10 to +1.00 V (vs RHE) at 20 mV s−1, while holding the potential of the collector electrode at +1.10 V (vsAg/AgCl), where the mass-transfer-limited oxidation of H2O2 occurs (Fig. S-5, ESI†). LSVs acquired using the two methods have similar shapes, indicating comparable ORR activity. The onset of catalytic current is at about +0.70 V (vs RHE), a mass-transfer-limited current is apparent at +0.20 V (vs RHE), followed by a decrease in current at more negative potentials due to competition from hydrogen adsorption. In addition, the calculated quartile potential, |E1/4 − E3/4|, is 177 mV for the microelectrochemical device and 173 mV for the RRDE, indicating similar reaction kinetics with the two methods. The onset of the ORR is accompanied by an increase in the amount of H2O2 oxidized at the collector electrode, indicating that peroxide pathways play a role in the ORR at G6-OH(Pt147).
 | ||
| Fig. 5 Generation (red) - collection (blue) LSVs obtained using (a) the microelectrochemical cell and (b) an RRDE in air-saturated 0.10 M HClO4. The generator and disk electrodes were modified with G6-OH(Pt147) DENs. The potential of the generator and disk electrodes was scanned from +0.10 to +1.00 V (vs RHE) while holding the potential of the platinized collector (ESI†) or Pt ring electrodes at +1.10 V (vsAg/AgCl). The flow rate in the microelectrochemical cell was 0.05 μL min−1, and the RRDE was operated at 1600 rev min−1. Under these conditions, kt = 0.01 cm s−1 for both the microelectrochemical cell and the RRDE. The scan rate was 20 mV s−1. The value of neff calculated from the experimental results in (a) and (b) for (c) the microelectrochemical device and (d) the RRDE. Collection efficiencies were 45% for the microelectrochemical cell and 37% for the RRDE. | ||
The effective electron-transfer number, neff, which reflects the average number of electrons consumed during the reduction of each O2 molecule, was calculated using the ratio of generator and collector currents: neff = 4 − [(2icol)/(ηigen)].73Fig. 5c and 5d show neff as a function of electrode potential for the microelectrochemical cell and the RRDE, respectively. The average values of neff are 3.72 and 3.66, respectively. Using these values for neff, we can calculate the mass-transfer-limited current expected at the generator electrodes. For the microelectrochemical cell, ilim is calculated to be 55.4 nA, using eqn (1) and n = 3.72. This is in excellent agreement with the measured value of 55.9 nA (Fig. 5a). For the RRDE, ilim is calculated using eqn (2).
 | (2) |
Summary and conclusions
We have introduced a microelectrochemical cell consisting of dual PPC microband electrodes enclosed in a PDMS microchannel. Operated in generator-collector mode, this device is suitable for studying electrocatalytic reactions, such as the Pt-DEN-catalyzed reduction of O2 reported here. Under similar kt conditions, the microelectrochemical cell provides kinetic results (k0 and neff) equivalent to those obtained using the gold-standard RRDE approach. In fact, the value of neff determined using the microelectrochemical cell is more consistent with theory than the RRDE value, suggesting more ideal mass-transfer conditions in the former. The microelectrochemical cell offers additional advantages that are not attainable using RRDE methods: collection efficiencies up to 97%, mass-transfer coefficients of up to 0.5 cm s−1, the ability to operate at temperatures relevant to fuel cell applications (e.g., 70 °C), and the opportunity to use much smaller solution volumes and quantities of catalyst.At present, our research is focused on using the microelectrochemical cell described here to better understand electrocatalysis. Specifically, we are examining electrochemical kinetics and product distributions for the ORR as a function of the size, composition, and structure of 1–2 nm-diameter electrocatalysts, as well as catalyst loading density and reaction temperature. As reported here, reliable data are difficult or impossible to obtain using the RRDE under a broad range of important conditions. The results of these experiments will be reported in due course.
Acknowledgements
We gratefully acknowledge financial support from the U.S. Department of Energy, Office of Basic Energy Sciences (Grant No. DE-FG02-09ER16090) and the Department of Defense, Defense Threat Reduction Agency (Contract No. HDTRA1-11-1-0005). The content of the information does not necessarily reflect the position or the policy of the federal government, and no official endorsement should be inferred. Sustained support from the Robert A. Welch Foundation (Grant F-0032) is also acknowledged. We thank Dr Robbyn K. Anand for help with finite element simulations. We also thank Prof. Julie V. Macpherson for helpful discussions regarding this work.References
- Rotating Ring-Disk Electrodes: MT28, MT29, E6 and E7 Series, Pine Instrument Company, Raleigh, NC 27617.
- A. J. Bard and L. R. Faulkner, Electrochemical Methods: Fundamentals and Applications, Wiley, New York, 2000 Search PubMed.
- A. J. Bard and M. V. Mirkin, Scanning Electrochemical Microscopy, Marcel Dekker, Inc., New York, 2001 Search PubMed.
- R. O'Hayre, C. Suk-Won, W. Colella and F. B. Prinz, Fuel Cell Fundamentals, Wiley, New York, 2006 Search PubMed.
- J. A. Cooper and R. G. Compton, Electroanalysis, 1998, 10, 141–155 CrossRef CAS.
- J. V. Macpherson, Electroanalysis, 2000, 12, 1001–1011 CrossRef CAS.
- E. Claude, T. Addou, J.-M. Latour and P. Aldebert, J. Appl. Electrochem., 1998, 28, 57–64 CrossRef CAS.
- S.-J. Lee, S.-I. Pyun, S.-K. Lee and S.-J. L. Kang, Isr. J. Chem., 2008, 48, 215–228 CrossRef CAS.
- P. Costamagna and S. Srinivasan, J. Power Sources, 2001, 102, 242–252 CrossRef CAS.
- J. S. Spendelow and A. Wieckowski, Phys. Chem. Chem. Phys., 2007, 9, 2654–2675 RSC.
- A. A. Gewirth and M. S. Thorum, Inorg. Chem., 2010, 49, 3557–3566 CrossRef CAS.
- Y. Bing, H. Liu, L. Zhang, D. Ghosh and J. Zhang, Chem. Soc. Rev., 2010, 39, 2184–2202 RSC.
- M. Lefèvre and J.-P. Dodelet, Electrochim. Acta, 2003, 48, 2749–2760 CrossRef.
- R. Borup, J. Meyers, B. Pivovar, Y. S. Kim, R. Mukundan, N. Garland, D. Myers, M. Wilson, F. Garzon, D. Wood, P. Zelenay, K. More, K. Stroh, T. Zawodzinski, J. Boncella, J. E. McGrath, M. Inaba, K. Miyatake, M. Hori, K. Ota, Z. Ogumi, S. Miyata, A. Nishikata, Z. Siroma, Y. Uchimoto, K. Yasuda, K.-i. Kimijima and N. Iwashita, Chem. Rev., 2007, 107, 3904–3951 CrossRef CAS.
- Y. Shen, M. Trauble and G. Wittstock, Anal. Chem., 2008, 80, 750–759 CrossRef CAS.
- C. M. Sanchez-Sanchez and A. J. Bard, Anal. Chem., 2009, 81, 8094–8100 CrossRef CAS.
- Y.-H. Shih, G. V. Sagar and S. D. Lin, J. Phys. Chem. C, 2007, 112, 123–130 Search PubMed.
- A. Bonakdarpour, M. Lefèvre, R. Yang, F. Jaouen, T. Dahn, J.-P. Dodelet and J. R. Dahn, Electrochem. Solid-State Lett., 2008, 11, B105–B108 CrossRef CAS.
- D. Pletcher and S. Sotiropoulos, J. Electroanal. Chem., 1993, 356, 109–119 CrossRef CAS.
- S. Chen and A. Kucernak, J. Phys. Chem. B, 2004, 108, 3262–3276 CrossRef CAS.
- A. Schneider, L. Colmenares, Y. E. Seidel, Z. Jusys, B. Wickman, B. Kasemo and R. J. Behm, Phys. Chem. Chem. Phys., 2008, 10, 1931–1943 RSC.
- A. L. Colley, J. V. Macpherson and P. R. Unwin, Electrochem. Commun., 2008, 10, 1334–1336 CrossRef CAS.
- N. Wakabayashi, M. Takeichi, M. Itagaki, H. Uchida and M. Watanabe, J. Electroanal. Chem., 2005, 574, 339–346 CrossRef CAS.
- N. Wakabayashi, M. Takeichi, H. Uchida and M. Watanabe, J. Phys. Chem. B, 2005, 109, 5836–5841 CrossRef CAS.
- H. Yano, T. Akiyama, H. Uchida and M. Watanabe, Energy Environ. Sci., 2010, 3, 1511–1514 CAS.
- L. Geniès, R. Faure and R. Durand, Electrochim. Acta, 1998, 44, 1317–1327 CrossRef.
- J. Fernández and A. J. Bard, Anal. Chem., 2003, 75, 2967–2974 CrossRef.
- J. Fernández, D. A. Walsh and A. J. Bard, J. Am. Chem. Soc., 2004, 127, 357–365 CrossRef.
- R. S. Jayashree, M. Mitchell, D. Natarajan, L. J. Markoski and P. J. A. Kenis, Langmuir, 2007, 23, 6871–6874 CrossRef CAS.
- F. R. Brushett, W.-P. Zhou, R. S. Jayashree and P. J. A. Kenis, J. Electrochem. Soc., 2009, 156, B565–B571 CrossRef CAS.
- F. R. Brushett, H. T. Duong, J. W. D. Ng, R. L. Behrens, A. Wieckowski and P. J. A. Kenis, J. Electrochem. Soc., 2010, 157, B837–B845 CrossRef CAS.
- B. Fosset, C. A. Amatore, J. E. Bartelt, A. C. Michael and R. M. Wightman, Anal. Chem., 1991, 63, 306–314 CrossRef CAS.
- R. G. Compton, B. A. Coles and A. C. Fisher, J. Phys. Chem., 1994, 98, 2441–2445 CrossRef CAS.
- I. A. Arkoub, C. Amatore, C. Sella, L. Thouin and J.-S. Warkocz, J. Phys. Chem. B, 2001, 105, 8694–8703 CrossRef CAS.
- C. Amatore, C. Sella and L. Thouin, J. Phys. Chem. B, 2002, 106, 11565–11571 CrossRef CAS.
- H. Tsai and S. G. Weber, Anal. Chem., 1992, 64, 2897–2903 CrossRef CAS.
- S. A. Brooks and R. T. Kennedy, J. Electroanal. Chem., 1997, 436, 27–34 CrossRef CAS.
- N. S. Lawrence, E. L. Beckett, J. Davis and R. G. Compton, Anal. Biochem., 2002, 303, 1–16 CrossRef CAS.
- E. Sahlin, A. ter Halle, K. Schaefer, J. Horn, M. Then and S. G. Weber, Anal. Chem., 2003, 75, 1031–1036 CrossRef CAS.
- D. J. Fischer, W. R. Vandaveer, R. J. Grigsby and S. M. Lunte, Electroanalysis, 2005, 17, 1153–1159 CrossRef CAS.
- H. Rajantie, J. Strutwolf and D. E. Williams, J. Electroanal. Chem., 2001, 500, 108–120 CrossRef CAS.
- T. R. L. C. Paixão, R. C. Matos and M. Bertotti, Electrochim. Acta, 2003, 48, 691–698 CrossRef.
- I. B. Svir, A. I. Oleinick and R. G. Compton, J. Electroanal. Chem., 2003, 560, 117–126 CrossRef CAS.
- R. G. Compton, B. A. Coles, J. J. Gooding, A. C. Fisher and T. I. Cox, J. Phys. Chem., 1994, 98, 2446–2451 CrossRef CAS.
- C. Amatore, M. Belotti, Y. Chen, E. Roy, C. Sella and L. Thouin, J. Electroanal. Chem., 2004, 573, 333–343 CrossRef CAS.
- M. Castaño-Álvarez, M. T. Fernández-Abedul and A. Costa-García, J. Chromatogr., A, 2006, 1109, 291–299 CrossRef.
- C. Chen, W. Teng and J. H. Hahn, Electrophoresis, 2011, 32, 838–843 CrossRef CAS.
- R. L. McCreery, Chem. Rev., 2008, 108, 2646–2687 CrossRef CAS.
- M. K. Zachek, P. Takmakov, B. Moody, R. M. Wightman and G. S. McCarty, Anal. Chem., 2009, 81, 6258–6265 CrossRef CAS.
- Y. Xia and G. M. Whitesides, Angew. Chem., Int. Ed., 1998, 37, 550–575 CrossRef CAS.
- D. Hlushkou, R. K. Perdue, R. Dhopeshwarkar, R. M. Crooks and U. Tallarek, Lab Chip, 2009, 9, 1903–1913 RSC.
- D. C. Duffy, J. C. McDonald, O. J. A. Schueller and G. M. Whitesides, Anal. Chem., 1998, 70, 4974–4984 CrossRef CAS.
- H. Ye and R. M. Crooks, J. Am. Chem. Soc., 2005, 127, 4930–4934 CrossRef CAS.
- H. Ye, J. A. Crooks and R. M. Crooks, Langmuir, 2007, 23, 11901–11906 CrossRef CAS.
- M. R. Knecht, M. G. Weir, V. S. Myers, W. D. Pyrz, H. Ye, V. Petkov, D. J. Buttrey, A. I. Frenkel and R. M. Crooks, Chem. Mater., 2008, 20, 5218–5228 CrossRef CAS.
- R. W. J. Scott, H. Ye, R. R. Henriquez and R. M. Crooks, Chem. Mater., 2003, 15, 3873–3878 CrossRef CAS.
- Y. Wang, D. C. Alsmeyer and R. L. McCreery, Chem. Mater., 1990, 2, 557–563 CrossRef CAS.
- R. Kostecki, B. Schnyder, D. Alliata, X. Song, K. Kinoshita and R. Kötz, Thin Solid Films, 2001, 396, 36–43 CrossRef CAS.
- S. Ranganathan, R. McCreery, S. M. Majji and M. Madou, J. Electrochem. Soc., 2000, 147, 277–282 CrossRef CAS.
- G. T. Teixidor, R. A. G. III, P. P. Tripathi, G. S. Bisht, M. Kulkarni, T. K. Maiti, T. K. Battacharyya, J. R. Subramaniam, A. Sharma, B. Y. Park and M. Madou, Biomed. Mater., 2008, 3, 034116–034124 CrossRef.
- I. Z. Kiss, N. Munjal and R. S. Martin, Electrochim. Acta, 2009, 55, 395–403 CrossRef CAS.
- W. M. Haynes and D. R. Lide, CRC Handbook of Chemistry and Physics, 91st ed., Internet Version, 2011 Search PubMed.
- V. G. Levich, Physicochemical Hydrodynamics, 2nd ed., Prentice-Hall, Englewood Cliffs, NJ, 1962 Search PubMed.
- J. Guo and S. Amemiya, Anal. Chem., 2005, 77, 2147–2156 CrossRef CAS.
- R. G. Compton, A. C. Fisher, R. G. Wellington, P. J. Dobson and P. A. Leigh, J. Phys. Chem., 1993, 97, 10410–10415 CrossRef CAS.
- M. V. Mirkin and A. J. Bard, Anal. Chem., 1992, 64, 2293–2302 CrossRef CAS.
- C. Bourdillon, C. Demaille, J. Moiroux and J.-M. Saveant, J. Am. Chem. Soc., 1995, 117, 11499–11506 CrossRef CAS.
- K. Ueno, H.-B. Kim and N. Kitamura, Anal. Chem., 2003, 75, 2086–2091 CrossRef CAS.
- T. J. Schmidt, H. A. Gasteiger, G. D. Stab, P. M. Urban, D. M. Kolb and R. J. Behm, J. Electrochem. Soc., 1998, 145, 2354–2358 CrossRef CAS.
- G. A. Truesdale, A. L. Downing and G. F. Lowden, J. Appl. Chem., 1955, 5, 53–62 CrossRef CAS.
- J. Zagal, P. Bindra and E. Yeager, J. Electrochem. Soc., 1980, 127, 1506–1517 CrossRef CAS.
- Y. Garsany, O. A. Baturina, K. E. Swider-Lyons and S. S. Kocha, Anal. Chem., 2010, 82, 6321–6328 CrossRef CAS.
- O. Antoine and R. Durand, J. Appl. Electrochem., 2000, 30, 839–844 CrossRef CAS.
- W. Chen, D. Ny and S. Chen, J. Power Sources, 2010, 195, 412–418 CrossRef CAS.
- J. Luo, P. N. Njoki, Y. Lin, L. Wang and C. J. Zhong, Electrochem. Commun., 2006, 8, 581–587 CrossRef CAS.
Footnote |
| † Electronic supplementary information (ESI) available: Includes profilometry and AFM measurements of the PPC surface; UV-vis absorption spectra of G6-OH(Pt147); generation-collection CVs for FcMeOH obtained using the microelectrochemical cell; a discussion of the model used for finite element simulations; chronoamperometric results for Pt electrodeposition onto the PPC collector electrode, and CVs of H2O2 at the platinized PPC electrode. See DOI: 10.1039/c2lc21181e |
| This journal is © The Royal Society of Chemistry 2012 |