Optimization of sample preparation and a quadrupole ICP-MS measurement protocol for the determination of elemental impurities in pharmaceutical substances in compliance with USP guidelines†
K.
Van Hoecke
a,
C.
Catry
b and
F.
Vanhaecke
*a
aGhent University, Department of Analytical Chemistry, Krijgslaan 281 – S12, B-9000 Ghent, Belgium. E-mail: frank.vanhaecke@ugent.be; karen.vanhoecke@ugent.be
bJanssen Pharmaceutica NV, Turnhoutseweg 30, B-2340 Beerse, Belgium
First published on 3rd August 2012
Abstract
Both new guidelines concerning elemental impurity limit concentrations and novel analytical procedures for elemental analysis of pharmaceutical substances are being adopted by the United States Pharmacopeia (USP). This paper outlines the optimization of two sample preparation procedures for organic pharmaceutical excipient products, one relying on direct dissolution in an aqueous medium and another on microwave-assisted acid digestion. Optimization particularly involved the stabilization and reliable determination of Hg, Pd and Os. Analyte concentrations and spike recoveries were determined in two organic pharmaceutical excipients using a quadrupole ICP-MS instrument equipped with a collision–reaction cell. Aqueous dissolution was achieved with 0.009 mM KBrO3 in 1% (v/v) HNO3 and 1% (v/v) HCl and microwave-assisted acid digestion was performed with aqua regia. Polyatomic interferences originally hampering the accurate determination of 51V, 52Cr, 53Cr, 55Mn, 56Fe and 75As were eliminated through introduction of He/H2 collision–reaction gas at a flow rate of 4.5–5.1 ml min−1 and applying a kinetic energy barrier of 3 V between the hexapole collision–reaction cell and the quadrupole analyzer. Limits of detection were more than a factor of ten lower than the proposed limit concentrations for parenteral administration and the impurity concentrations in the products tested never exceeded the limit concentrations defined by USP. Elemental spike recoveries ranged between 93.8 and 109.9% when standard addition was used for calibration, with relative standard deviations (RSDs) ≤12.7%. It is expected that the proposed procedures can be directly implemented for routine impurity analysis of a broad spectrum of pharmaceutical substances.
Introduction
In our everyday lives, people are exposed to a variety of chemical substances, some of which may be harmful to their health at relatively low exposure concentrations. The use of toxic substances may be banned or restricted by national or international authorities, according to the outcome of substance- and exposure-specific risk assessment. “Heavy metals” have been the subject of elaborate toxicological research, which has led to subsequent efforts to limit human exposure to several toxic metals. Such efforts include the formulation of guidelines stating limit concentrations in consumer products, food and beverages, drinking water and environmental compartments.Already more than a century ago, the United States Pharmacopeia (USP) adopted a guideline for heavy metals in pharmaceutical substances, first published as Procedure 121, Time-limit Test for heavy elements1 and in its revised form currently known as USP Chapter 231, Heavy Elements Test.2 Though updated over time, the currently valid guideline describes an analytical procedure for heavy element determination that is considered obsolete and which does not reach the requirements requested for present and future impurity determination, given the available toxicological knowledge.2 The current procedure is based on a visual comparison between a sample and a lead (Pb) standard, treated identically for the precipitation of metals as sulphides in aqueous solution. It has been proven that the sulphide precipitation procedure provides inaccurate results for several important elements. Additional concerns with respect to the current procedure are, e.g., the subjective visual comparison between the sample and standard, the assumption that the sulphides formed in the sample have optical characteristics that are identical to those of the lead sulphide, the inability to identify and quantify specific heavy elements and the risk of loss of volatile elements. Furthermore, it has been experimentally confirmed that elemental recoveries are far from satisfying.3 More specifically, Lewen et al. (2004) found average recoveries <10% for Se, Sn, Sb, Ru and Hg and recoveries between 30 and 50% for Pb, As, Cd, Mo, Pd, Pt and In. Especially in view of the fact that Pb, As, Cd and Hg are among the most toxic metals, a more reliable standardized analytical procedure is urgently needed.
Recently, USP has published proposals for new general chapters concerning limit concentrations of various elemental impurities and proposed new analytical procedures to accurately determine them at the suggested limit concentrations. The respective documents,4,5 which are currently in the process of revision, are Chapters 232, Elemental Impurities – Limits, and 233, Elemental Impurities – Procedures. For Chapter 232, target elements were selected on the basis of toxicity and limit concentrations were calculated based on permitted daily exposure for a person with a body weight of 50 kg. In Table 1, the selected elements are listed together with the proposed concentration limit for a maximum daily dose of 10 g day−1 and for both parenteral or inhalational and other (oral, dermal, mucosal) administration routes. The iron and zinc limit concentrations listed in Table 1 were taken from the EMEA guideline.6 Chapter 233 contains information on the proposed sample preparation procedure and the experimental design when using inductively coupled plasma-optical emission spectrometry (ICP-OES) or inductively coupled plasma-mass spectrometry (ICP-MS) for sample analysis. Any other analytical procedure may be used as well, provided that compliance with the validation requirements listed in Chapter 233 can be proven.
| Element | Oral component limit μg g−1 | Parenteral component limit μg g−1 | Internal standards | Set A | Set B | ||||
|---|---|---|---|---|---|---|---|---|---|
| Spike μg l−1 | Std. 1 μg l−1 | Std. 2 μg l−1 | Spike μg l−1 | Std. 1 μg l−1 | Std. 2 μg l−1 | ||||
| As | 1.5 | 0.15 | Sc, Y | 1.5 | 0.75 | 3.0 | 1.5 | 0.75 | 3.0 |
| Cd | 0.5 | 0.05 | Y, In | 0.5 | 0.25 | 1.0 | 0.5 | 0.25 | 1.0 |
| Pb | 1 | 0.1 | Re, Tl | 1.0 | 0.5 | 2.0 | 1.0 | 0.5 | 2.0 |
| Hg | 1.5 | 0.15 | Re, Tl | 0.75 | 1.5 | 3.0 | 0.75 | 1.5 | 3.0 |
| V | 25 | 2.5 | Sc, Y | 7.5 | 5 | 10 | 25 | 12.5 | 50 |
| Cr | 25 | 2.5 | Sc, Y | 7.5 | 5 | 10 | 25 | 12.5 | 50 |
| Mn | 250 | 25 | Sc, Y | 7.5 | 5 | 10 | 50 | 25 | 100 |
| Fe | 1300 | 130 | Sc, Y | 15 | 10 | 25 | 50 | 25 | 100 |
| Ni | 25 | 2.5 | Li, Y | 7.5 | 5 | 10 | 25 | 12.5 | 50 |
| Cu | 250 | 25 | Li, Y | 7.5 | 5 | 10 | 50 | 25 | 100 |
| Zn | 1300 | 130 | Li, Y | 15 | 10 | 25 | 100 | 50 | 200 |
| Mo | 25 | 2.5 | Y, In | 7.5 | 5 | 10 | 25 | 12.5 | 50 |
| Ru | 10 | 1 | Y, In | 7.5 | 5 | 10 | 10 | 5 | 20 |
| Rh | 10 | 1 | Y, In | 7.5 | 5 | 10 | 10 | 5 | 20 |
| Pd | 10 | 1 | Y, In | 7.5 | 5 | 10 | 10 | 5 | 20 |
| Os | 10 | 1 | Re, Tl | 7.5 | 5 | 10 | 10 | 5 | 20 |
| Ir | 10 | 1 | Re, Tl | 7.5 | 5 | 10 | 10 | 5 | 20 |
| Pt | 10 | 1 | Re, Tl | 7.5 | 5 | 10 | 10 | 5 | 20 |
Samples may be dissolved in aqueous or organic solvent or may be digested using a closed-vessel digestion procedure with concentrated acids. In order to check the appropriateness of any applied analytical protocol, elemental standards, sample solutions and spiked sample solutions should be prepared and analyzed. Accuracy and precision criteria for quantitative procedures include elemental recoveries between 70% and 150% and ≤20% relative standard deviation (RSD) on six independently prepared spiked samples.
Despite the combination of a detailed description of the analytical procedures in Chapter 233 and the large amount of freedom remaining for the analyst to develop an appropriate procedure that meets the acceptance criteria, the impurity analysis of a particular drug substance using ICP-OES and/or ICP-MS is not always straightforward. More specifically, the selection of a broadly applicable sample preparation procedure that allows quantitative recovery of all restricted elements and the development of a measurement protocol that can detect every element of interest with sufficient sensitivity, thereby avoiding important interferences, requires a systematic approach.
The present study describes the development of two sample preparation procedures, one relying on direct dissolution in an aqueous medium and one on microwave-assisted acid digestion, and the optimization of a set of instrumental parameters for adequate use of a quadrupole-based ICP-MS instrument equipped with a collision–reaction cell. Therefore, several spike recovery experiments were performed in order to finally propose two experimental protocols resulting in quantitative recovery with RSDs ≤ 15% for all USP and EMEA restricted elements.
Materials and methods
Reagents and pharmaceutical substances
Hydrochloric acid (12 M HCl, Fischer A508-P1, Acros Organics, Belgium) and nitric acid (14 M HNO3, Fischer A509-P1, Acros Organics) for trace metal analysis were used throughout this work to prepare solutions. Ultrapure water with a resistivity of 18.2 MΩ cm at 25 °C was obtained using a Milli-Q Direct Q3 system (Millipore, MA, USA). Potassium bromate (puriss. p.a.) was purchased from Sigma Aldrich (Germany). Standard solutions for elemental assay and recovery assessment were prepared by diluting commercially available single element 1 g l−1 stock solutions (Alfa Johnson-Matthey, Germany) in diluted acid. Argon gas (purity > 99.999%) and a He (93%)/H2 (7%) gas mixture (purity 99.995%) were supplied by Air Liquide (Belgium).Two organic products used as excipients in pharmaceutical products were used in this work, i.e. Neosorb 70/70 B (Roquette Frères, France) and Kollidon® 17 PF (BASF, Germany). The former product is a hydrogenated starch hydrolysate that appears as a viscous liquid, while the latter product is a white powder consisting of polyvinylpyrrolidone.
Instrumentation
Throughout this work, a Thermo XSeriesII quadropole-based ICP-MS instrument (Thermo Scientific, Germany), equipped with a collision–reaction cell that can be operated in combination with kinetic energy discrimination in order to overcome spectral interferences caused by polyatomic, doubly charged or isobaric ions, was used. A broadly applicable mixture of helium and hydrogen gas was used as a collision and reaction gas and a kinetic energy barrier of 3 V was consistently adopted in all analyses. Previous experimental work indicated that a kinetic energy barrier of 3 V resulted in the lowest background-to-signal ratios for a given collision–reaction gas flow rate (results not shown). The experimental approach used for the optimization of the CCT gas flow rate and the results obtained can be found in the ESI.† Sample solution was pumped to the nebulizer using a multi-channel peristaltic pump at a flow rate of 0.5 ml min−1. The sample introduction unit consisted of a Meinhard concentric nebulizer (1 ml min−1) and an impact bead spray chamber cooled to 1 °C in a Peltier cooling mould. In each measurement, both the standard operation mode (without collision–reaction gas) and the collision cell technology (CCT) mode were used subsequently, with 30 s equilibration time adopted between both modes to either pressurize or evacuate the collision–reaction cell. Conditions of instrument operation in both measurement modes and data acquisition parameters are summarized in Table 2. Depending on the analytical procedure adopted and sample analyzed, acid types and concentrations used were either 1% (v/v) HNO3, 10% (v/v) HNO3 or one of following mixtures of HCl and HNO3: 6% (v/v) of a 5![[thin space (1/6-em)]](https://www.rsc.org/images/entities/char_2009.gif) :1 HCl:HNO3 mixture, 2% (v/v) of a 1:1 HCl:HNO3 mixture, 10% (v/v) of a 3:1 HCl:HNO3 mixture or 10% (v/v) of a 1:3 HCl:HNO3 mixture.
:1 HCl:HNO3 mixture, 2% (v/v) of a 1:1 HCl:HNO3 mixture, 10% (v/v) of a 3:1 HCl:HNO3 mixture or 10% (v/v) of a 1:3 HCl:HNO3 mixture.
| Standard mode | CCT mode | |
|---|---|---|
| a Optimized daily for good sensitivity (7Li+, 59Co+, 115In+, 238U+) and stability, low oxide (156CeO+/140Ce+) and doubly charged ion (138Ba++/138Ba+) formation. b Optimized for low background (78ArAr+, 80ArAr+, 51ClO+) to signal ratio and low oxide formation (156CeO+/140Ce+). | ||
| Instrumental settings | ||
| RF power (W) | 1200 | 1200 |
| Plasma gas flow rate (l min−1) | 13 | 13 |
| Auxiliary gas flow rate (l min−1) | 0.7 | 0.7 |
| Nebulizer gas flow rate (l min−1) | 0.85–0.90a | 0.85–0.90 |
| Sampling cone and type | Nickel, Xt | Nickel, Xt |
| Skimmer cone and type | Nickel, Xt | Nickel, Xt |
| Extraction lens voltage (V) | −117.6 to −160.8a | −117.6 to −160.8b |
| Pole bias (V) | −4.2 to 0.1a | −17 |
| Hexapole bias (V) | −3.7 to 0.4a | −20 |
| CCT gas flow rate (ml min−1) | n.a. | 4.5 to 5.1b |
| Data acquisition parameters | ||
| Nuclides monitored | 7Li+, 60Ni+, 62Ni+, 63Cu+, 64Zn+, 65Cu+, 66Zn+, 68Zn+, 89Y+, 95Mo+, 98Mo+, 99Ru+, 101Ru+, 103Rh+, 105Pd+, 108Pd+, 111Cd+, 115In+, 187Re+, 189Os+, 191Ir+, 192Os+, 193Ir+, 194Pt+, 195Pt+, 200Hg+, 201Hg+, 202Hg+, 205Tl+, 206Pb+, 207Pb+, 208Pb+ | 45Sc+, 51V+, 52Cr+, 53Cr+, 55Mn+, 56Fe+, 75As+, 89Y+ |
| Scanning mode | Peak jump | Peak jump |
| Dwell time (ms) | 10 | 10 |
| Acquisition points per peak | 1 | 1 |
| Number of sweeps | 100 | 100 |
| Number of readings | 3 | 3 |
| Total acquisition time (s) | 132 | 33 |
As indicated, microwave-assisted acid digestion was performed to aid in sample dissolution, using a Milestone Microwave Labstation MLS-1200 mega (Milestone s.r.l., Italy). Each time, 0.250 g of product was digested in 2.5 ml of concentrated acid, tightly sealed in a 100 ml Teflon vessel inserted into a device-specific sarcophagus. The microwave program consisted of 1 minute heating at 250 W, 1 minute at 0 W, 4 minutes at 250 W, 4 minutes at 400 W, 4 minutes at 600 W and 5 minutes of ventilation. Before unscrewing, the vessels were taken out of the microwave unit and left to cool for several hours.
USP/EMEA elemental recovery studies – method optimization
Two sample preparation procedures – direct dissolution in an aqueous medium and microwave-assisted acid digestion – and subsequent determination of all elements listed in USP draft guideline 232 and EMEA guideline EMEA/CHMP/SWP/4446/2000 were optimized using elemental spike recovery experiments. For each spike recovery experiment, one to three blank solutions, three 10 g l−1 pharmaceutical product solutions, three 10 g l−1 pharmaceutical product solutions spiked with all restricted elements and multi-element standards for calibration were used. Calibration was performed using two external calibration standards prepared in the same medium as the samples and/or using two standard addition standards containing 10 g l−1 product in the same medium as the samples. One calibration standard contained all elements of interest at a concentration lower than their respective proposed limit concentration, while the other was more concentrated than the proposed limit concentration for each element.One hundred-fold concentrated spiking solutions containing all USP and EMEA restricted elements in 5% HNO3 + 1% HCl + 1% HF were freshly prepared before each analysis in order to produce spiked samples and standard solutions through addition of 0.250 ml of spike solution to 25 ml volumetric flasks. Two sets of elemental concentrations were used. Concentrations chosen initially are given in column ‘SET A’ of Table 1. For the final recovery experiments, ‘SET B’ concentrations of Table 1 were used. Except for the least toxic metals, i.e. Cu, Mn, Fe and Zn, the concentrations of spike and standards finally chosen correspond to the elemental impurity limit for parenterally administrated drug components at a component concentration of 10 g l−1. The concentrations of all USP and EMEA elements added to spiked samples and standards are given in Table 1, together with the limit concentrations in drug components for orally and parenterally administrated products.
The 0.250 ml of spike solution for elemental recovery determination was added to the appropriate samples before any sample preparation involving dissolution or digestion was performed. On the other hand, 0.250 ml of standard spike solution for preparation of external calibration or standard addition standards was added at the final step of sample preparation. Samples for direct dissolution in aqueous media were directly dissolved in the complete medium, while microwave-digested samples were quantitatively transferred to 25 ml volumetric flasks, which already contained 2.5 ml of 0.09 mM KBrO3 in 10% (v/v) HCl, and subsequently made up to volume with Milli-Q water.
Optimization of direct dissolution
One product, Neosorb 70/70 B, was used to optimize the sample preparation and analysis protocol using recovery studies. The first recovery study was performed in 1% (v/v) HNO3. Concentrations of spikes and standards are given as ‘SET A’ in Table 1. Samples were analyzed the day after preparation, with only standard addition for calibration.In a second study, two different media were included, i.e. 0.009 mM KBrO3 in 5% HCl + 1% HNO3 and 0.009 mM KBrO3 in 1% HCl + 1% HNO3. The sample sets were prepared in duplicate and one set was analyzed the day after preparation, while the other was analyzed one day later. The concentrations used in spikes and standards are given in column ‘SET B’ in Table 1. Both external calibration and standard addition were applied.
Internal standards Li, Sc, Y, In, Re and Tl were added at a final level of 10 μg l−1. An indication of the internal standards used for each target element is given in Table 1.
The other product, Kollidon® 17 PF, was used in a recovery study performed after dissolution of 0.250 g product in 0.009 mM KBrO3 in the 1% HNO3 + 1% HCl medium in Milli-Q water.
Optimization of microwave-assisted acid digestion and subsequent dilution in Milli-Q water
Microwave-assisted acid digestion of Neosorb 70/70 B was performed in 2.5 ml of concentrated HNO3 and in 2.5 ml of aqua regia. In the case of HNO3, it was checked whether it was necessary to add KBrO3 in HCl to digestion vessels before the microwave program was started in order to stabilize Hg. In the latter case, 0.250 ml of 0.09 mM of KBrO3 in 10% HCl was added.Before transferring digested blanks and samples to volumetric flasks, 2.5 ml of 0.09 mM KBrO3 in 10% HCl was spiked into each volumetric flask. Hence, the final concentrations of KBrO3 and HCl were 0.009 mM and 1%, respectively, in case it was not added into the microwave vessels and 0.010 mM and 1.1%, respectively, in case KBrO3 in HCl solution was also added into the digestion vessels prior to sample digestion.
The Kollidon® 17 PF was digested in a HNO3/HCl (3:1) mixture, as aqua regia could not completely digest the product with the heating program applied.
Internal standards Li, Sc, Y, In, Re and Tl were added at a final level of 10 μg l−1. An indication of the internal standards used for each element is included in Table 1.
Hg memory effect and standard stabilization
First, it was attempted to prevent the notorious Hg memory effects during ICP-MS measurements. Therefore, uptake and rinsing experiments were performed using a 50 μg l−1 Hg solution (uptake) and various rinsing solutions containing an oxidant in the HNO3 or HCl medium. In a first study, 4 media were used as rinsing solution, i.e. 200 μg l−1 KIO3, 200 μg l−1 K2CrO4 and 1% (v/v) H2O2 solutions in 1% HNO3 and finally a solution containing equivalent concentrations (0.46 mM) of KBr and KBrO3 in 10% HCl. A Hg standard was first introduced during 8 minutes and the 202Hg+ signal intensity was measured for 4.5 s at 1, 4 and 8 minutes after introduction. Subsequently, a rinsing solution was introduced for 15 minutes during which the 202Hg+ signal intensity was measured every 30 or 60 seconds.In a second study, the same approach was used with 7 different rinsing solutions in two separate experiments. In the first experiment, the rinsing media included: 5% HCl, 10% HCl, 0.09 mM KBrO3 in 1% HCl and 0.9 mM KBrO3 in 10% HCl. Finally, an uptake and rinse experiment was performed using a 10 μg l−1 Hg standard in 1% HNO3 for uptake during 5 minutes and 0.09 mM KBrO3 in 1% HCl, 0.09 mM KBrO3 + 0.09 mM KBr in 1% HCl and 0.009 mM KBrO3 in 1% HCl solutions for rinsing. During rinsing, the rate of decrease in the 202Hg+ signal intensity was monitored for 12 minutes.
In order to stabilize mercury in samples, Hg should be dissolved in an oxidizing matrix. Standards of 0.75, 3 and 6 μg l−1 Hg were prepared in 1% HNO3, 0.09 mM KBrO3 in 1% HCl and 0.009 mM KBrO3 in 1% HCl and were left to stand for one week. Then, identical standard series were prepared and all solutions, both the fresh and the one week old ones, were measured. Mercury calibration curves in each medium were determined by measuring the standards in the order of 3, 0.75 and 6 μg l−1 Hg. In-between standards, 3 minutes washing with 0.009 mM KBrO3 in 1% HCl was applied. Calibration curves obtained on the basis of old and freshly prepared standards, respectively, were compared.
Measurement
Each day, the instrument performance was optimized in both standard and CCT operating modes. Typical values for optimized instrument settings are given in Table 2. Detector cross-calibration was carried out each day using a multi-element standard containing all analyte and internal standard elements in a concentration of 75 μg l−1. In-between two samples, 1% HNO3 solution was used in initial studies and 1% HNO3 + 1% HCl + 0.009 mM KBrO3 solution in the final studies, to rinse the sample introduction system for three minutes. Data acquisition parameters are also given in Table 2.Data analysis
Each analyte nuclide intensity (counts s−1) was first normalized to intensities obtained for two internal standards in all samples, blanks and standards. Calibration curves were fitted to a linear regression model using the least squares approach. Analyte concentrations in samples and spiked samples were determined versus external calibration curves and/or versus standard addition calibration curves, for which internal standard normalization was performed identically. For each nuclide, analyte concentrations determined using the two normalized intensities were averaged. Elemental recoveries are expressed as percentage. For this purpose, the concentration determined in spiked samples was corrected for the concentration detected in unspiked samples, and subsequently ratioed to the spiked concentration. The reported values present the average recovery for three spiked samples and corresponding standard deviation. The limit of detection (LOD) was calculated as 3.3 times the standard deviation on the mean intensity measured for 6 replicate blank samples, divided by the slope of the external calibration curve. The limit of quantification (LOQ) was calculated at 3.3 times the LOD.Results and discussion
Optimization of Hg determination and standard stabilization
The first experiment carried out to avoid Hg memory effects made use of 200 μg l−1 KIO3, 200 μg l−1 K2CrO4, 1% H2O2 in 1% HNO3 and a mixture of KBr and KBrO3 at 0.46 mM each. All of these oxidizing solutions, except for the KBr/KBrO3 mixture, were unable to remove Hg from the introduction system. The KIO3, K2CrO4 and H2O2 solutions did not result in any improvement in comparison to the 1% HNO3 solution. As a result, 202Hg+ intensities remained high during the rinsing procedure, up to 30 000 counts s−1 after 15 minutes of rinsing, which is obviously unacceptable. The 202Hg+ intensities monitored during uptake and washing are shown in Fig. 1 (panel A). On the other hand, the KBr–KBrO3 mixture at 0.46 mM was able to almost instantly remove all accumulated Hg in the introduction system. Even after 1 minute of rinsing only, the blank signal had already decreased below 1000 counts s−1. However, the 0.46 mM KBr/KBrO3 solution in 10% HCl was thought to be too aggressive for use as an every-day rinsing solution. Therefore, additional similar experiments were performed using more diluted KBr–KBrO3 and KBrO3 solutions in HCl. Similar outcomes were found for 0.09 mM KBr–KBrO3, 0.09 mM KBrO3 and 0.009 mM KBrO3 solutions in 1% HCl, as can be seen from Fig. 1 (panel B). After three minutes of rinsing, the Hg intensity decreased to values below 1000 counts s−1. | ||
| Fig. 1 202Hg+ intensities measured during Hg standard solution uptake and subsequent rinsing with various solutions. | ||
It was expected that Hg standards prepared in a medium that could stabilize Hg would also prevent Hg accumulation in the introduction system during measurement and vice versa.
The KBrO3 solutions in 1% HCl also turned out to be able to stabilize Hg standards of 0.75–6 μg l−1 for at least one week. No difference was observed between standard series prepared in 0.09 mM and 0.009 mM KBrO3 (both in 1% HCl), respectively and between freshly prepared standard series and one week old ones. All standard series are shown in Fig. 2. Clearly, the freshly prepared 1% HNO3 solutions caused memory effects during the analysis, resulting in a non-linear calibration curve and high intensities. On the other hand, the Hg intensity in the old standards was much lower, probably because Hg volatilized out of solution. The large discrepancy between standard series prepared in KBrO3 solutions in 1% HCl and standard series prepared in 1% HNO3 illustrates the need for a medium specifically adjusted for Hg stabilization and measurement.
 | ||
| Fig. 2 Hg standard series of 0.75, 3 and 6 μg l−1 prepared and measured twice in various media. One series was prepared one week prior to the measurements and one series on the same day of the measurements. | ||
Often a BrCl solution, prepared through mixing of KBr and KBrO3 solutions and addition of concentrated HCl is used in the context of Hg determination in environmental samples.7,8 It is a strong oxidizing solution that can break down organomercurials at room temperature and preserve Hg2+ in solution. As discussed above, in this study also a BrCl solution was tested at 0.46 mM, however, though efficient in resolving Hg memory effects, it was thought to be too aggressive for daily introduction into a mass spectrometer. As can be seen in Fig. 2, a more diluted KBrO3 solution was found to fulfill our needs of stabilizing inorganic mercury at the low μg l−1 concentrations, relevant for impurity determination within the context of USP and EMEA guidelines.
Optimization of analysis for samples prepared via direct dissolution in 1% (v/v) HNO3 without and with KBrO3
The first recovery study in 1% HNO3 indicated that none of the restricted elements, except for Mn and Ir, was present at a concentration above the limit of quantification (LOQ). Furthermore, none of the impurities exceeded the limit concentration defined by USP. A concentration of 0.004 μg g−1, close to the LOQ, was found for Mn. All LOQs were at least a factor of 10 lower than the USP/EMEA impurity limits, which shows that a quadrupole-ICP-MS unit equipped with a collision–reaction cell is well suited for impurity determination in pharmaceutical products given the defined limit concentrations. Satisfying recoveries were obtained for most target elements, however, a few important exceptions needed to be further investigated, i.e. Zn (50% recovery) and Pd (84% recovery). Unfortunately, the selected spike concentration for Zn, i.e. 15 μg l−1, was below the element's limit of detection. Therefore, it was expected that better recoveries would be obtained with higher spike concentrations. As the impurity limit for Zn is 130 μg g−1, raising the concentration would not be in conflict with USP guidelines. Although recoveries and standard deviations for Pd isotopes are still within the acceptable ranges suggested by USP, the lower correlation coefficient of the calibration curve (R2 = 0.987) and the low recoveries indicated that a stability issue could be the cause of this anomaly. As explained in the previous paragraph, Hg determination was impossible because of the instability of Hg standards in the 1% HNO3 medium and the appearance of memory effects in the instrument's sample introduction system. Selection of an appropriate medium and rinsing solution for Hg was the subject of the previous paragraph. All numerical values for limits of detection and quantification, concentrations determined in Neosorb 70/70 B, calibration correlation coefficients and elemental recoveries for each nuclide are given in Table ESI-2.†In subsequent recovery experiments, it was tested whether a KBrO3 solution in a diluted HCl + HNO3 mixture was suitable in the context of determination of impurity concentrations in solutions of pharmaceutical products. Correlation coefficients of calibration curves were ≥0.991 for external standards and ≥0.998 for standard addition standards. The sample sets analyzed after 24 h showed satisfying recovery results for all elements. For Pd, around 100% recovery was obtained with a relative standard deviation (RSD) <2%, both in the medium containing 5% HCl and in the medium containing 1% HCl. For Hg, the recovery was overestimated with external standardization, but a value of approximately 100% was obtained with standard addition.
The samples analyzed after 48 h showed a lower recovery for Os in the medium containing 1% HCl, while Pd recovery was still 100% after 48 h. Arsenic recovery was overestimated with external calibration, which was probably due to an enhanced ionization in the Neosorb-containing samples compared to the external standards without an organic matrix. It has been hypothesized that charge transfer reactions can occur between C+-ions and analyte element atoms. This charge transfer reactions only affect analytes with a first ionization potential (IP) lower than carbon itself, like As and Se, although other high IP elements do not show this specific effect.9–11 In general, the standard addition calibration gave more accurate recovery results compared to external calibration. Recoveries and standard deviations on average values (n = 3) determined in media containing 5% HCl and 1% HCl can be found in Table 3 and in Table 4, respectively.
| Nuclide | Analyzed after 24 h | Analyzed after 48 h | ||||||
|---|---|---|---|---|---|---|---|---|
| Ext. std. | Std. add. | Ext. std. | Std. add. | |||||
| Mean% | RSD% | Mean% | RSD% | Mean% | RSD% | Mean% | RSD% | |
| 51V | 101.9 | 1.0 | 102.2 | 1.0 | 97.7 | 0.8 | 99.3 | 0.7 |
| 52Cr | 102.6 | 1.0 | 102.2 | 1.0 | 98.5 | 0.2 | 99.3 | 0.2 |
| 53Cr | 103.1 | 1.2 | 103.2 | 1.2 | 99.4 | 1.0 | 99.9 | 1.0 |
| 55Mn | 104.8 | 1.0 | 104.8 | 1.0 | 101.0 | 1.0 | 101.5 | 1.0 |
| 56Fe | 107.3 | 1.6 | 105.2 | 1.8 | 102.9 | 0.3 | 101.9 | 0.3 |
| 60Ni | 99.9 | 1.0 | 102.0 | 1.1 | 97.9 | 0.4 | 99.2 | 0.4 |
| 62Ni | 100.4 | 1.3 | 101.5 | 1.3 | 97.9 | 0.7 | 99.2 | 0.7 |
| 63Cu | 103.7 | 0.9 | 105.5 | 1.0 | 101.4 | 0.4 | 102.1 | 0.4 |
| 64Zn | 109.3 | 7.3 | 103.5 | 7.8 | 109.0 | 5.7 | 98.4 | 6.4 |
| 65Cu | 104.3 | 1.0 | 105.4 | 1.1 | 101.4 | 0.4 | 102.5 | 0.4 |
| 66Zn | 109.5 | 7.0 | 103.4 | 7.5 | 103.9 | 5.8 | 94.6 | 6.4 |
| 68Zn | 109.9 | 7.0 | 103.1 | 7.5 | 104.0 | 5.7 | 94.5 | 6.3 |
| 75As | 132.5 | 7.2 | 96.5 | 11.5 | 136.1 | 1.8 | 101.2 | 1.8 |
| 95Mo | 99.8 | 1.4 | 100.5 | 1.4 | 99.5 | 0.5 | 99.7 | 0.4 |
| 98Mo | 99.6 | 1.1 | 100.0 | 1.1 | 99.5 | 0.6 | 99.4 | 0.6 |
| 99Ru | 104.3 | 1.2 | 101.7 | 1.3 | 100.5 | 0.5 | 100.6 | 0.5 |
| 101Ru | 105.1 | 1.3 | 101.8 | 1.3 | 100.6 | 0.4 | 100.9 | 0.4 |
| 103Rh | 99.9 | 0.8 | 100.7 | 0.8 | 100.2 | 0.5 | 101.0 | 0.5 |
| 105Pd | 97.6 | 0.9 | 100.9 | 0.9 | 101.1 | 0.4 | 101.4 | 0.4 |
| 108Pd | 96.9 | 1.0 | 100.4 | 1.0 | 101.2 | 0.3 | 101.8 | 0.3 |
| 111Cd | 104.6 | 1.0 | 105.7 | 1.0 | 100.5 | 1.2 | 101.9 | 1.2 |
| 189Os | 101.7 | 1.5 | 99.0 | 1.6 | 80.9 | 0.9 | 100.1 | 0.9 |
| 191Ir | 103.7 | 0.5 | 103.8 | 0.6 | 103.1 | 0.3 | 101.7 | 0.3 |
| 192Os | 102.2 | 1.6 | 98.9 | 1.7 | 80.3 | 1.1 | 100.4 | 1.1 |
| 193Ir | 103.7 | 0.3 | 103.8 | 0.4 | 106.0 | 0.5 | 102.4 | 0.5 |
| 194Pt | 104.0 | 0.5 | 104.6 | 0.5 | 102.4 | 0.5 | 99.3 | 0.7 |
| 195Pt | 104.3 | 0.4 | 104.9 | 0.4 | 102.4 | 0.4 | 101.5 | 0.4 |
| 200Hg | 116.5 | 1.1 | 106.4 | 1.2 | 112.2 | 3.1 | 102.9 | 3.1 |
| 201Hg | 115.7 | 1.3 | 106.1 | 1.4 | 112.5 | 2.3 | 102.8 | 2.3 |
| 202Hg | 117.7 | 1.0 | 107.7 | 1.1 | 112.9 | 2.9 | 103.0 | 2.9 |
| 206Pb | 93.2 | 0.9 | 104.7 | 0.5 | 106.2 | 1.5 | 101.7 | 1.8 |
| 207Pb | 93.7 | 0.7 | 106.1 | 0.7 | 104.1 | 1.9 | 101.9 | 1.9 |
| 208Pb | 94.1 | 0.4 | 105.7 | 0.3 | 103.9 | 1.7 | 102.4 | 1.8 |
| Nuclide | Analyzed after 24 h | Analyzed after 48 h | ||||||
|---|---|---|---|---|---|---|---|---|
| Ext. std. | Std. add. | Ext. std. | Std. add. | |||||
| Mean% | RSD% | Mean% | RSD% | Mean% | RSD% | Mean% | RSD% | |
| 51V | 100.0 | 0.7 | 100.4 | 0.7 | 97.9 | 1.6 | 98.0 | 1.6 |
| 52Cr | 99.8 | 0.2 | 101.4 | 0.2 | 94.8 | 2.2 | 98.8 | 2.0 |
| 53Cr | 100.8 | 1.6 | 101.3 | 1.6 | 93.9 | 1.5 | 99.3 | 1.4 |
| 55Mn | 104.0 | 0.3 | 104.4 | 0.3 | 100.2 | 1.8 | 99.8 | 1.7 |
| 56Fe | 102.5 | 0.6 | 103.4 | 0.6 | 101.1 | 3.0 | 102.2 | 2.9 |
| 60Ni | 97.7 | 0.4 | 99.1 | 0.4 | 83.9 | 0.8 | 99.8 | 0.6 |
| 62Ni | 97.8 | 0.9 | 99.9 | 0.9 | 83.2 | 0.3 | 99.8 | 0.2 |
| 63Cu | 101.8 | 0.5 | 102.7 | 0.5 | 101.8 | 0.4 | 102.7 | 0.4 |
| 64Zn | 98.6 | 14.6 | 104.1 | 14.4 | 106.7 | 4.3 | 107.9 | 4.2 |
| 65Cu | 101.9 | 0.6 | 102.7 | 0.6 | 101.5 | 0.4 | 102.4 | 0.4 |
| 66Zn | 98.4 | 14.7 | 103.7 | 14.4 | 107.7 | 4.1 | 107.8 | 4.1 |
| 68Zn | 98.8 | 15.1 | 104.1 | 14.9 | 107.8 | 4.1 | 107.7 | 4.1 |
| 75As | 122.7 | 4.7 | 104.8 | 5.0 | 125.7 | 1.7 | 98.5 | 1.7 |
| 95Mo | 99.1 | 0.7 | 99.5 | 0.6 | 98.3 | 1.0 | 99.2 | 1.0 |
| 98Mo | 99.7 | 0.8 | 99.2 | 0.8 | 99.7 | 0.8 | 99.3 | 0.8 |
| 99Ru | 125.5 | 0.6 | 99.3 | 0.6 | 165.3 | 0.4 | 100.4 | 0.4 |
| 101Ru | 126.1 | 0.8 | 99.7 | 0.8 | 165.3 | 0.3 | 100.4 | 0.3 |
| 103Rh | 100.2 | 0.6 | 100.0 | 0.6 | 101.5 | 0.4 | 100.4 | 0.4 |
| 105Pd | 99.2 | 0.6 | 99.3 | 0.6 | 100.8 | 0.8 | 101.5 | 0.9 |
| 108Pd | 99.0 | 0.6 | 99.0 | 0.6 | 100.8 | 0.8 | 101.4 | 0.8 |
| 111Cd | 101.3 | 1.6 | 102.2 | 1.6 | 99.3 | 0.8 | 101.2 | 0.8 |
| 189Os | 96.5 | 1.2 | 99.8 | 1.2 | 92.1 | 2.3 | 77.9 | 2.3 |
| 191Ir | 101.0 | 0.9 | 101.5 | 0.9 | 102.4 | 0.5 | 103.4 | 0.5 |
| 192Os | 96.3 | 1.2 | 99.6 | 1.1 | 91.6 | 2.1 | 76.8 | 2.0 |
| 193Ir | 101.5 | 1.0 | 102.0 | 1.0 | 102.6 | 0.6 | 104.2 | 0.6 |
| 194Pt | 101.5 | 0.9 | 102.6 | 0.9 | 102.3 | 0.9 | 103.1 | 0.9 |
| 195Pt | 101.3 | 0.9 | 102.5 | 0.9 | 101.9 | 0.8 | 103.2 | 0.8 |
| 200Hg | 112.7 | 0.8 | 102.6 | 0.9 | 105.1 | 1.4 | 103.3 | 1.4 |
| 201Hg | 114.2 | 0.7 | 105.2 | 0.7 | 103.8 | 1.1 | 102.0 | 1.1 |
| 202Hg | 114.0 | 1.0 | 104.0 | 1.0 | 105.2 | 1.0 | 103.4 | 1.0 |
| 206Pb | 102.2 | 1.3 | 103.4 | 1.3 | 96.4 | 2.4 | 106.0 | 1.9 |
| 207Pb | 101.9 | 1.2 | 103.4 | 1.2 | 94.8 | 2.8 | 106.0 | 2.3 |
| 208Pb | 102.5 | 0.9 | 102.5 | 1.0 | 95.8 | 2.1 | 105.4 | 1.8 |
Optimization of analysis for samples prepared via microwave-assisted acid digestion using concentrated HNO3 and aqua regia
The Neosorb samples were visually completely digested by concentrated HNO3 using the 19 minute microwave digestion program. Correlation coefficients of calibration curves were all ≥0.999. Recovery of all USP and EMEA elements was checked, once with addition of KBrO3 in HCl to digestion vessels before the digestion and once without pre-addition of these Hg stabilizing reagents. Recoveries obtained in these experiments can be found in Table ESI-3 in the ESI.† It turned out that addition of KBrO3 in HCl before microwave digestion was not necessary in order to obtain good Hg recoveries. Furthermore, whether KBrO3 in HCl was added before or only after digestion did not influence the recovery of other elements. Owing to the digestion of the organic matrix, the As recovery (≤109%) is now less overestimated when using external calibration. However, the Pd and Os recoveries, i.e. 74–87% and 490–1030% respectively, were not satisfying after microwave digestion of spiked samples. It was suggested that Pd is not maintained into solution during the microwave digestion and either volatilized or precipitated.The determination of volatile Pd compounds in pharmaceuticals has been the subject of a study by Al-Ammar and Northington (2011).12 In organic solvent, they could accurately determine Pd through conversion of the volatile compounds to non-volatile Pd-thioacetamide complexes. As for our experiments higher Pd concentrations were observed in blank digestions performed after spike recovery experiments, the second hypothesis of precipitation was more likely to explain the low recoveries observed (results not shown). Usually, aqua regia or different acid mixtures are used in the determination of the platinum group metals (PGMs), of which Pd is one, in a variety of samples.13 Therefore, it was expected that addition of concentrated HCl during digestion could aid in improving Pd recoveries.
However, osmium determination was most problematic. Apparently, Os was transformed into a volatile species during microwave digestion, which caused Os memory effects during measurements. Most likely, Os was oxidized to the volatile OsO4. Often, quantitative Os determination involves a procedure of oxidizing distillation and recovery of OsO4 in solution.14 Though, such a procedure is difficult to implement in a routine analysis method for large numbers of pharmaceutical substances. As Os spiked to standard solutions did not undergo the same digestion treatment, normal intensities were found for standard solutions. Interestingly, the Os intensities in standard addition standards were only around half of the intensities in external calibration standards. Consequently, Os recoveries were seriously overestimated by a factor of 5 with external standardization and by a factor of 10 with standard addition. The Os memory effects also erroneously increased 206Pb and 208Pb recoveries, due to intense 190Os16O+, 192Os14N+ and 192Os16O+ interferences. Therefore, the lead recovery calculated using the 207Pb isotope was more reliable. In conclusion, no satisfying results were obtained with concentrated HNO3 for microwave-assisted acid digestion of pharmaceutical products.
Subsequently, it was tested whether aqua regia digested samples would give better recovery results for Pd and Os. From Table 5 it can be seen that this was indeed the case. Now, Pd recoveries were 94% and Os recoveries 107%, which is well contained within the ranges outlined by USP. At the same time, the use of aqua regia did not negatively affect the recoveries of all other elements. Correlation coefficients of calibration curves were ≥0.992. Table 5 also gives determined LODs and LOQs. For Neosorb 70/70 B, not a single element listed as impurity was detected at a concentration higher than its LOQ.
| Nuclide | LOD μg l−1 | LOD μg g−1 | LOQ μg l−1 | LOQ μg g−1 | Ext. std. | Std. add. | ||
|---|---|---|---|---|---|---|---|---|
| Recovery% | RSD% | Recovery% | RSD% | |||||
| 51V | 0.09 | 0.009 | 0.3 | 0.03 | 98.4 | 1.0 | 98.0 | 1.0 |
| 52Cr | 0.09 | 0.009 | 0.3 | 0.03 | 97.1 | 1.0 | 97.0 | 1.0 |
| 53Cr | 0.2 | 0.02 | 0.7 | 0.07 | 96.4 | 2.3 | 95.3 | 2.3 |
| 55Mn | 0.1 | 0.01 | 0.3 | 0.03 | 100.7 | 0.6 | 101.4 | 0.6 |
| 56Fe | 1 | 0.1 | 5 | 0.5 | 95.8 | 1.6 | 98.4 | 1.5 |
| 60Ni | 0.09 | 0.009 | 0.3 | 0.03 | 85.9 | 0.7 | 97.6 | 0.6 |
| 62Ni | 0.3 | 0.03 | 1 | 0.1 | 86.4 | 0.4 | 97.9 | 0.4 |
| 63Cu | 0.07 | 0.007 | 0.2 | 0.02 | 99.9 | 0.5 | 100.1 | 0.5 |
| 64Zn | 0.06 | 0.006 | 0.2 | 0.02 | 92.2 | 13.4 | 99.6 | 12.1 |
| 65Cu | 0.03 | 0.003 | 0.1 | 0.01 | 99.9 | 0.4 | 100.4 | 0.4 |
| 66Zn | 30 | 3 | 100 | 10 | 92.5 | 13.7 | 99.8 | 12.4 |
| 68Zn | 30 | 3 | 100 | 10 | 92.4 | 13.8 | 99.6 | 12.4 |
| 75As | 0.004 | 0.0004 | 0.01 | 0.001 | 116.1 | 1.3 | 94.9 | 1.4 |
| 95Mo | 0.09 | 0.009 | 0.3 | 0.03 | 99.4 | 0.4 | 97.1 | 0.4 |
| 98Mo | 0.08 | 0.008 | 0.3 | 0.03 | 99.0 | 0.5 | 97.3 | 0.5 |
| 99Ru | 0.004 | 0.0004 | 0.01 | 0.001 | 99.8 | 0.6 | 98.3 | 0.6 |
| 101Ru | 0.004 | 0.0004 | 0.01 | 0.001 | 99.7 | 0.4 | 98.4 | 0.4 |
| 103Rh | 0.001 | 0.0001 | 0.002 | 0.0002 | 100.3 | 0.5 | 99.2 | 0.5 |
| 105Pd | 0.1 | 0.01 | 0.5 | 0.05 | 100.4 | 12.5 | 93.8 | 12.7 |
| 108Pd | 0.1 | 0.01 | 0.4 | 0.04 | 100.7 | 12.3 | 94.5 | 12.5 |
| 111Cd | 0.003 | 0.0003 | 0.009 | 0.0009 | 95.6 | 1.3 | 99.1 | 1.3 |
| 189Os | 0.9 | 0.09 | 3 | 0.3 | 104.0 | 3.2 | 107.4 | 3.2 |
| 191Ir | 0.03 | 0.003 | 0.08 | 0.008 | 98.9 | 0.4 | 99.6 | 0.4 |
| 192Os | 0.9 | 0.09 | 3 | 0.3 | 103.7 | 3.3 | 107.3 | 3.3 |
| 193Ir | 0.03 | 0.003 | 0.09 | 0.009 | 98.6 | 0.4 | 99.2 | 0.4 |
| 194Pt | 0.003 | 0.0003 | 0.01 | 0.001 | 97.9 | 0.4 | 99.2 | 0.4 |
| 195Pt | 0.004 | 0.0004 | 0.01 | 0.001 | 97.8 | 0.3 | 99.5 | 0.3 |
| 200Hg | 0.02 | 0.002 | 0.08 | 0.008 | 108.9 | 1.5 | 102.7 | 1.5 |
| 201Hg | 0.05 | 0.005 | 0.2 | 0.02 | 109.5 | 1.3 | 101.9 | 1.2 |
| 202Hg | 0.03 | 0.003 | 0.09 | 0.009 | 109.5 | 1.6 | 101.5 | 1.6 |
| 206Pb | 0.05 | 0.005 | 0.2 | 0.02 | 96.8 | 0.5 | 101.0 | 0.5 |
| 207Pb | 0.05 | 0.005 | 0.2 | 0.02 | 95.9 | 0.8 | 101.2 | 0.8 |
| 208Pb | 0.04 | 0.004 | 0.2 | 0.02 | 96.1 | 0.6 | 100.4 | 0.6 |
Recoveries of USP and EMEA impurities in Kollidon® 17 PF solutions prepared via direct dissolution in 0.009 mM KBrO3 in 1% HNO3 + 1% HCl and via microwave-assisted acid digestion using a concentrated 1![[thin space (1/6-em)]](https://www.rsc.org/images/entities/h3_char_2009.gif) :3 HCl:HNO3 acid mixture
:3 HCl:HNO3 acid mixture
The procedures for direct dissolution and microwave-assisted acid digestion that resulted in approximately 100% recovery for all elements included in this study, were adopted to another pharmaceutical product, Kollidon® 17 PF. Concentrations of impurities analyzed were also very low for this product. A few elements were detected at concentrations slightly above the LOQ, i.e. V, Ni, Cu and Mo at 0.01–0.03 μg g−1 and Ir, Pt and As at 0.002–0.005 μg g−1. For samples analyzed after microwave-assisted acid digestion, all concentrations were below the LOQ.
It turned out that the procedure via direct dissolution gave good recoveries in this case, as can be concluded from Table 6. However, the microwave-assisted acid digestion procedure was not directly applicable to the Kollidon® 17 PF product, as incomplete digestion was observed in 2.5 ml of aqua regia. Therefore, 2.5 ml of a HNO3/HCl (3:1) mixture was used to digest 0.250 g of the product instead. After the microwave program was finished, all samples seemed to be completely digested. However, the 50% overestimation of As recovery with external calibration, raises doubts about complete removal of the organic matrix. Probably, the samples were rather dissolved instead of digested. Unfortunately, due to the lower HCl contents, Os determination was again problematic because of important memory effects during analysis. All correlation coefficients of calibration curves obtained for standard addition were ≥0.998.
:HCl (3:1) mixture
| Nuclide | Impurity concentration | Direct dissolution in 0.009 mM KBrO3 in 1% HNO3 + 1% HCl | Microwave-assisted acid digestion in HNO3:HCl (3:1) |
|||||||||
|---|---|---|---|---|---|---|---|---|---|---|---|---|
| Ext. std. | Std. add | Ext. std. | Std. add. | Ext. std. | Std. add | |||||||
| Conc. μg l−1 | RSD% | Conc. μg l−1 | RSD% | Recovery% | RSD% | Recovery% | RSD% | Recovery% | RSD% | Recovery% | RSD% | |
| 51V | <LOQ | <LOQ | 99.0 | 0.9 | 97.4 | 0.9 | 99.4 | 1.4 | 99.0 | 1.4 | ||
| 52Cr | 0.2 | 1.3 | <LOQ | 99.0 | 0.9 | 97.6 | 0.9 | 97.7 | 1.5 | 97.0 | 1.5 | |
| 53Cr | <LOQ | <LOQ | 97.8 | 1.4 | 97.2 | 1.4 | 98.2 | 1.5 | 96.6 | 1.5 | ||
| 55Mn | <LOQ | <LOQ | 104.0 | 0.9 | 102.2 | 0.9 | 104.0 | 1.8 | 102.4 | 1.8 | ||
| 56Fe | <LOQ | <LOQ | 103.4 | 0.9 | 101.7 | 0.9 | 104.2 | 1.7 | 102.2 | 1.7 | ||
| 60Ni | 0.2 | 1.5 | <LOQ | 96.1 | 0.3 | 97.3 | 0.3 | 93.6 | 0.6 | 96.9 | 0.6 | |
| 62Ni | 0.3 | 0.4 | <LOQ | 97.0 | 0.2 | 97.5 | 0.2 | 93.0 | 0.4 | 96.8 | 0.4 | |
| 63Cu | 0.2 | 3.9 | <LOQ | 100.9 | 0.2 | 101.1 | 0.2 | 97.7 | 0.7 | 100.9 | 0.7 | |
| 64Zn | <LOQ | <LOQ | 96.9 | 5.8 | 102.0 | 5.9 | 98.6 | 5.4 | 94.3 | 6.3 | ||
| 65Cu | 0.2 | 4.3 | <LOQ | 100.5 | 0.2 | 100.7 | 0.2 | 97.6 | 0.8 | 100.9 | 0.8 | |
| 66Zn | <LOQ | <LOQ | 96.6 | 6.0 | 101.9 | 6.0 | 98.3 | 5.4 | 94.2 | 6.3 | ||
| 68Zn | <LOQ | <LOQ | 97.3 | 5.9 | 102.5 | 5.9 | 99.0 | 5.4 | 94.0 | 6.3 | ||
| 75As | <LOQ | 0.02 | 22.2 | 158.2 | 0.9 | 101.6 | 0.9 | 151.1 | 1.5 | 100.8 | 1.5 | |
| 95Mo | 0.13 | 0.74 | <LOQ | 97.4 | 1.2 | 96.6 | 1.2 | 96.3 | 0.7 | 97.0 | 0.7 | |
| 98Mo | 0.14 | 0.3 | <LOQ | 98.4 | 1.1 | 96.7 | 1.1 | 96.7 | 0.5 | 96.9 | 0.5 | |
| 99Ru | <LOQ | <LOQ | 133.3 | 0.1 | 98.4 | 0.1 | 98.2 | 0.4 | 99.9 | 0.4 | ||
| 101Ru | 0.03 | 0.6 | <LOQ | 133.4 | 0.2 | 98.5 | 0.2 | 98.6 | 0.4 | 99.6 | 0.4 | |
| 103Rh | <LOQ | <LOQ | 101.3 | 0.2 | 100.2 | 0.2 | 98.9 | 0.3 | 99.5 | 0.3 | ||
| 105Pd | <LOQ | <LOQ | 99.4 | 0.1 | 99.9 | 0.1 | 99.6 | 0.6 | 100.2 | 0.6 | ||
| 108Pd | <LOQ | <LOQ | 99.9 | 0.2 | 100.1 | 0.2 | 99.6 | 0.9 | 100.2 | 0.9 | ||
| 111Cd | <LOQ | <LOQ | 97.1 | 1.1 | 100.6 | 1.1 | 95.3 | 0.5 | 101.4 | 0.5 | ||
| 189Os | <LOQ | <LOQ | 92.6 | 1.0 | 97.5 | 0.9 | 654.9 | 12.1 | 710.3 | 13.0 | ||
| 191Ir | <LOQ | <LOQ | 97.7 | 0.2 | 99.9 | 0.2 | 91.2 | 0.9 | 99.9 | 0.5 | ||
| 192Os | <LOQ | <LOQ | 92.5 | 0.9 | 97.4 | 0.9 | 674.4 | 12.3 | 731.3 | 13.3 | ||
| 193Ir | <LOQ | 0.02 | 6.8 | 98.1 | 0.3 | 99.9 | 0.3 | 91.1 | 1.0 | 99.4 | 0.6 | |
| 194Pt | <LOQ | 0.05 | 3.3 | 95.8 | 0.2 | 100.7 | 0.2 | 88.6 | 1.1 | 99.6 | 0.4 | |
| 195Pt | <LOQ | <LOQ | 96.1 | 0.1 | 100.4 | 0.1 | 88.7 | 1.2 | 99.5 | 0.4 | ||
| 200Hg | <LOQ | <LOQ | 110.5 | 1.3 | 106.7 | 1.3 | 100.8 | 1.4 | 107.6 | 0.5 | ||
| 201Hg | <LOQ | <LOQ | 109.4 | 0.8 | 106.6 | 0.8 | 100.7 | 3.4 | 106.9 | 2.3 | ||
| 202Hg | <LOQ | <LOQ | 111.1 | 1.4 | 106.8 | 1.4 | 103.4 | 1.9 | 109.9 | 1.0 | ||
| 206Pb | <LOQ | <LOQ | 98.7 | 1.2 | 99.7 | 1.2 | 102.8 | 1.5 | 109.3 | 2.0 | ||
| 207Pb | <LOQ | <LOQ | 99.4 | 0.6 | 100.3 | 0.6 | 94.3 | 1.5 | 100.3 | 1.2 | ||
| 208Pb | <LOQ | <LOQ | 99.2 | 1.0 | 99.8 | 1.0 | 100.9 | 1.4 | 106.8 | 1.9 | ||
It is clear that Os impurity determination will be difficult in products that do not dissolve in water and cannot be digested using aqua regia. As a result, solubility or digestion issues can limit the applicability of the proposed analytical procedures.
Conclusion
Existing EMEA guidelines and suggested USP guidelines that are expected to gain final approval at the end of 2012 and to become effective from May 1st 2014, set lower impurity limit concentrations for pharmaceutical products.15 Therefore, ICP-MS and ICP-OES instrumentation is recommended to determine impurity concentrations. In this work, two procedures for sample preparation, one using direct dissolution in an aqueous medium and another relying on microwave-assisted acid digestion, were developed and instrumental settings were optimized in order to quantitatively recover spiked concentrations of all elements of interest in a single measurement. For all elements, the limits of quantification obtained using a quadrupole ICP-MS instrument equipped with a collision–reaction cell and operated with kinetic energy discrimination are sufficiently low in comparison to their respective limit concentrations. This is illustrated in Fig. 3, which shows the obtained LOQ and USP-defined impurity limit for each element. The CCT mode was applied for V, Cr, Mn, Fe and As by introducing 4.5–5.1 ml min−1 of He/H2 (93%:7%) gas into the collision–reaction cell and adopting a kinetic energy barrier of 3 V.
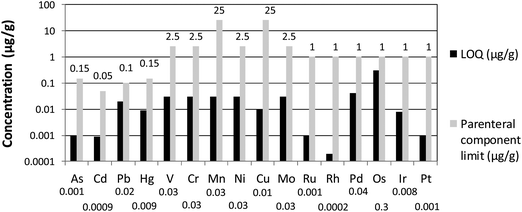 | ||
| Fig. 3 Overview of limits of quantification obtained via microwave-assisted acid digestion with aqua regia and subsequent addition of KBrO3 to a final concentration of 0.009 mM, in comparison to the impurity limit concentrations outlined by USP, all expressed as μg g−1. | ||
In order to stabilize Hg solutions and to prevent memory effects in the sample introduction system, 0.009 mM KBrO3 + 1% HCl needs to be added to all solutions. Samples soluble in an aqueous medium can be directly dissolved in 0.009 mM KBrO3 + 1% HCl + 1% HNO3 in Milli-Q water, whereas for samples subjected to microwave-assisted acid digestion destruction in 2.5 ml of aqua regia, tenfold dilution with Milli-Q water containing 0.009 mM KBrO3 in 1% HCl is recommended. This medium was able to maintain Pd into solution and to prevent Os from causing memory effects in the sample introduction system, whereas other media were not.
Overall, elemental recoveries obtained for one excipient product, Neosorb 70/70 B, ranged between 85.9% and 126.1% when external calibration was used and between 93.8 and 107.4% when standard addition was applied. Relative standard deviations on mean recoveries (n = 3) were ≥0.2% and ≤12.7%. Due to the high LOD, RSDs for Zn were up to 15%.
A second excipient product, Kollidon® 17 PF, resulted in elemental recoveries from 88.6% to 158.2% with external calibration and from 94.0% to 109.9% when standard addition was used for calibration. Relative standard deviations ranged between 0.1 and 6.3%. As the product was not completely digested in aqua regia, a modified acid mixture consisting of HNO3:HCl (3:1) was used for digestion. However, with the latter acid mixture, memory effects observed for Os rendered reliable determination of this element impossible.
With external calibration, the organic sample matrix caused a systematic overestimation of the As recovery, up to 158%. In general, more accurate results and more narrow recovery ranges were obtained with standard addition. However, with exception of As, the recoveries obtained with external calibration were still in agreement with the USP-defined allowable recovery range of 70–150%.
We suggest that the sample preparation and analysis procedures described here are broadly applicable to a wide range of pharmaceutical products. Additional attention might be necessary for Os determination in products that are not soluble in an aqueous medium and which cannot be digested in aqua regia.
Acknowledgements
The authors would like to thank Janssen Pharmaceutica (Beerse, Belgium) for financial support and supply of products.References
- Pharmacopoeia of the United States of America, Procedure 121, Time-limit Test for Heavy Elements, 8th revision, Lippincott, Philadelphia, PA, 1905 Search PubMed.
- The United States Pharmacopeia/The National Formulary USP 32/NF 27, Heavy Elements, The United States Pharmacopeial Convention, Rockville, MD, 2009, ch. 231, pp. 134–136 Search PubMed.
- N. Lewen, S. Mathew, M. Schenkenberger and T. Raglione, A rapid ICP-MS screen for heavy metals in pharmaceutical compounds, J. Pharm. Biomed. Anal., 2004, 35, 739–752 CrossRef CAS.
- The United States Pharmacopeia, Elemental impurities–limits 232, Pharm. Forum, 2011, 37(3) Search PubMed.
- The United States Pharmacopeia, Elemental impurities–procedures 231, Pharm. Forum, 2011, 37(3) Search PubMed.
- European Medicines Agency, Guideline on the Specification Limits for Residues of Metal Catalysts or Metal Reagents, EMEA/CHMP/SWP/4446/2000, London, UK, 2008 Search PubMed.
- O. Szakácss, A. Lasztity and Z. S. Horváth, Breakdown of organic mercury compounds by hydrochloric acid-permanganate or bromine monochloride solution for the determination of mercury by cold-vapour atomic absorption spectrometry, Anal. Chim. Acta, 1980, 121, 219–224 CrossRef.
- N. S. Bloom and E. A. Crecelius, Determination of mercury in seawater at sub-nanogram per liter levels, Mar. Chem., 1983, 14, 49–59 CrossRef CAS.
- P. Allain, L. Jaunault, Y. Mauras, J. M. Mermet and T. Delaporte, Signal enhancement of elements due to the presence of carbon-containing compounds in inductively coupled plasma mass-spectrometry, Anal. Chem., 1991, 63(14), 1497–1498 CrossRef CAS.
- E. H. Larsen and S. Stürup, Carbon-enhanced inductively coupled plasma mass spectrometric detection of arsenic and selenium and its application to arsenic speciation, J. Anal. At. Spectrom., 1994, 9, 1099–1105 RSC.
- F. Vanhaecke, J. Riondato, L. Moens and R. Dams, Non-spectral interferences encountered with a commercially available high resolution ICP mass spectrometer, Fresenius' J. Anal. Chem., 1996, 355(3–4), 397–400 CAS.
- A. S. Al-Ammar and J. Northington, Accuracy improvement in the determination of palladium in pharmaceuticals by eliminating volatility error when using ICP-MS coupled with direct introduction of sample dissolved in organic solvents, J. Anal. At. Spectrom., 2011, 26, 1531–1533 RSC.
- M. Balcerzak, Sample digestion methods for the determination of traces of precious metals by spectrometric techniques, Anal. Sci., 2002, 18, 737–750 CrossRef CAS.
- A. S. Cohen and F. G. Waters, Separation of Os from geological materials by solvent extraction for analysis by thermal ionisation mass spectrometry, Anal. Chim. Acta, 1996, 332, 269–275 CrossRef CAS.
- The United States Pharmacopeia, New Quality Standards Limiting Elemental Impurities in Medicines Announced, Press Release 23rd May, Rockville, Md, 2012 Search PubMed.
Footnote |
| † Electronic supplementary information (ESI) available: See DOI: 10.1039/c2ja30128h |
| This journal is © The Royal Society of Chemistry 2012 |