 Open Access Article
Cancer develops, progresses and responds to therapies through restricted perturbation of the protein–protein interaction network†
Jordi
Serra-Musach
ab,
Helena
Aguilar
a,
Francesco
Iorio
cd,
Francesc
Comellas
e,
Antoni
Berenguer
f,
Joan
Brunet
b,
Julio
Saez-Rodriguez
c and
Miguel Angel
Pujana
*a
aTranslational Research Laboratory, Breast Cancer Unit, Catalan Institute of Oncology (ICO), Bellvitge Institute for Biomedical Research (IDIBELL), Gran via 199, L'Hospitalet del Llobregat, Barcelona 08908, Catalonia, Spain. E-mail: mapujana@iconcologia.net
bICO, IdIBGi, Girona 17007, Catalonia, Spain
cEuropean Bioinformatics Institute (EMBL-EBI), Wellcome Trust Genome Campus, Cambridge CB10 1SD, UK
dCancer Genome Project, Wellcome Trust Sanger Institute, Hinxton CB10 1SA, UK
eDepartment of Applied Mathematics IV, Polytechnic University of Catalonia, Castelldefels, Barcelona 08860, Catalonia, Spain
fBiomarkers and Susceptibility Unit, Biomedical Research Centre Network for Epidemiology and Public Health (CIBERESP), ICO, IDIBELL, L'Hospitalet del Llobregat, Barcelona 08908, Catalonia, Spain
First published on 4th July 2012
Abstract
The products of genes mutated or differentially expressed in cancer tend to occupy central positions within the network of protein–protein interactions, or the interactome network. Integration of different types of gene and protein relationships has considerably increased the understanding of the mechanisms of carcinogenesis, while also enhancing the applicability of expression signatures. In this scenario, however, it remains unknown how cancer develops, progresses and responds to therapies in a potentially controlled manner at the systems level. Here, by applying the concepts of load transfer and cascading failures in power grids, we examine the impact and transmission of cancer-related gene expression changes in the interactome network. Relative to random perturbations, this study reveals topological robustness associated with all cancer conditions. In addition, experimental perturbation of a central cancer node, which consists of over-expression of the α-synuclein (SNCA) protein in MCF7 breast cancer cells, also reveals robustness. Conversely, a search for proteins with an opposite topological impact identifies the autophagy pathway. Mechanistically, the existence of smaller shortest paths among cancer-related proteins appears to be a topological feature that partially contributes to the restricted perturbation of the network. Together, the results of this study suggest that cancer develops, progresses and responds to therapies following controlled, restricted perturbation of the interactome network.
Insight, innovation, integrationThe products of genes differentially expressed in cancer tend to occupy central positions in the network of protein–protein interactions, or the interactome network. It is unknown, however, whether the gene expression changes that characterize cancer are controlled in any way in this network, which might enable the robustness of the disease. To evaluate this, we integrated interactome and expression data from consecutive cancer stages, and from profiles that describe prognostic and predictive differences, and developed an analysis of cascading failures for the transmission of expression changes in the network. This study revealed topological robustness linked to all cancer conditions and, notably, autophagy was identified as an opposite state, which might support its targeting in therapy. |
1. Introduction
Understanding of the genetic determinants of cancer development and progression has been greatly enhanced in recent years. Sets of genes (also called “signatures”) whose differential expression or profiles have prognostic or predictive (in terms of prediction of drug-response) values have been identified for almost every type of cancer.1 In some cases, several signatures have proved to be useful in independent evaluations, although, intriguingly, their overlap in gene identities was minimal.2,3 Then, integrative approaches using different types of gene and protein relationships have demonstrated the existence of biological convergence among apparently disparate gene sets.4–10 Moreover, integrating data from the network of known protein–protein interactions (hereafter “interactome network”) has been shown to improve the reproducibility and accuracy of prognostic signatures.11–14 Together, these studies have considerably improved the mechanistic knowledge and applicability of cancer expression profiles. However, in this scenario, the network topological patterns linked to the dynamic molecular alterations that characterize cancer development and progression, and treatment response, remain unknown. Identifying these patterns or properties, if any, might enhance the systems-level understanding of carcinogenesis and identify potential targeted therapeutic strategies.Cancer develops and progresses through the successive acquisition of genetic and genomic alterations. Downstream of these alterations are expression changes in many genes at each stage of the disease. These expression changes—at least those that participate as “drivers”15—may cause a partial rewiring of complex cellular networks. Ultimately, this rewiring would allow the cancer cell to acquire an unexpected function or cause it to be insensitive to defined inhibitory signals.16 Recently, systems-level studies have revealed molecular rewiring and increased signaling entropy in cancer,17–19 and that genes linked to driver modules have robust predictive power.14 Here, we hypothesized that the features of dynamism and robustness intrinsic to cancer should also be present at different biological levels and, in particular, evident within the topology of the interactome network. To assess this hypothesis we analyzed the impact of cancer-related expression changes—including cancer development, progression, response to treatments, and targeted perturbation—in the interactome network using the concept of “cascading failures”.20 A similar concept was previously applied to the study of metabolic networks, which revealed robustness.21 Here, the network topological impact of protein expression changes that characterize different cancer conditions is modeled in an analogous way to the trigger of cascading failures in power grids. The results of these analyses associate robustness with cancer and identify autophagy as an opposite condition.
2. Materials and methods
2.1 The interactome network
Release #7 of the Human Protein Reference Database (HPRD),22 which contains 9461 proteins and 37![[thin space (1/6-em)]](https://www.rsc.org/images/entities/char_2009.gif) 081 interactions, and release 09/29/2011 of the IntAct database,23 which contains 8292 proteins and 33794 interactions, were used to build the interactome networks. Thus, the interactome sets were mostly represented by experimentally demonstrated interactions compiled through literature curation. The corresponding main components were used for subsequent analyses, excluding proteins with no assigned Entrez identifier and homodimers.
081 interactions, and release 09/29/2011 of the IntAct database,23 which contains 8292 proteins and 33794 interactions, were used to build the interactome networks. Thus, the interactome sets were mostly represented by experimentally demonstrated interactions compiled through literature curation. The corresponding main components were used for subsequent analyses, excluding proteins with no assigned Entrez identifier and homodimers.
2.2 Gene expression data
Raw breast cancer expression data were downloaded from the Gene Expression Omnibus references GSE16873 (normal breast tissue (N) and atypical ductal hyperplasia (ADH) comparison24), GSE14548 (N and ductal carcinoma in situ (DCIS) comparison25), GSE3744 (N and invasive ductal carcinoma (IDC) comparison26), GSE3893 (DCI and IDC comparison27), GSE2741 (IDC and metastasis (M) comparison28), and GSE7327 (MCF7 xenografts29). Data were normalized and the significance analysis of microarrays (SAM) algorithm30 was used to identify differentially expressed probes at a ≤5% false discovery rate (FDR).31 Raw colorectal cancer expression data were downloaded from the GSE4183 reference32 and differentially expressed probes identified by a >|2-fold| expression change. Data from the study of MCF7-SNCA versus parental MCF7 cells were similarly processed and analyzed, and have been deposited at GSE31180. Gene expression differences were evaluated for all microarray probes (without collapsing them per gene name) and the extreme difference was selected for subsequent analyses (randomly chosen gene sets were similarly processed). The Gene Set Enrichment Analysis (GSEA) tool was used with default values for all parameters.332.3 SNCA cloning and expression
A full-length open reading frame of SNCA was obtained through reverse transcription polymerase chain reactions using cDNAs derived from healthy lymphocytes and subsequently cloned into the Gateway pDONR201 (Invitrogen) vector. The clone was 5′-sequenced so that the SNCA sequence was confirmed and did not show changes relative to publicly available sequence information. The SNCA sequence was then transferred to the pcDNA ™6.2/N-EmGFP-DEST (Invitrogen) vector for expression and blasticidin-based selection in MCF7 cells. Two clones of MCF7-SNCA were then isolated through minimal dilution of cells. As controls, parental MCF7 cells were transfected with an empty pcDNA ™6.2/N-EmGFP-DEST (Invitrogen) vector and two clones selected as described above. Cells were routinely cultured and maintained in Roswell Park Memorial Institute medium containing 10% fetal bovine serum and 2 mM glutamine. Western blots were performed following standard protocols. SNCA expression was detected with the Ab-1 (123–140) antibody (Calbiochem) and TUBA (α-tubulin) expression with the DM1A + DM1B antibody (Abcam). RNA samples were double-extracted using TRIzol Reagent (Invitrogen) and QIAGEN RNeasy (QIAGEN), and quality evaluated in Agilent Bioanalyzer 2100. RNAs were amplified using the Ribo-SPIA system (NuGEN Technologies) and subsequently hybridized on the microarray platform Affymetrix U133 Plus 2.0.2.4 Cascading failures enrichment analysis
With V the complete set of nodes in the main component of the interactome network, B ⊂ V, j ∈ V\B, α and tj be fixed parameters, the number of failures on B caused by j is noted asand the normalized value as
Next, with A another subset of nodes, the failure coefficient of set A on B is defined as follows:

If B = V, the coefficient reflects failures on the main component of the network, being computed as follows:

Therefore, the failure coefficient shows the proportion of nodes that have failed relative to the total nodes in the main network component and ranges from 0 (all nodes failed) to 1 (none failed). To identify nodes that cause more failures than randomly expected, let Xto be the number of total failures for t = to and P(Xt ≥ x|k) the probability of causing ≥x failures, we compute P(Xtmax ≥ xtmax|k) where t = tmax represents the maximum difference between the observed and randomly generated values. The cluster coefficient was calculated as described elsewhere and randomly chosen nodes were adjusted by selecting values within six windows (0.00 – <0.01; 0.01 – <0.10; 0.10 – <0.20; 0.20 – < 0.40; 0.40 – < 0.99; and 0.99 – ≤ 1.00).

3. Results
3.1 Analysis of cascading failures in the interactome network
Gene expression differences that characterize the consecutive stages of breast cancer development and progression were integrated into the interactome network (Fig. 1 and File S1, ESI†). Two interactome datasets were examined in this study, one corresponding to the HPRD22 and the other to the IntAct database.23 With this framework, an analysis of cascading failures20 was applied to examine the topological network dynamics and robustness. In this analytical framework, the initial load Li of a given node j (i.e. protein j in the interactome network) is defined as a function of the product of its degree kj (i.e. number of interactors of j) and the sum of the degrees of its neighbors, Γj:Therefore, the load function includes a tunable parameter α ∈

![[Doublestruck R]](https://www.rsc.org/images/entities/char_e175.gif) with which the relationship between load and degree can be modified. Thus, for small values of α the relationship between Lj and kj is roughly concave (i.e. line segments lie below the curve) monotone increasing, while for α values of around 0.6 it is near linear, and for α values close to 1.0 it is roughly convex monotone increasing (Fig. 2).
with which the relationship between load and degree can be modified. Thus, for small values of α the relationship between Lj and kj is roughly concave (i.e. line segments lie below the curve) monotone increasing, while for α values of around 0.6 it is near linear, and for α values close to 1.0 it is roughly convex monotone increasing (Fig. 2).
 | ||
| Fig. 1 Strategy for studying the interactome network topology associated with cancer. Differentially expressed genes at consecutive stages of breast cancer are integrated into the interactome network and subsequently examined for their associated topological patterns. In this framework, the link to cancer prognostic and predictive profiles, and to a targeted node perturbation, is also evaluated. | ||
 | ||
| Fig. 2 Relationship between node load and degree. The graphs show the relationship between load (Lj) and degree (kj) for different values of α (0.1, 0.6 and 1.0) and for all nodes in the main component of the interactome network. | ||
Next, the concept of node capacity is used to examine failures: thus, the capacity of node i (Ci) is defined as the maximum load it can handle prior to failure. At this point we introduce a novel parameter based on the rank of expression values for each gene. We assume that a gene with a broader expression rank (i.e. a gene showing relatively low and high expression values across samples) should represent a node with a higher capacity. In other words, assuming a direct correlation between the gene and the corresponding protein expression, if the expression of a given gene varies considerably across samples we infer that the cell tolerates higher variability of the corresponding protein level prior to transferring its associated biological information to its interaction partners. While expression variability may also reflect different cell type contents across samples, the results of this study represent the analysis of several datasets across diverse cancer conditions, protein sets, and controls (detailed in subsequent sections). Thus, on the basis of the assumptions described above, node capacity is defined as follows:
| Ci = tiLi |
| ti = 1 + τri |
and ri is the expression rank of gene i and computed as:where maxP∈

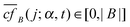
![[scr P, script letter P]](https://www.rsc.org/images/entities/char_e52f.gif) i (RP) is the maximum difference between the maximum and the minimum expression values (RP) of the probe set P of gene i, and maxP∈ (RP) the maximum difference among all genes examined in a given microarray platform and dataset (using normal cancer samples). The ri and kj values were weakly correlated in the expression datasets used in this study: Kendall's τ coefficients ranging from 0.03 to 0.09 (Fig. 3a illustrates the relationship between ri and kj, and the distribution of values of ri in a given dataset). The interaction partners tend to share similar expression ranks (empirical p < 0.05, Fig. 3b), which is expected based on the well-known associations with analogous genetic, molecular or functional relationships.34,35
i (RP) is the maximum difference between the maximum and the minimum expression values (RP) of the probe set P of gene i, and maxP∈ (RP) the maximum difference among all genes examined in a given microarray platform and dataset (using normal cancer samples). The ri and kj values were weakly correlated in the expression datasets used in this study: Kendall's τ coefficients ranging from 0.03 to 0.09 (Fig. 3a illustrates the relationship between ri and kj, and the distribution of values of ri in a given dataset). The interaction partners tend to share similar expression ranks (empirical p < 0.05, Fig. 3b), which is expected based on the well-known associations with analogous genetic, molecular or functional relationships.34,35
 | ||
| Fig. 3 Relationship between node expression rank and degree. (A) Left panel, relationship between expression rank (ri) and degree (kj) for all nodes in the main component of the interactome network. The results correspond to the N-IDC transition and are representative of all cancer stages. Right panel, distribution of the number of genes across the values of ri in the same dataset. (B) Having divided ri into tertiles (low, medium and high), random permutations of protein names (keeping the original degree distribution) reveals significant (empirical p < 0.05) enrichment for similar expression ranks among interacting proteins (observed). | ||
Next, the load increase of node i due to failure of a first-degree neighbor j is computed as follows:

| Li + ΔLij |
In summary, using these rules and a defined set of nodes (in our case, proteins encoded by differentially expressed genes during a given cancer transition or in response to a treatment or a perturbation) the network topological study examines the patterns and enrichments of cascading failures. Importantly, note that failures are computed when each node is selected individually (not simultaneously with other nodes) and, therefore, there is no influence on the results of the path length between cancer-related nodes.
Together, the study includes four main steps: (1) a defined cancer-related protein set is identified in the interactome network; (2) for each selected protein or node, a precomputed load is proportionally transferred to its first-degree neighbors; (3) a neighbor may fail if its increase in load is higher than its capacity, which in turn depends on the corresponding gene expression rank in a given dataset (note that by this step cancer proteins have been identified and their load transferred to their interaction partners, so their capacity is not influencing the results); and (4) cascading failures may occur until a steady-state is reached. Thus, analogously to the concepts of electricity load, capacity limit and cascading failures in power grids, this study examines the impact and transmission of cancer-related alterations (e.g. gene expression changes in cancer relative to normal cells) in the interactome network. In this framework, if the expression change of a given gene exceeds a threshold (i.e. capacity, which depends on parameters of the gene expression rank and the number of protein interactions), we assume that the corresponding network node fails and transfers biological information to its neighbors. This transfer is then propagated through the network (i.e. cascading failures) until no other node fails (i.e. their load increase does not exceed their capacity). In this scenario, topological robustness is revealed when fewer node failures are observed than random perturbations.
The results are initially presented for three values of α according to the observed consequences of selecting nodes with the lowest and the highest load values: top left panel of Fig. 4a illustrates the relationship between a “failure coefficient”—which represents the proportion of nodes that have failed relative to the total nodes in the main component of the interactome network, see Methods—and the parameter α, using the N-DCIS expression dataset (similar results were obtained using other datasets, not shown). Nodes with low load confer network fragility at low values of α (as in this setting they have a relatively higher load, see also Fig. 2), while nodes with high load confer network fragility at relatively high values of α. The three remaining panels of Fig. 4a illustrate the relationship between the failure coefficient and the parameter τ for the three selected values of α. The exact relationship between the load and the parameter α was then computed for each expression dataset by including information on the gene expression ranks. On the other hand, Fig. 4b shows the relationship between the maximum number of iterations of the model relative to τ necessary to reach a steady state (in which no additional failures occur); for example, for all nodes in the main network component and with τ = 1, the maximum number of iterations required to reach the steady state is approximately 30.
 | ||
| Fig. 4 Relationship between node load and the parameter α. (A) Top left panel, proportion of failures across different values of α and for two sets of proteins (n = 100 each), corresponding to the lowest and the highest load (L) values. Maximum differences are observed for α ≅ 0.1 and 1.1, while almost no difference is observed for α ≅ 0.5. The remaining panels show the pattern of failures across τ and for α = 0.1, 0.5 and 1.1. (B) Having altered each node in the main component of the interactome network, the graph shows the maximum number of iterations of the model relative to τ necessary to reach the steady state (in which no additional failures occur). | ||
3.2 Protein sets linked to cancer reveal topological robustness
To date, the impact or topological features, if any, in the interactome network of the expression changes that characterize cancer has remained unknown. To address this question, for each set of differentially expressed genes across breast cancer stages (File S1, ESI†), we applied a network analysis as defined above and examined the number of node failures relative to random. As random, 500 equivalent sets (i.e. sets with an identical number of nodes and, because of a known degree bias of cancer-associated proteins,36–38 case-paired for node degree and local cluster coefficient values) of randomly chosen nodes were used. Thus, the sets of proteins that characterize different cancer conditions tend to cause a lower number of failures than randomly expected (empirical p < 0.05); Fig. 5a shows results using the HPRD dataset, but similar conclusions were obtained using the IntAct dataset (File S2, ESI†). The results were also similar for different values of α, which suggests that this parameter does not have a major influence on the conclusions. Without the adjustment of the random sets for degree and local cluster coefficient values, significant (empirical p < 0.05) differences were also observed, although with a lower magnitude (Fig. 5b). Additionally, the removal of overlapping proteins between sets that define cancer stages showed similar results (not shown). Finally, the observation of strong differences in N-DCIS and N-IDC relative to random, despite noise in DCI-IDC and IDC-M, may simply reflect disparities in the size of the corresponding protein sets (File S1, ESI†). | ||
| Fig. 5 Protein sets linked to cancer reveal topological robustness in the interactome network. (A) For different values of α as defined above, the HPRD dataset, and the protein sets that define cancer development and progression, the graphs show the number of failures (random – observed) across τ. Black or colored lines (for under- and over-expressed sub-sets) indicate significant differences relative to random (empirical p < 0.05). (B) Same conditions but the random sets were only adjusted for their equivalent size to the test set, not for their degree distribution. (C) Left panel, frequency of failures across shortest path intervals in a given cancer condition (N-IDC, similar patterns were observed for all cancer protein sets, not shown). Right panel, distribution of neighbors across shortest path intervals for all nodes in the main component (present/absent and proportion of neighbors). | ||
Since topological robustness might be linked to any functionally coherent protein set and may not necessarily be a specific feature of cancer conditions, the consequences of altering each of the Kyoto Encyclopedia of Genes and Genomes (KEGG)39 annotated pathways were evaluated. While many (if not all) pathways can be associated with carcinogenesis through evidence from the literature, most of the KEGG sets did not show similar topological robustness to the cancer sets (File S3, ESI† shows results for 136 KEGG sets using an intermediate α value and the N-IDC comparison). On the other hand, 35 KEGG sets revealed a similar pattern to the cancer sets; nonetheless, all of these sets represented pathways that can be clearly linked to carcinogenesis, with “Cell Cycle” and “MAPK signaling pathway” showing the strongest differences relative to random (File S4, ESI†). The 136 sets that showed a dissimilar pattern to the cancer sets included those involved in metabolism and biosynthesis, as well as pathways inversely related to carcinogenesis: in particular, several sets linked to the immune response.40 Analysis of protein sets corresponding to the Gene Ontology term annotations “Immune Response” and “Intracellular Protein Kinase Cascade” showed similar results to those obtained for the KEGG sets (File S4, ESI†). Finally, to assess the impact of functionally coherent protein sets related to cancer conditions, all known kinases were subdivided according to whether they were differentially expressed in a given cancer transition (N-IDC), and then failures examined as above. Both sets (i.e. differentially and non-differentially expressed kinases) caused fewer failures than randomly expected (File S5, ESI†), which, together with the results from the KEGG sets, suggests that the observed topological robustness is a common feature of proteins linked to cancer, not only through expression changes.
To further evaluate the network topological robustness associated with cancer, another tumorigenic process was examined. Differentially expressed genes between normal colorectal tissue and adenomas, and carcinomas, were identified using a public dataset,32 their products selected and the node failures examined as defined above. Thus, protein sets that characterize colorectal cancer conditions also suggested topological robustness (File S6, ESI†). These results are consistent with those of the breast cancer, KEGG and kinases sets and, overall, support the hypothesis that cancer associates with topological robustness in the interactome network.
3.3 Cancer progression is associated with topological robustness
Complementary to computing failures in the global network, we investigated the dynamic pattern of failures across the neighbors (defined by shortest path intervals) of the cancer-related nodes. The cancer proteins showed a lower impact at almost all intervals, with ∼50% of nodes deactivated at the first-degree neighbors (Fig. 5c, left panel shows results for a representative case). Thus, the proportion of failures followed a near-uniform distribution until 9–11 intervals, at which point it dropped sharply and the difference with the random sets was reduced (Fig. 5c, left panel). This pattern is probably explained by the presence/absence and proportion of neighbors across intervals (Fig. 5c, right panel).Having established the dynamic impact of cancer proteins in the global interactome network, we next examined the relationship between each of the sets according to the order of cancer development and progression. Thus, the set of proteins representing differentially expressed genes at the N-ADH transition was identified and cascading failures were examined at each subsequent stage. Using random sets adjusted by size and node degree distributions (adjustment by cluster coefficient values had minimal influence on the results, not shown), the results of these analyses indicated that cancer proteins also tend to be robust to the initial molecular alteration; that is, both under- and over-expressed cancer proteins during cancer progression were usually deactivated less than randomly expected (Fig. 6a shows results for randomization of the N-ADH set, top panels, and the target sets, bottom panels; Fig. 6b shows results using random sets of equivalent size to the target set but unselected for their degree distribution). Strong differences were also revealed at the later stages of cancer progression (e.g. DCI-IDC, Fig. 6a), which, given that no differences were previously observed (Fig. 5a), further suggests the existence of a topological link across stages.
 | ||
| Fig. 6 Protein sets linked to cancer development and progression reveal topological robustness in the interactome network. (A) For an intermediate α (α ≅ 0.5; similar results were obtained with other values, not shown), the HPRD dataset, and the protein sets that define cancer stages subsequent to N-ADH, the graphs show the number of failures (random – observed) across τ. Black or colored lines (for under- and over-expressed sub-sets) indicate significant differences relative to random. (B) Same conditions but the random sets were only adjusted for their equivalent size to the test set, not for their degree distribution. | ||
3.4 Cancer treatment response and specific node targeting are associated with topological robustness
Having studied cancer development and progression, we next evaluated the existence of topological robustness in the conditions of cancer treatment response and targeted perturbation. Over two-thirds of breast cancer patients present tumors classified as estrogen receptor α (ERα)-positive.41 As a single molecular marker, ERα is the most powerful in distinguishing tumor subclasses according to prognosis and response to endocrine therapies.42 Consequently, a common therapeutic approach for ERα-positive breast cancer is to use drugs, such as tamoxifen (Nolvadex®), directed at impeding its binding to estrogens and the subsequent intracellular signaling.42 In this scenario, to assess the link to breast cancer prognosis and prediction, two sets of proteins in the network were selected: those corresponding to the predictive signature of tamoxifen response (named Recurrence Score43); and those corresponding to genes differentially expressed between MCF7 (ERα-positive) xenografts treated with estrogens versus tamoxifen.29 Notably, in both cases, a lower number of failures than randomly expected was observed (Fig. 7). Similar topological robustness was observed for the under- and over-expressed subsets, which indicates that cancer proteins which define progression or prediction are similar, at the level of their network impact, to those that characterize cancer development and progression. | ||
| Fig. 7 Proteins linked to cancer treatment response reveal topological robustness. For an intermediate α (α ≅ 0.5; similar results were obtained with other values, not shown), the HPRD dataset, and the protein sets that define all cancer stages, the graphs show the number of failures (random – observed) across τ. Black or colored lines (for under- and over-expressed sub-sets) indicate significant differences relative to random. Top panels show results of the impact of the Recurrence Score set and bottom panels show results of the impact of the set that corresponds to differentially expressed genes between MCF7 xenografts treated with estrogens versus tamoxifen. | ||
To further evaluate the observed topological robustness, we experimentally perturbed a critical network node and evaluated the link with the cancer stages. For this study we selected a gene, α-synuclein (SNCA), that is consistently under-expressed in MCF7 cells and breast tumors44,45 and encodes for a protein with a relatively high number of interactors, kSNCA = 39. Following transfection with a SNCA expression construct, two stable MCF7 clones were selected and examined for expression differences relative to the parental MCF7 cells. Notably, genes whose expression levels differentiate the two cell types (>|2-fold|, File S7, ESI†) were also found to differentiate tumors according to ERα status (Fig. 8a) and, overall, the expression of a proliferation signature46 was reduced in MCF7-SNCA relative to the parental MCF7 cells (Fig. 8b). Next, selecting the corresponding protein set in the interactome network revealed topological robustness; that is, causing a lower number of failures than randomly expected (Fig. 8c). This observation is consistent with the idea that proteins linked to cancer—whether in development, progression or treatment response—are associated with topological robustness.
 | ||
| Fig. 8 Perturbation by targeting a cancer node reveals topological robustness. (A) Left panel, Western blot results demonstrating SNCA over-expression in MCF7-SNCA cell lines, relative to the parental MCF7. Right panel, results of an unsupervised classification of primary breast tumors and normal tissue using genes whose expression differentiate (>|2-fold|) MCF7-SNCA and MCF7 cells (File S7, ESI†). Tumor status for ERα, progesterone receptor (PR) and v-erb-b2 erythroblastic leukemia viral oncogene homolog 2 (ERBB2) are shown (black-filled box, positive; white-filled box, negative; and grey-filled box, unknown status). (B) GSEA results for a proliferation signature ranked across the expression differences between MCF7 and MCF7-SNCA cell lines. The position of the proliferation marker MKI67 is shown. (C) For an intermediate α (α ≅ 0.5; similar results were obtained with other values, not shown), the HPRD dataset, and the protein sets that define all cancer stages, the graphs show the number of failures (random – observed) across τ. Black or colored lines (for under- and over-expressed sub-sets) indicate significant differences relative to random. | ||
3.5 Proteins involved in autophagy show an opposite topological network impact to those related to cancer
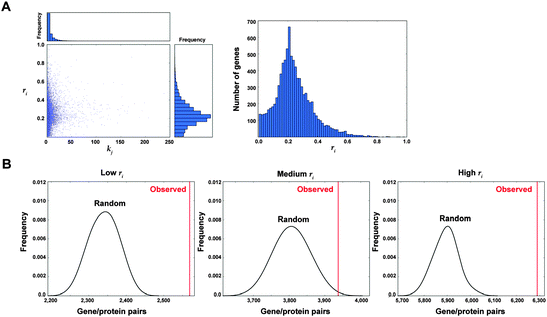
The gene sets examined above are characterized by their link to increased proliferation potential of cancer cells, either through development and progression, or though comparison with a control or parental cell type. Since similar conclusions were reached with these sets, we next sought to identify which biological feature might be associated with an opposite impact; that is, provoking more failures than randomly expected. To address this question, we ranked all proteins in the interactome network according to their probability of causing more failures than expected—using the N-IDC dataset and adjusting by node degree—and applied the non-parametric algorithm in the GSEA tool33 to detect bias in signaling pathways from KEGG. At a FDR of 5%, two related pathways were found to be biased towards causing more failures: “Regulation of Autophagy” and “SNARE Interactions in Vesicular Transport” (Fig. 9a). These results were corroborated by examining the results of selecting the corresponding KEGG sets (Fig. 9c and File S3, ESI†). In contrast, and also consistent with observations made above, the sets causing fewer failures than randomly expected were those linked to cancer (Fig. 9b). Thus, while “Regulation of Autophagy” may be defined as an opposite biological process to cancer, these results further endorse the biological relevance of the topological robustness associated with cancer. | ||
| Fig. 9 Proteins related to autophagy show an opposite topological network impact to those related to cancer. (A) GSEA results for genes from the “Regulation of Autophagy” KEGG annotated pathway, ranked according to the probability of causing more failures than randomly expected. (B) GSEA results for pathways whose corresponding genes cause fewer failures than randomly expected. The graph shows results for the “Cell Cycle” pathway. Detailed pathways were significant at FDR-adjusted p < 0.05. (C) For an intermediate α and the HPRD dataset, results are shown for the impact of selecting the protein set corresponding to the “Regulation of Autophagy” pathway. | ||
3.6 Smaller shortest paths between proteins involved in cancer contribute to topological robustness
The common results from the analysis of cancer conditions raise the question of which topological characteristic possessed by the corresponding network nodes explains their associated robustness. Taking previous evidence that cancer mutated or differentially expressed gene products have smaller average shortest path values in the interactome network,36–38,47–49 we examined the contribution of this characteristic to the topological robustness. For this analysis, starting with a randomly selected node in the main network component, three protein sets of identical size were generated by selecting each neighbor at 2-, 4-, or 6-hops. Next, each of these sets was selected as above and the number of failures examined relative to random sets with an identical node degree distribution but unselected for their shortest paths. The results of this analysis revealed that the presence of a smaller shortest path distribution contributes to topological robustness: thus, the set with a smaller shortest path distribution (average of 3.74) caused far fewer failures than randomly expected, while the set with larger shortest paths (average of 5.44) caused far more failures than randomly expected (Fig. 10a). In addition, the 136 KEGG sets identified above with a different impact to the cancer conditions tended to have smaller shortest paths (Fig. 10b). Nonetheless, there may be additional topological characteristics contributing to the observed differences: some of the 136 sets showed overlapping distributions with the cancer sets and, in particular, the “SNARE Interactions in Vesicular Transport” set revealed a relatively small average shortest path value (2.69), which is similar to that of the “Cell Cycle” set (2.67; all KEGG set values are detailed in File S8, ESI†). Moreover, the breast cancer sets (N-ADH to IDC-M) showed average shortest paths between 4.09 and 4.26. Together, the results of this study suggest that proteins altered in cancer are topologically distributed in the interactome network in a manner that is robust relative to random perturbations. | ||
| Fig. 10 Smaller shortest paths between proteins involved in cancer perturbations contribute to topological robustness. (A) Left panel, shortest path distributions of three protein sets selected through randomly chosen neighbors at 2-, 4-, and 6-hops (starting with a common seed node). Right panels, for an intermediate α and the HPRD dataset, results are shown for the impact of selecting each of three protein sets. (B) Shortest path distributions of KEGG sets with a different (orange curves, File S3, ESI†) or similar (blue curves, File S4, ESI†) topological impact to those of cancer perturbations. | ||
4. Discussion
Previous studies have demonstrated that cancer proteins, as defined by the products of genes with mutations or with expression changes in tumors relative to their normal tissue counterparts, occupy central positions in the interactome network.36–38,47–49 In these studies, centrality was examined through local (degree and clustering coefficient) and global (betweenness and closeness) measures. Additionally, integration of gene expression and interactome data has proved useful in identifying sets of genes/proteins that explain prognostic differences.11–14 Here, we performed a topological study of the interactome network focused on the concepts of dynamism and robustness associated with cancer-related conditions or perturbations. To do so, we analyzed cascading failures of network nodes following selection of defined protein sets linked to cancer and compared the results to those of appropriate control sets. Thus, analogously to the study of electricity load transfer, capacity limit and cascading failures in power grids, this study examines the impact and transmission of cancer expression changes in the interactome network. Within this framework, the results of our study suggest that cancer is associated with topological robustness; that is, a cancer condition represented by, for example, gene expression changes between normal tissue and hyperplasia causes a lesser, more specific impact on the network than expected by chance. In other words, the biological change that a given cancer condition imposes on the interactome network is relatively more controlled and less broadly distributed at the topological level than randomly expected. This appears to be the case for different analysis parameters, which include controls for the degree and cluster coefficient distributions, and for different cancer sets, which include a targeted node perturbation.Having identified a common topological feature for diverse cancer conditions, we were intrigued by the potential existence of sets of proteins (and their biological meaning) showing an opposite impact. An unsupervised, protein-centered analysis identified “Regulation of Autophagy” and “SNARE Interactions in Vesicular Transport” to be such sets. While both sets are functionally related, this observation may be in agreement with the idea that autophagy and cancer are, in general terms, contrary processes.40 Thus, from an interactome network topology perspective, autophagy may consist of a less precise process, in which information transfer is relatively unrestrained. Furthermore, this observation might support the observations of recent studies that identify targeting autophagy in cancer as a promising line of therapy.50 Other sets with a similar opposite impact to cancer may exist but they were not captured by the protein-centered analysis. In fact, by a set-centered analysis, several KEGG pathways related to the immune response revealed a relatively strong opposite topological impact to those observed for cancer. Together, these observations might also indicate that, although a large number of gene and protein changes exist in a given cancer condition, these are under topological control to prevent a more global alteration of the interactome network, which would not be as favorable for the cancer cell.
For the application of the cascading failure algorithm, we assumed that a gene with a broader expression rank should represent a more robust node in the network, as a cell may possibly tolerate larger variation in the number of the corresponding molecules prior to transferring its associated biological information to the interaction partners. However, the conclusions of our study may be limited by the fact that concordant changes in gene and protein expressions are only observed for approximately two-thirds of cases.51,52 In addition, although the conclusions are supported by the analysis of several expression datasets, as well as protein sets without a priori expression knowledge, expression variability across samples could also partially reflect disparate cell type contents, and there is no clear biological proof that the defined parameters of node load and capacity should be proportional to the number of protein interactions. Analogously to the study of power grids, a protein with a higher number of interactions is more likely to be involved in a higher number of functions or processes,53,54 hence it seems reasonable to assume that it has a higher load as well as capacity for biological information. The conclusions of this study might also be constrained by the fact that the interactome networks are incomplete for all existing, biologically relevant protein–protein interactions and by the reliability of data repositories.55 Further analyses using more detailed experimental data may be warranted to corroborate the observed topological robustness associated with cancer. In these future analyses, the link to the increased signaling entropy in cancer17–19 may also be warranted in comprehensively deciphering the systems-level properties of cancer.
5. Conclusions
While cancer-related proteins are central in the interactome network, this study reveals that cancer develops, progresses and responds to therapies through restricted perturbation of this network. Therefore, the topological analysis links robustness to cancer and, in contrast, identifies autophagy as an opposite condition, which might support its targeting for therapy.Acknowledgements
This work was supported by grants awarded by the “Generalitat de Catalunya” (2009-SGR283), the Ramón Areces (XV) and “Roses Contra el Càncer” Foundations, the Spanish Association Against Cancer (stable groups 2010), the Spanish Ministry of Science and Innovation (MTM2008-06620-C03-01 and “Instituto de Salud Carlos III” FIS 09/02483), and the Spanish Society of Medical Oncology (2009). JS-M was supported by an IDIBGi fellowship, HA by a Sara Borrell fellowship from the “Instituto de Salud Carlos III”, and FI is a fellow of the joint EBI-Sanger post-doctoral (ESPOD) program.References
- J. Quackenbush, New Engl. J. Med., 2006, 354, 2463–2472 CrossRef CAS.
- J. Massagué, New Engl. J. Med., 2007, 356, 294–297 CrossRef.
- C. Fan, D. S. Oh, L. Wessels, B. Weigelt, D. S. Nuyten, A. B. Nobel, L. J. van't Veer and C. M. Perou, New Engl. J. Med., 2006, 355, 560–569 CrossRef CAS.
- J. T. Chang and J. R. Nevins, Bioinformatics, 2006, 22, 2926–2933 CrossRef CAS.
- R. Shen, A. M. Chinnaiyan and D. Ghosh, BMC Med. Genomics, 2008, 1, 28 CrossRef.
- X. Solé, N. Bonifaci, N. López-Bigas, A. Berenguer, P. Hernández, O. Reina, C. A. Maxwell, H. Aguilar, A. Urruticoechea, S. de Sanjosé, F. Comellas, G. Capellá, V. Moreno and M. A. Pujana, PLoS One, 2009, 4, e4544 Search PubMed.
- J. X. Yu, A. M. Sieuwerts, Y. Zhang, J. W. Martens, M. Smid, J. G. Klijn, Y. Wang and J. A. Foekens, BMC Cancer, 2007, 7, 182 CrossRef.
- Z. Zhang, D. Chen and D. A. Fenstermacher, BMC Genomics, 2007, 8, 331 CrossRef.
- V. Vuaroqueaux, P. Urban, M. Labuhn, M. Delorenzi, P. Wirapati, C. C. Benz, R. Flury, H. Dieterich, F. Spyratos, U. Eppenberger and S. Eppenberger-Castori, Breast Cancer Res., 2007, 9, R33 CrossRef.
- M. Bessarabova, O. Pustovalova, W. Shi, T. Serebriyskaya, A. Ishkin, K. Polyak, V. E. Velculescu, T. Nikolskaya and Y. Nikolsky, Cancer Res., 2011, 71, 3471–3481 CrossRef CAS.
- H. Y. Chuang, E. Lee, Y. T. Liu, D. Lee and T. Ideker, Mol. Syst. Biol., 2007, 3, 140 CrossRef.
- J. Ahn, Y. Yoon, C. Park, E. Shin and S. Park, Bioinformatics, 2011, 27, 1846–1853 CrossRef CAS.
- I. W. Taylor, R. Linding, D. Warde-Farley, Y. Liu, C. Pesquita, D. Faria, S. Bull, T. Pawson, Q. Morris and J. L. Wrana, Nat. Biotechnol., 2009, 27, 199–204 CrossRef CAS.
- J. Li, A. E. Lenferink, Y. Deng, C. Collins, Q. Cui, E. O. Purisima, M. D. O'Connor-McCourt and E. Wang, Nat. Commun., 2010, 1, 34 Search PubMed.
- C. Greenman, P. Stephens, R. Smith, G. L. Dalgliesh, C. Hunter, G. Bignell, H. Davies, J. Teague, A. Butler, C. Stevens, S. Edkins, S. O'Meara, I. Vastrik, E. E. Schmidt, T. Avis, S. Barthorpe, G. Bhamra, G. Buck, B. Choudhury, J. Clements, J. Cole, E. Dicks, S. Forbes, K. Gray, K. Halliday, R. Harrison, K. Hills, J. Hinton, A. Jenkinson, D. Jones, A. Menzies, T. Mironenko, J. Perry, K. Raine, D. Richardson, R. Shepherd, A. Small, C. Tofts, J. Varian, T. Webb, S. West, S. Widaa, A. Yates, D. P. Cahill, D. N. Louis, P. Goldstraw, A. G. Nicholson, F. Brasseur, L. Looijenga, B. L. Weber, Y. E. Chiew, A. DeFazio, M. F. Greaves, A. R. Green, P. Campbell, E. Birney, D. F. Easton, G. Chenevix-Trench, M. H. Tan, S. K. Khoo, B. T. Teh, S. T. Yuen, S. Y. Leung, R. Wooster, P. A. Futreal and M. R. Stratton, Nature, 2007, 446, 153–158 CrossRef CAS.
- D. Hanahan and R. A. Weinberg, Cell, 2011, 144, 646–674 CrossRef CAS.
- A. E. Teschendorff and S. Severini, BMC Syst. Biol., 2010, 4, 104 CrossRef.
- W. N. van Wieringen and A. W. van der Vaart, Bioinformatics, 2011, 27, 556–563 CrossRef CAS.
- G. Schramm, N. Kannabiran and R. Konig, BMC Syst. Biol., 2010, 4, 162 CrossRef.
- L.-L. Wang and L.-L. Rong, Saf. Sci., 2009, 47, 1332–1336 CrossRef.
- A. G. Smart, L. A. Amaral and J. M. Ottino, Proc. Natl. Acad. Sci. U. S. A., 2008, 105, 13223–13228 CrossRef CAS.
- T. S. Keshava Prasad, R. Goel, K. Kandasamy, S. Keerthikumar, S. Kumar, S. Mathivanan, D. Telikicherla, R. Raju, B. Shafreen, A. Venugopal, L. Balakrishnan, A. Marimuthu, S. Banerjee, D. S. Somanathan, A. Sebastian, S. Rani, S. Ray, C. J. Harrys Kishore, S. Kanth, M. Ahmed, M. K. Kashyap, R. Mohmood, Y. L. Ramachandra, V. Krishna, B. A. Rahiman, S. Mohan, P. Ranganathan, S. Ramabadran, R. Chaerkady and A. Pandey, Nucleic Acids Res., 2009, 37, D767–D772 CrossRef CAS.
- B. Aranda, P. Achuthan, Y. Alam-Faruque, I. Armean, A. Bridge, C. Derow, M. Feuermann, A. T. Ghanbarian, S. Kerrien, J. Khadake, J. Kerssemakers, C. Leroy, M. Menden, M. Michaut, L. Montecchi-Palazzi, S. N. Neuhauser, S. Orchard, V. Perreau, B. Roechert, K. van Eijk and H. Hermjakob, Nucleic Acids Res., 2009, 38, D525–D531 CrossRef.
- L. A. Emery, A. Tripathi, C. King, M. Kavanah, J. Mendez, M. D. Stone, A. de las Morenas, P. Sebastiani and C. L. Rosenberg, Am. J. Pathol., 2009, 175, 1292–1302 CrossRef CAS.
- X. J. Ma, S. Dahiya, E. Richardson, M. Erlander and D. C. Sgroi, Breast Cancer Res., 2009, 11, R7 CrossRef.
- A. L. Richardson, Z. C. Wang, A. De Nicolo, X. Lu, M. Brown, A. Miron, X. Liao, J. D. Iglehart, D. M. Livingston and S. Ganesan, Cancer Cell, 2006, 9, 121–132 CrossRef CAS.
- C. S. Schuetz, M. Bonin, S. E. Clare, K. Nieselt, K. Sotlar, M. Walter, T. Fehm, E. Solomayer, O. Riess, D. Wallwiener, R. Kurek and H. J. Neubauer, Cancer Res., 2006, 66, 5278–5286 CrossRef CAS.
- B. Weigelt, Z. Hu, X. He, C. Livasy, L. A. Carey, M. G. Ewend, A. M. Glas, C. M. Perou and L. J. Van't Veer, Cancer Res., 2005, 65, 9155–9158 CrossRef CAS.
- S. Massarweh, C. K. Osborne, C. J. Creighton, L. Qin, A. Tsimelzon, S. Huang, H. Weiss, M. Rimawi and R. Schiff, Cancer Res., 2008, 68, 826–833 CrossRef CAS.
- V. G. Tusher, R. Tibshirani and G. Chu, Proc. Natl. Acad. Sci. U. S. A., 2001, 98, 5116–5121 CrossRef CAS.
- Y. Benjamini and Y. Hochberg, J. R. Stat. Soc. Ser. B (Methodological), 1995, 57, 289–300 Search PubMed.
- O. Galamb, S. Spisak, F. Sipos, K. Toth, N. Solymosi, B. Wichmann, T. Krenacs, G. Valcz, Z. Tulassay and B. Molnar, Br. J. Cancer, 2010, 102, 765–773 CrossRef CAS.
- A. Subramanian, P. Tamayo, V. K. Mootha, S. Mukherjee, B. L. Ebert, M. A. Gillette, A. Paulovich, S. L. Pomeroy, T. R. Golub, E. S. Lander and J. P. Mesirov, Proc. Natl. Acad. Sci. U. S. A., 2005, 102, 15545–15550 CrossRef CAS.
- J. F. Rual, K. Venkatesan, T. Hao, T. Hirozane-Kishikawa, A. Dricot, N. Li, G. F. Berriz, F. D. Gibbons, M. Dreze, N. Ayivi-Guedehoussou, N. Klitgord, C. Simon, M. Boxem, S. Milstein, J. Rosenberg, D. S. Goldberg, L. V. Zhang, S. L. Wong, G. Franklin, S. Li, J. S. Albala, J. Lim, C. Fraughton, E. Llamosas, S. Cevik, C. Bex, P. Lamesch, R. S. Sikorski, J. Vandenhaute, H. Y. Zoghbi, A. Smolyar, S. Bosak, R. Sequerra, L. Doucette-Stamm, M. E. Cusick, D. E. Hill, F. P. Roth and M. Vidal, Nature, 2005, 437, 1173–1178 CrossRef CAS.
- U. Stelzl, U. Worm, M. Lalowski, C. Haenig, F. H. Brembeck, H. Goehler, M. Stroedicke, M. Zenkner, A. Schoenherr, S. Koeppen, J. Timm, S. Mintzlaff, C. Abraham, N. Bock, S. Kietzman, A. Goedde, E. Toksoz, A. Droege, S. Krobitsch, B. Korn, W. Birchmeier, H. Lehrach and E. E. Wanker, Cell, 2005, 122, 957–968 CrossRef CAS.
- P. Hernández, J. Huerta-Cepas, D. Montaner, F. Al-Shahrour, J. Valls, L. Gómez, G. Capellá, J. Dopazo and M. A. Pujana, BMC Genomics, 2007, 8, 185 CrossRef.
- S. Wachi, K. Yoneda and R. Wu, Bioinformatics, 2005, 21, 4205–4208 CrossRef CAS.
- A. S. Syed, M. D'Antonio and F. D. Ciccarelli, Nucleic Acids Res., 2010, 38, D670–D675 CrossRef CAS.
- H. Ogata, S. Goto, K. Sato, W. Fujibuchi, H. Bono and M. Kanehisa, Nucleic Acids Res., 1999, 27, 29–34 CrossRef CAS.
- G. Bindea, B. Mlecnik, W. H. Fridman, F. Pages and J. Galon, Curr. Opin. Immunol., 2010, 22, 215–222 CrossRef CAS.
- J. Russo and I. H. Russo, Adv. Exp. Med. Biol., 2008, 630, 52–56 CrossRef CAS.
- M. Dowsett, E. Folkerd, D. Doody and B. Haynes, Breast, 2005, 14, 452–457 CrossRef.
- S. Paik, S. Shak, G. Tang, C. Kim, J. Baker, M. Cronin, F. L. Baehner, M. G. Walker, D. Watson, T. Park, W. Hiller, E. R. Fisher, D. L. Wickerham, J. Bryant and N. Wolmark, N. Engl. J. Med., 2004, 351, 2817–2826 CrossRef CAS.
- K. Chin, S. DeVries, J. Fridlyand, P. T. Spellman, R. Roydasgupta, W. L. Kuo, A. Lapuk, R. M. Neve, Z. Qian, T. Ryder, F. Chen, H. Feiler, T. Tokuyasu, C. Kingsley, S. Dairkee, Z. Meng, K. Chew, D. Pinkel, A. Jain, B. M. Ljung, L. Esserman, D. G. Albertson, F. M. Waldman and J. W. Gray, Cancer Cell, 2006, 10, 529–541 CrossRef CAS.
- R. M. Neve, K. Chin, J. Fridlyand, J. Yeh, F. L. Baehner, T. Fevr, L. Clark, N. Bayani, J. P. Coppe, F. Tong, T. Speed, P. T. Spellman, S. DeVries, A. Lapuk, N. J. Wang, W. L. Kuo, J. L. Stilwell, D. Pinkel, D. G. Albertson, F. M. Waldman, F. McCormick, R. B. Dickson, M. D. Johnson, M. Lippman, S. Ethier, A. Gazdar and J. W. Gray, Cancer Cell, 2006, 10, 515–527 CrossRef CAS.
- M. L. Whitfield, L. K. George, G. D. Grant and C. M. Perou, Nat. Rev. Cancer, 2006, 6, 99–106 CrossRef CAS.
- P. F. Jonsson and P. A. Bates, Bioinformatics, 2006, 22, 2291–2297 CrossRef CAS.
- D. Rambaldi, F. M. Giorgi, F. Capuani, A. Ciliberto and F. D. Ciccarelli, Trends Genet., 2008, 24, 427–430 CrossRef CAS.
- Z. Dezso, Y. Nikolsky, T. Nikolskaya, J. Miller, D. Cherba, C. Webb and A. Bugrim, BMC Syst. Biol., 2009, 3, 36 CrossRef.
- F. Janku, D. J. McConkey, D. S. Hong and R. Kurzrock, Nat. Rev. Clin. Oncol., 2011, 8, 528–539 CrossRef CAS.
- S. Nishizuka, L. Charboneau, L. Young, S. Major, W. C. Reinhold, M. Waltham, H. Kouros-Mehr, K. J. Bussey, J. K. Lee, V. Espina, P. J. Munson, E. Petricoin 3rd., L. A. Liotta and J. N. Weinstein, Proc. Natl. Acad. Sci. U. S. A., 2003, 100, 14229–14234 CrossRef CAS.
- Q. Tian, S. B. Stepaniants, M. Mao, L. Weng, M. C. Feetham, M. J. Doyle, E. C. Yi, H. Dai, V. Thorsson, J. Eng, D. Goodlett, J. P. Berger, B. Gunter, P. S. Linseley, R. B. Stoughton, R. Aebersold, S. J. Collins, W. A. Hanlon and L. E. Hood, Mol. Cell. Proteomics, 2004, 3, 960–969 CAS.
- A. L. Barabasi, N. Gulbahce and J. Loscalzo, Nat. Rev. Genet., 2011, 12, 56–68 CrossRef CAS.
- A. L. Barabasi and Z. N. Oltvai, Nat. Rev. Genet., 2004, 5, 101–113 CrossRef CAS.
- M. E. Cusick, H. Yu, A. Smolyar, K. Venkatesan, A. R. Carvunis, N. Simonis, J. F. Rual, H. Borick, P. Braun, M. Dreze, J. Vandenhaute, M. Galli, J. Yazaki, D. E. Hill, J. R. Ecker, F. P. Roth and M. Vidal, Nat. Methods, 2009, 6, 39–46 CrossRef CAS.
Footnote |
| † Electronic supplementary information (ESI) available: Supplementary files 1–8 and legends. See DOI: 10.1039/c2ib20052j |
| This journal is © The Royal Society of Chemistry 2012 |