Measurements of intracellular ATP provide new insight into the regulation of glycolysis in the yeast Saccharomyces cerevisiae†
Cecilie K.
Ytting
a,
Anja T.
Fuglsang
a,
J.
Kalervo Hiltunen
b,
Alexander J.
Kastaniotis
b,
Veli Cengiz
Özalp‡
c,
Lise Junker
Nielsen
c and
Lars Folke
Olsen
*c
aThe Centre for Membrane Pumps in Cells and Diseases – PUMPkin, Department of Plant Biology and Biotechnology, University of Copenhagen, Thorvaldsensvej 40, DK-1871 Frederiksberg, Denmark
bDepartment of Biochemistry and Biocenter Oulu, University of Oulu, PO Box 3000, FI-90014 Oulu, Finland
cDepartment of Biochemistry and Molecular Biology, University of Southern Denmark, Campusvej 55, DK-5230 Odense M, Denmark. E-mail: lfo@bmb.sdu.dk
First published on 2nd December 2011
Abstract
Glycolysis in the yeast Saccharomyces cerevisiae exhibits temporal oscillation under anaerobic or semianaerobic conditions. Previous evidence indicated that at least two membrane-bound ATPases, the mitochondrial F0F1 ATPase and the plasma membrane P-type ATPase (Pma1p), were important in regulating the glycolytic oscillation. Measurements of intracellular ATP provide a unique tool to understand the role of these membrane ATPases and how their activities are regulated. We have constructed a new nanobiosensor that can perform time-resolved measurements of intracellular ATP in intact cells. Measurements of the temporal behaviour of intracellular ATP in a yeast strain with oscillating glycolysis showed that, in addition to oscillation in intracellular ATP, there is an overall slow decrease in intracellular ATP because the ATP consumption rate exceeds the ATP production in glycolysis. Measurements of the temporal behaviour of intracellular ATP in yeast strains lacking either of the two membrane bound ATPases have confirmed that F0F1 ATPase and Pma1p contribute significantly to the ATP consumption in the cell and to the regulation of glycolytic oscillation. Furthermore, our measurements also demonstrate that ATPase activity is under strict control. In the absence of glucose ATPase activity is switched off, and the intracellular ATP concentration is high. When glucose is added to the cells the ATP concentration starts to decrease, because ATP consumption exceeds ATP production by glycolysis. Finally, when glucose is used up, the ATP consumption stops immediately. Thus, glucose or some compound derived from glucose must be involved in controlling the activity of these two ATPases.
Insight, innovation, integrationKnowledge is lacking about the temporal behaviour of intracellular ATP and the regulation of enzymes catalyzing ATP production and ATP consumption in cells. Here we have developed a new type of ATP sensor which can readily be inserted into eukaryotic cells and perform time-resolved measurements of intracellular ATP. The sensor is ratiometric, i.e. it can be calibrated in vitro and used directly in vivo. The sensor was inserted into cells of the yeast Saccharomyces cerevisiae with an oscillating glycolysis and into yeast strains lacking various ATPase activities in order to identify enzymes regulating the oscillation. The measurements of intracellular ATP showed that (i) ATPase activity is essential for the occurrence of glycolytic oscillation and (ii) glucose exerts, directly or indirectly, a strict control of ATPase activity. Our results demonstrate that time-resolved measurements of intracellular metabolites will shed new light on our understanding of metabolic pathways and their regulation. |
Introduction
Oscillatory dynamics are quite common in cell metabolism and cell signalling.1,2 Examples are glycolysis in cells of the yeast Saccharomyces cerevisiae3 and in pancreatic β-cells.4 It is not yet clear what the implications of such behaviour are for the organism, and some uncertainty also exists with respect to the mechanism underlying the oscillation.In the yeast S. cerevisiae glycolytic oscillation can be observed as oscillation in NADH autofluorescence,5 carbon dioxide,6 intracellular pH,7 glycolytic intermediates8 and mitochondrial membrane potential.9 The observation of an oscillating mitochondrial membrane potential indicates that also enzymes outside of glycolysis participate in the generation of the oscillation, because inhibition of the enzyme responsible for the establishment of this potential, the F0F1 ATPase operating in reverse, also annihilates the oscillation.7
Since the early 1970s mathematical models to explain the glycolytic oscillation have been proposed. Several of these models focus on phosphofructokinase (PFK) as the key regulatory enzyme responsible for the oscillation, although some models also suggest additional regulatory sites.3 For example, a recent analysis of a detailed model of the glycolytic pathway has suggested that the amplitude of the glycolytic oscillation is mostly controlled by the regulatory properties of PFK and the ATP–ADP–AMP system through its interactions with hexokinase, glycogen synthesis and unspecified ATP consumption.10 However, in almost all the current models of glycolytic oscillation in yeast only enzymes in the glycolytic pathway have been considered, and ATPase activity is usually considered to have only a marginal role.11 However, in a recent publication7 we provided evidence that both the mitochondrial F0F1-ATPase and the plasma membrane ATPase (Pma1p) are important for the glycolytic oscillation. These experiments were based on the effects of the inhibitors azide, which inhibits the F0F1 ATPase, and omeprazole, which inhibits Pma1p. Therefore we conjecture that the catalytic and regulatory properties of these enzymes may also influence the oscillation.
In order to get a better understanding of the mechanism responsible for the glycolytic oscillation in yeast it would be desirable to obtain more experimental measurements of glycolytic intermediates to compare with the predictions of the models. Here we have taken a first step by developing an ATP nanosensor to measure ATP concentration in intact cells with an oscillating glycolysis. We have inserted the ATP sensor into wild type yeast strains with intact glycolysis, mitochondrial functions and Pma1p as well as into two mutants that lack either functional mitochondria or Pma1p activity, respectively. While all the wild types show oscillating glycolysis the mutants only show steady-state behaviour. Thus, the results obtained with the mutants support the earlier studies using inhibitors.7 Furthermore, the measurements of intracellular ATP reveal some surprising results about the relationship between glycolysis, the two membrane ATPases and the intracellular ATP concentration as well as regulation of ATPase activity by glucose. We believe that our results have relevance that goes beyond yeast cells since glycolysis is a universal metabolic pathway of which several reaction steps have been conserved throughout evolution.
Experimental
Materials
The aptamer switch probe was synthesized by VBC Biotech (Vienna, Austria). The fluorescent probes Texas Red dextran and 3,3′-diethyloxacarbocyanine iodide (DiOC2(3)) were obtained from Molecular Probes (Eugene, OR, USA). All other reagents were purchased from Sigma (Munich, Germany).Aptamer switch probe
The ATP-binding aptamer sequence selected previously12,13 was converted into a switch probe by adding a polyethylene glycol spacer (36 ethylene glycol molecules) at the 3′-end with an extension of seven nucleotides which are complementary to the 5′-end of the aptamer sequence using the principle proposed by Tang et al.14 The quencher (Black Hole 1) was attached at the 5′-end and a fluorophore (Alexa Fluor 488) at the 3′-end. The reverse positions of the quencher and the fluorophore were also tested and similar levels of fluorescence signals were obtained in ATP titrations. The sequence of the new aptamer switch probe was as follows:BlackHole1-GTAGTAAGAACTAAAGTAAAAAAAAAATTAAAGTAGCCACGCTT-[CH2–CH2–O]36-TTACTAC-AlexaFluor488.
Aptamer-based nanobiosensor preparation
Polyacrylamide nanoparticles were prepared by an inverse micro-emulsion polymerization reaction modified from the study by Daubresse et al.15 in the presence of the ATP aptamer switch probe. Briefly, 3.08 g of dioctyl sulfosuccinate (AOT) and 1.08 g of Brij 30 were dissolved in 43 ml of hexane and deoxygenated by sonication for 1 h. Meanwhile 1.35 g of acrylamide and 0.4 g of N,N-methylenebisacrylamide were dissolved in 4.5 ml of 10 mM sodium phosphate buffer of pH 7.25 and 280 μl of a 100 μM aptamer switch probe solution and 15 μl of 50 mg ml−1 Texas Red dextran were added. 2.0 ml of this solution was added dropwise to the hexane solution and left for 20 minutes under argon to form the microemulsion. Polymerization was initiated by addition of 50 μl of a 10% (w/v) solution of sodium bisulfite and allowed to proceed for 3 h. The hexane was removed in vacuo and the nanosensors were precipitated by the addition of 100 ml ethanol. The suspension was transferred to an Amicon ultrafiltration cell model 2800 (Millipore Corp., Bedford, USA) and filtered through a 100 kDa filter and washed with 4 × 100 ml of ethanol to remove unreacted monomers and surfactants. The particles were resuspended in 50 ml of ethanol, filtered (0.025 μm nitrocellulose filter membrane) and dried in vacuo. Vacuum dried particles were kept at −20 °C until they were used in experiments. Nanoparticle size was determined by a dynamic light scattering method (15 mW laser, incident beam 633 nm; Brookhaven Instruments Corporation, Holtsville, NY, USA) in a non-negative least square curve fit analysis. The measurements were performed in triplicate at 25 ± 0.01 °C.Measurements of intracellular ATP, pH and mitochondrial membrane potential
Experiments were performed in an Edinburgh FL 920 spectrofluorometer using a 2 ml sample cell with constant stirring and temperature control (Quantum Northwest, WA, USA). The samples contained yeast cells with or without inserted nanosensors. The fluorescence signal due to Alexa Fluor 488 was measured at 520/3 nm with excitation at 470/3 nm. The temperature around the sample cell was maintained at 25.00 ± 0.01 °C. Titration experiments were performed in 20 mM sodium phosphate buffer, pH = 7.4; 140 mM KCl![[thin space (1/6-em)]](https://www.rsc.org/images/entities/char_2009.gif) :10 mM NaCl; 5 mM MgCl2. The fluorescence signals due to Alexa Fluor 488 (F520) were normalized to the fluorescence of Texas Red (F605) by the following equation:
:10 mM NaCl; 5 mM MgCl2. The fluorescence signals due to Alexa Fluor 488 (F520) were normalized to the fluorescence of Texas Red (F605) by the following equation: | (1) |
 | (2) |
| ϕmeas = ϕATP([ATP]) + ϕADP([A]0 − [ADP]) | (3) |
Measurements of the intracellular pH (pHi) in a suspension of yeast cells using the pH-sensitive dye 5- (and 6-)-carboxy-fluorescein diacetate succinimidyl ester (CFDA-SE) were performed as described previously.7
Measurements of fluorescence due to DiOC2(3) (mitochondrial membrane potential) were done with an excitation at 480/3 nm and emission at 600/3 nm using 5 μM probe as described in ref. 9, while fluorescence due to fluorescein (pHi) was measured as the ratio of the emissions at 520/1 nm, using excitations of 490/3 nm and 435/3 nm, respectively.
Mass spectrometric measurements of ethanol production
Measurements of the production of ethanol were conducted by the use of membrane inlet mass spectrometry, as described in Poulsen et al.6Cell growth and insertion of nanosensors
Cells of the yeast S. cerevisiae diploid strain X2180 were grown and harvested as described previously.6 Cells of the strains W1536 wild type (a derivative of W303) and mutant etr1Δ were grown at 30 °C in aerated conical flasks in a rotary shaker, 180 rpm, in a medium containing 10 g l−1 glucose, 6.7 g l−1 yeast nitrogen base (Bacto) and 100 mM potassium phthalate (Aldrich, Germany) at pH 5.0. The yeast was harvested at the point when glucose was depleted as measured with a glucose test strip (Macherey-Nagel, Düren, Germany). The cells were washed twice with 100 mM potassium phosphate buffer (Merck, Germany), pH 6.8 (centrifugation, 5 min at 4066 rcf, GSA, Sorvall), resuspended in the same buffer and starved for 3 h on a rotary shaker at 30 °C. Finally the strain RS-72 was grown in a potassium phthalate buffer, pH 5.0 or in a succinate buffer as the other strains but with galactose as a carbon source. Dilution of the Pma1p ATPase was accomplished by transferring the cells from a galactose medium to a glucose medium for 20 h. After harvest the cells were starved for 3 h and then suspended in 100 mM potassium phosphate buffer, pH 6.8 and stored at room temperature before use.Electroporation of ATP nanosensors into yeast cells was performed using sensors that had previously been treated with 100 U ml−1 of DNAase 1 in order to remove excess aptamer exposed to the sensor surface. Electroporation was performed as described previously16 in a 1 M sorbitol solution containing 300 mM KCl and 5 mM MgCl2 and ATP sensors corresponding to 50 mg ml−1.
The cell density was 10% wet weight in all experiments, except for experiments with the strain RS-72 where cell density was 20% wet weight.
Results
Addition of glucose and potassium cyanide to a dense suspension of cells of the yeast S. cerevisiae induces oscillation in glycolysis. Observation of oscillation in glycolysis requires that the cell density is high, and entails that all the cells in the suspension synchronize their metabolism.5 The synchronizing agent is most likely acetaldehyde. The role of cyanide is twofold: (i) it serves to arrest respiration, and (ii) it reacts with acetaldehyde released by the cells, maintaining a low concentration of acetaldehyde in the external solution. If the acetaldehyde concentration becomes too high the cells no longer synchronize their metabolism, and the oscillation ceases.5 An alternative to adding cyanide is to flush the reaction mixture with argon, which maintains a zero oxygen concentration and removes acetaldehyde by evaporation.6 In order to learn more about the process controlling the glycolytic oscillation in yeast we have employed a new ATP biosensor. This sensor consists of a polyacrylamide nanoparticle with an encapsulated aptamer switch probe.17 Aptamers are small single-stranded oligonucleotides with ligand binding affinity.18,19 They can be selected in vitro with a predefined affinity using a technique known as SELEX (systematic evolution of ligands by exponential enrichment).20,21 The aptamer used in this study is a DNA aptamer selected in our laboratory.12,13 It has specificity for ATP in the physiological range, i.e. from 1 to 5 mM. It was converted into a signalling molecule by adding a polyethylene glycol spacer (36 ethylene glycol molecules) at the 3′-end with an extension of seven nucleotides which are complementary to the 5′-end of the aptamer sequence, using the principle proposed by Tang et al.14 A fluorescence quencher (Black Hole 1) was attached at the 5′-end and a fluorophore (Alexa Fluor 488) at the 3′-end. The resulting aptamer switch probe was then encapsulated in a polyacrylamide nanoparticle with an approximate diameter of 30 nm. The sensor was subsequently inserted into the cells using electroporation as described previously for a glucose sensor.16Fig. 1 illustrates the principle with the nanosensor containing the aptamer switch probe and its insertion into the yeast cells. Insertion of the sensor into the cells does not have much effect on cell metabolism. For example the period or amplitudes of the glycolytic oscillation are not affected, and the cells are able to grow and divide several times with sensors inserted.16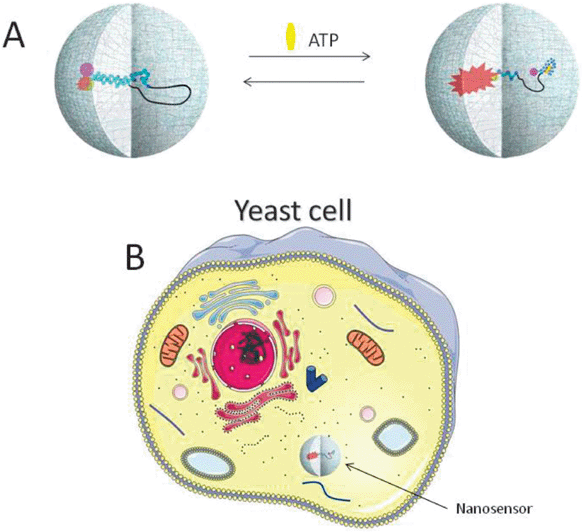 | ||
| Fig. 1 Schematic illustration of the function of the nanosensor and its insertion into cells. (A) The nanosensor consists of an aptamer switch probe with specificity for ATP encapsulated in a polyacrylamide nanoparticle (approximate diameter 30 nm). The nanoparticle is porous and allows small molecules to diffuse freely between the matrix and the environment. The aptamer switch probe contains a DNA aptamer sequence and a complementary sequence forming a hairpin and separated by a polyethylene glycol linker. A fluorophore (Alexa Fluor 488) is attached to the 3′-end of the aptamer while a quencher (Black Hole 1) is attached to the 5′-end of the complementary sequence, or vice versa. Binding of ATP results in an intramolecular rearrangement of the aptamer and hence separation of the fluorophore and the quencher. (B) The nanosensor is introduced into yeast cells using electroporation. The nanosensor is not drawn to scale. | ||
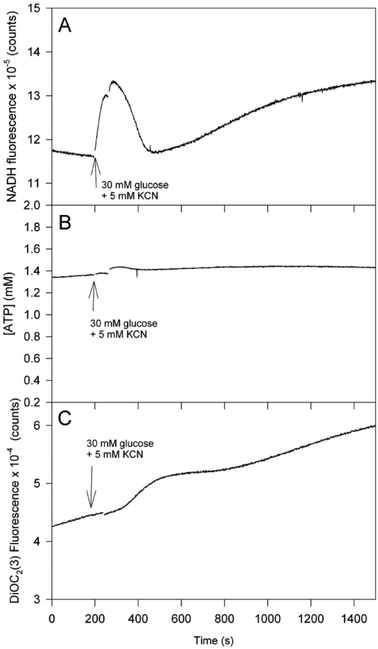
Fig. 2 shows representative time series of ethanol production, NADH autofluorescence and ATP concentration in the yeast strain X2180, which has normal glycolysis, cytochromes and respiration. Ethanol is measured using membrane inlet mass spectrometry while the ATP concentration was monitored from the ratio of the Alexa Fluor 488 fluorescence over the fluorescence of the reference dye (Texas Red) as described in the Experimental section and in ref. 12. It should be emphasized that the three graphs in Fig. 2 represent three different experiments and hence there may be small differences in the temporal behaviour. Following addition of glucose and cyanide the amount of NADH increases rapidly and then starts to oscillate over a time period of approximately 1500 s. When glucose is used up, i.e. ethanol production stops, the NADH concentration slowly increases to a maximum. The ATP concentration, which is about 2.3 mM in the starved cells before addition of glucose, also starts to oscillate after addition of glucose and cyanide, but there is also a slow decrease in ATP concentration accompanying the oscillation. At about 1500 s ATP concentration reaches a minimum and then slowly starts to increase again. The slow increase in ATP concentration begins when glucose is exhausted and continues until the ATP concentration reaches the initial level in the starved cells (not shown in the graph). It should be noted here that the initial concentration of ATP in the starved cells is variable from batch to batch, but it is usually between 1.5 mM and 2.7 mM ATP. For comparison, time series of NADH autofluorescence, mitochondrial membrane potential (Δψm) and intracellular pH (pHi) are shown in Fig. 3. The mitochondrial membrane potential is measured using the carbocyanine dye DiOC2(3), while pHi was measured by incubating the yeast cells with the pH-sensitive dye 5- (and 6-)-carboxyfluorescein diacetate succinimidyl ester (CFDA-SE).7 The mitochondrial membrane potential rapidly increases following addition of glucose and cyanide and at the same time starts to oscillate (Fig. 3). The oscillation continues until glucose is used up, and then the potential slowly reverts to its original value (not shown in the graph). As for pHi it also increases rapidly after addition of glucose and cyanide, goes through a peak and then slowly decreases again, possibly due to acidification by the formation of carbon dioxide and carbonic acid7 through pyruvate decarboxylase. We previously showed that the rapid increase in pHi is most likely due to proton pumping by Pma1p.7
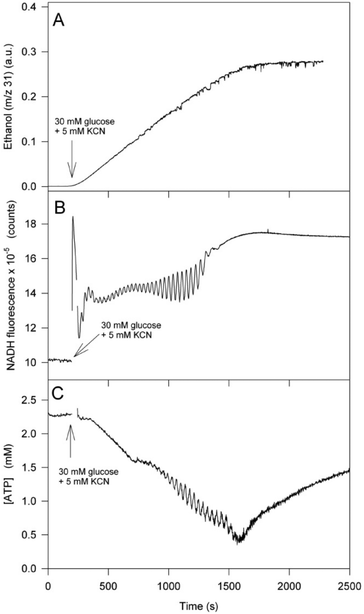 | ||
| Fig. 2 Time series of ethanol production, NADH fluorescence and intracellular ATP in the yeast strain X2180 with an oscillating glycolysis. (A) Glycolytic flux measured as the production of ethanol using membrane inlet mass spectrometry; (B) NADH autofluorescence; (C) intracellular ATP concentration measured using the ATP nanosensor as described in the Experimental section. Yeast cells (10% wet weight) were suspended in 100 mM potassium phosphate buffer, pH 6.8. At the time indicated by the arrow 30 mM glucose and 5 mM KCN were added to the suspension. | ||
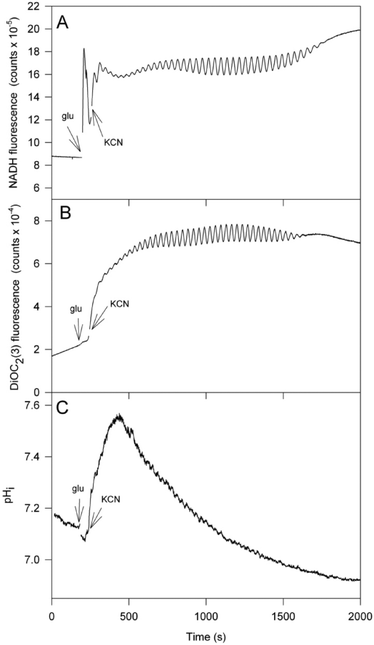 | ||
| Fig. 3 Oscillation of NADH, mitochondrial membrane potential (Δψm) and intracellular pH (pHi) in the yeast strain X2180. (A) NADH autofluorescence; (B) Δψm measured using the carbocyanine dye DiOC2(3); (C) pHi measured after incubation of the cells with the dye CFDA-SE. Experimental conditions as shown in Fig. 2. | ||
The overall slow decline in intracellular ATP after addition of glucose and KCN indicates that the consumption rate of intracellular ATP is greater than the ATP production rate. If the ATP production rate through glycolysis were equal to the ATP consumption rate, the ATP concentration would be stationary. In a previous report7 we presented evidence that the glycolytic oscillation is controlled by the mitochondrial F0F1 ATPase operating in the ATP hydrolysis mode and the Pma1p ATPase pumping protons out of the cell. We therefore ascribe at least part of the ATP consumption rate responsible for the slow decline in ATP to these two ATPases, and then attempt to unravel how much each ATPase contributes to this activity.
In order to obtain more knowledge about the role of the F0F1 ATPase and Pma1p in the glycolytic oscillation we performed measurements of glycolysis in yeast strains which carry mutations in the two ATPases. The first mutant is S. cerevisiae W1536 etr1Δ, which lacks the activity of mitochondrial 2-trans-enoyl-thioester reductase, the last enzyme of the mitochondrial fatty acid synthesis pathway.22 The phenotype of the yeast mutant includes the inability to produce sufficient levels of lipoic acid, form mitochondrial cytochromes, respire, or grow on non-fermentable carbon sources. The wild type showed glycolytic oscillation much like those shown in Fig. 2, although the amplitude of this oscillation was somewhat smaller than what was obtained with the strain X2180 (see Fig. S1, ESI†). Fig. 4 shows measurements of NADH, intracellular ATP and mitochondrial membrane potential in cells of etr1Δ following addition of 30 mM glucose and 5 mM KCN to the suspension. In this case no glycolytic oscillation was obtained and Δψm was very low. This suggests that the F0F1-ATPase activity is greatly reduced in these cells and is consistent with the absence of a functional mitochondrial respiratory chain in these cells.22 As for the ATP concentration it remains essentially constant at a level of about 1.5 mM. A constant ATP concentration means that the ATP consumption rate equals the ATP production rate. Since the glycolytic flux measured as the production of ethanol is the same in etr1Δ as in the wild type (see below) the ATP consumption rate in etr1Δ must be decreased compared to the wild type, consistent with the measurements of Δψm suggesting that etr1Δ lacks a functional F0F1 ATPase. It should be noted, though, that these measurements do not demonstrate explicitly that the ATPase is completely absent in the mitochondria of etr1Δ.
 | ||
| Fig. 4 Time series of (A) NADH, (B) intracellular ATP and (C) mitochondrial membrane potential in the etr1Δ mutant of the yeast strain W1536 after addition of glucose and KCN to the cell suspension. Other conditions as shown in Fig. 2 and 3. | ||
In the S. cerevisiae strain RS-72 the natural constitutive promoter of yeast PMA1 has been replaced by the galactose-dependent GAL1 promoter.23 When transferring these cells from galactose to glucose medium the cells stop growing when the preformed ATPase is diluted to 20% of normal. To confirm that Pma1p activity is indeed reduced in RS-72 cells grown on glucose we measured the intracellular pH in RS-72 cells grown on either galactose or glucose. Time series of intracellular pH together with NADH are shown in Fig. 5. We note that immediately after addition of glucose and KCN to the cells grown on galactose there is a rapid increase in pHi indicating some Pma1p activity.7 This corresponds to previous findings that glucose stimulates Pma1p activity.24–26 However, note that the increase in pHi in Fig. 5A is slower than that observed with the strain X2180 (Fig. 3). By contrast, in cells grown on glucose there is essentially no change in pHi after addition of glucose and KCN indicating that the Pma1p activity is strongly reduced in these cells. Note also that the initial pHi is close to the extracellular pH (6.8) in RS-72 cells grown on glucose indicating a poor control over pHi in these cells. RS-72 cells grown on galactose show an oscillating glycolysis much like that in the strain X2180, but, as the wild type W1536 strain, the amplitudes of the oscillation are reduced. It is unlikely that the changes in the behaviour of glycolysis and associated processes in the strain RS-72 can be ascribed to the change in carbon source. Transferring the strain X2180 from a growth medium containing mannose to a glucose-containing medium did not affect the glycolytic oscillations (Fig. S2, ESI†).
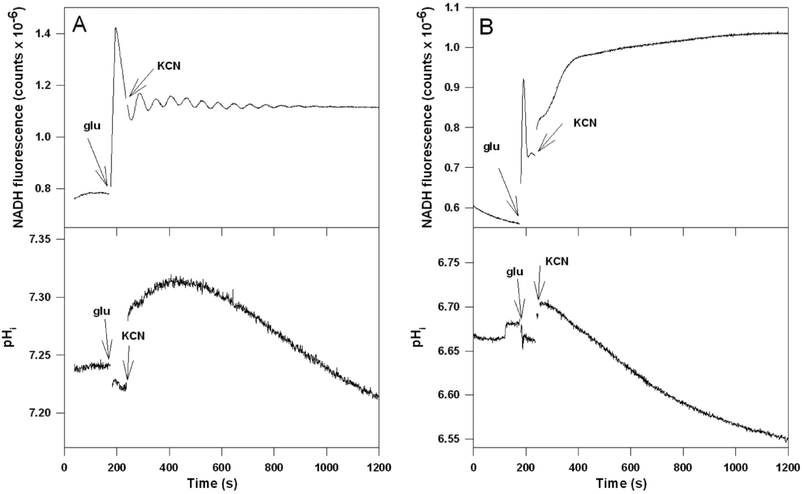 | ||
| Fig. 5 Time series of NADH and intracellular pH (pHi) in the strain RS-72 grown on (A) galactose and (B) glucose following addition of glucose and KCN to the cell suspension. At the indicated times 30 mM glucose and subsequently 5 mM KCN were added to a suspension (20% wet weight) of RS-72 cells. At the indicated times 30 mM glucose and 5 mM KCN were added to the cell suspension. Cell density 20% wet weight. | ||
Fig. 6 shows times series of intracellular ATP in the X2180 strain (Fig. 6A), RS-72 cells grown on galactose (Fig. 6B) and RS-72 cells grown on glucose (Fig. 6C). We note that the slow decrease in intracellular ATP is reduced in RS-72 cells grown on galactose compared to the strain X2180 and no oscillation in ATP concentration is visible. In cells grown on glucose, where the Pma1p is almost absent, the ATP concentration is essentially constant, again suggesting that the ATP consumption rate is identical to the ATP production rate. This indicates that the ATP consumption rate is reduced provided that the ATP production is the same in the two strains. Thus, from the above measurements of intracellular ATP we conclude that F0F1 ATPase and Pma1p both contribute significantly to the ATP consumption in the cells, but also other enzymes, like the vacuolar H+-ATPase,27 may contribute to the ATP consumption.
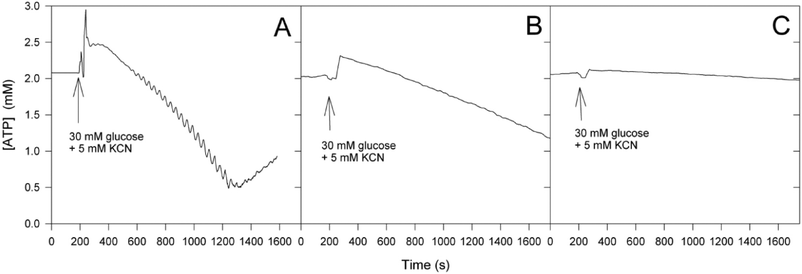 | ||
| Fig. 6 Time series of intracellular ATP in the strains (A) X2180, (B) RS-72 grown on galactose and (C) RS-72 grown on glucose after addition of glucose and KCN to the cell suspension. | ||
It could be argued that the rate of glycolysis was itself affected in some of the mutants used here, and that this could be the reason for the altered ATP dynamics observed in the etr1Δ mutant and the RS-72 strain grown on glucose. We therefore measured the glycolytic flux in all the strains used in the present study. The glycolytic flux was obtained as the rate of ethanol production and is shown in Fig. S3 (ESI†). We note that for the strains X2180, W1536 wild type and the etr1Δ mutant the glycolytic fluxes are the same. The glycolytic flux is somewhat reduced in the strain RS-72, both when grown on galactose and on glucose, compared to the strain X2180. However, this implies that the ATPase activity must be further reduced in RS-72 compared to the other strains.
Discussion
Our time-resolved measurements of ATP in intact yeast cells reveal new insights into the dynamics of intracellular ATP. We anticipated that the ATP level in the yeast cells would be low in the starved cells and then increase to a relatively stationary level after addition of glucose and KCN to the cell suspension. A stationary ATP concentration is obtained when the ATP production rate and the ATP consumption rate are equal. However, the initial ATP concentration turned out to be both relatively high and also variable in the starved cells. Furthermore, the ATP concentration is not oscillating around a stationary level as indicated by the previous measurements by Richard et al.8 but around a slowly declining ATP level, which reaches a minimum when glucose is used up. However, it should be noted that the data presented by Richard et al.8 only span 3 periods of oscillation and these data (Fig. 2 in ref. 8) do indeed evidence an overall slow decline in ATP. A decline in ATP concentration implies that the consumption is greater than the production. A slow decline in intracellular ATP concentration was also found in measurements performed by quenching the cells, extracting the cell material and measuring ATP using a luciferase assay.12 Thus, our ATP nanosensor seems to determine the temporal behaviour of intracellular ATP fairly accurately. After glucose is used up the ATP concentration slowly increases again towards the initial level in the starved cells, probably due to a slow breakdown of glycogen or trehalose. The latter implies that the ATP consuming reactions are tightly regulated as an increase in ATP implies that ATP production is greater than ATP consumption. Thus, exhaustion of glucose is likely to be accompanied by a switch off in ATPase activity.Our ATP measurements do not allow us to directly determine the individual contributions from the various ATP producing and ATP consuming processes contributing to the overall ATP dynamics. A steady state or a gradual slow change in ATP concentration is determined by the difference in rates of ATP production and ATP consumption. The ATP production rate can indirectly be determined from the glycolytic flux measured as the ethanol production rate (Fig. S3, ESI†) and hence the ATP consumption rate can be inferred from the change in ATP concentration. From this it is evident that in the strain W1536 etr1Δ, lacking functional mitochondria and F0F1 proton pumping activity, ATP consumption is decreased compared to the strain X2180. Similarly, in the strain RS-72 grown on glucose there is a dramatic decrease in ATP consumption which is even larger than in the strain etr1Δ, since the glycolytic flux and hence also the ATP production is reduced in RS-72 compared to X2180 (Fig. 6 and Fig. S3, ESI†).
Fig. 7 summarizes the conclusions made from the present and previous7,12 studies. Due to the inhibition of respiration, glycolysis is the main source of ATP in the cells. The ATP produced in glycolysis is consumed in other cellular processes. Since the cells studied here are non-growing, the main processes responsible for ATP consumption are those involved in maintaining the cellular milieu. Some of these are the proton-pumping ATPases such as Pma1p, which is responsible for the regulation of pHi and maintaining the plasma membrane potential,28 and the F0F1 ATPase which catalyzes the hydrolysis of ATP in order to maintain a mitochondrial membrane potential when respiration is blocked. Other ATPases such as V-ATPase may also contribute to the overall ATP consumption. The ATPase activity, in turn, is under strict control. In the absence of glucose ATP consumption is very low. This cannot be due to a lack of ATP in the starved cells as seen for example in cells of lactic acid bacteria29 since the ATP concentration is high before addition of glucose. Thus, we conclude that ATPase activity is, directly or indirectly, regulated by glucose. This is in accord with earlier reports showing that the activity of Pma1p is dependent on the presence of glucose.24–26 Although the precise mechanism by which glucose regulates Pma1p activity is not known, mass spectrometric measurements have shown that the activation of the enzyme by glucose involves phosphorylation of a serine and a threonine residue in the C-terminal part of the ATPase.24 An additional or possibly connected regulatory mechanism relevant on the timescale of our observations is the activation of Pma1p mediated by disruption of physical interactions of the enzyme with inhibitory acetylated tubulin.25 The relatively fast response of Pma1p to glucose which we recorded makes a contribution of gene expression regulation effects30 unlikely.
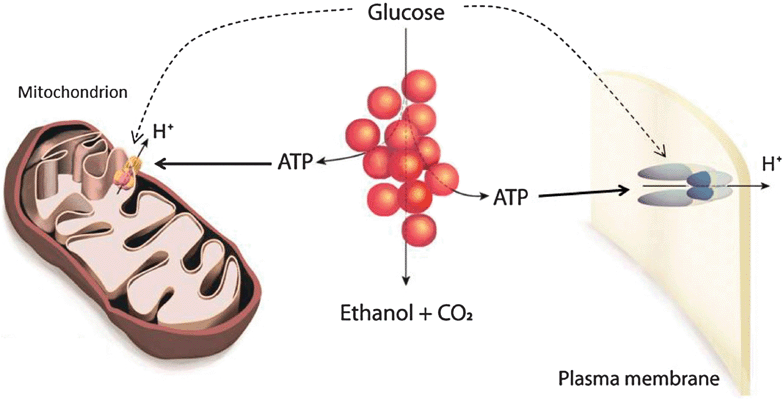 | ||
| Fig. 7 Model of the interaction of glycolysis and membrane bound ATPases. The figure shows glycolysis, the yeast plasma membrane H+-ATPase (Pma1p, right) and the mitochondrial F0F1 ATPase (left). Glycolysis provides ATP for the proton pumping catalyzed by the two ATPases. The rate of ATP hydrolysis in turn determines if glycolysis is oscillating. The activity of the two ATPases is controlled directly or indirectly by the presence of glucose. | ||
The effects of the reduced activities of F0F1 ATPase in the etr1Δ mutant and Pma1p in the RS-72 strain grown on glucose, respectively, are in accordance with the earlier results indicating that these two enzymes are highly important for the ATP dynamics.7,12 The change in intracellular ATP concentration in the etr1Δ mutant, after addition of glucose and cyanide, is essentially the same as in wild type cells incubated with sodium azide.12 Azide is known to inhibit the ATP hydrolysis by F0F1 ATPase.31 Thus, when respiration is inhibited, F0F1 ATPase-catalyzed hydrolysis of ATP contributes significantly to the overall ATP consumption rate.
As for the oscillatory dynamics observed in the strains X2180, the wild type W1536 and in RS-72 grown on galactose our results support earlier suggestions that the activity of the Pma1p and F0F1-ATPases is important for oscillation in glycolysis to occur. For example, in RS-72 grown on galactose the Pma1p activity is lower than in the strain X2180 and the corresponding ATP consumption rate is also lower (Fig. 5 and 6). This is probably the reason why glycolytic oscillation in RS-72 grown on galactose has a smaller amplitude and requires higher cell densities. Likewise in the wild type W1536 strain the F0F1 activity is slightly reduced compared to the corresponding activity in the strain X2180 (Fig. S1, ESI† and Fig. 3) and consequently the glycolytic oscillation occurs with lower amplitudes also in the wild type W1536 strain. It is presently not clear if it is the reduction in overall ATP hydrolysis rate that results in the disappearance of the oscillation or if F0F1 ATPase and Pma1p play more specific roles in the mechanism generating the oscillation. It is interesting to note, however, that previous results7 suggest that partial inhibition of the Pma1p ATPase may result in an increase in the activity of the F0F1 ATPase, resulting in an increased mitochondrial membrane potential and an increase in the amplitude of the oscillation of Δψm.
The present results clearly demonstrate that time-resolved measurements of intracellular metabolites in intact cells can provide useful information about cellular processes and their regulation in vivo. So far only a few metabolites have been measured with high time resolution in non-steady state situations, and in those cases where such measurements have been made they have been limited to measuring perturbations away from a steady state over a relatively short period of time.32–35 For example, the temporal behaviour of ATP observed with our ATP sensor in the wild types of yeast cells clearly demonstrates that the ATP concentration in the cells, disregarding the oscillatory behaviour, does not approach a stationary state. Thus, if our measurements of intracellular ATP had relied on a single measurement of ATP using quenching of the cells and analysis of subsequent cell extracts different ATP concentrations would have been obtained, depending on the time after addition of glucose at which the measurements were made.
Acknowledgements
We thank Anita Lunding for skilled technical assistance. This research was supported by the Danish Research Council for Technology and Production (grant no 274-07-0172). The work is performed in the LiMeS collaborative network.Notes and references
- D. Lloyd and D. B. Murray, Trends Biochem. Sci., 2005, 30, 373 CrossRef CAS
.
- B. P. Tu and S. L. McNight, Nat. Rev. Mol. Cell Biol., 2006, 7, 696 CrossRef CAS
- E. Klipp, Yeast, 2007, 24, 943 CrossRef CAS
- A. Tenghold and E. Gylfe, Mol. Cell. Endocrinol., 2009, 297, 58 CrossRef
- P. Richard, FEMS Microbiol. Rev., 2003, 27, 547 CrossRef CAS
- A. K. Poulsen, F. R. Lauritsen and L. F. Olsen, FEMS Microbiol. Lett., 2004, 236, 261 CAS
- L. F. Olsen, A. Z. Andersen, A. Lunding, J. C. Brasen and A. K. Poulsen, Biophys. J., 2009, 96, 3850 CrossRef CAS
- P. Richard, B. Teusink, M. B. Hemker, K. van Dam and H. V. Westerhoff, Yeast, 1996, 12, 731 CrossRef CAS
- A. Z. Andersen, A. K. Poulsen, J. C. Brasen and L. F. Olsen, Yeast, 2007, 24, 731 CrossRef CAS
- M. F. Madsen, S. Dano and P. G. Sørensen, FEBS J., 2005, 272, 2648 CrossRef CAS
- F. Hynne, S. Danø and P. G. Sørensen, Biophys. Chem., 2001, 94, 121 CrossRef CAS
- V. C. Özalp, T. R. Pedersen, L. J. Nielsen and L. F. Olsen, J. Biol. Chem., 2010, 285, 37579 CrossRef
- V. C. Özalp, L. J. Nielsen and L. F. Olsen, ChemBioChem, 2010, 11, 2538 CrossRef
- Z. W. Tang, P. Mallikaratchy, R. H. Yang, Y. M. Kim, Z. Zhu, H. Wang and W. H. Tan, J. Am. Chem. Soc., 2008, 130, 11268 CrossRef CAS
- C. Daubresse, C. Grandfils, R. Jerome and P. Teyssie, J. Colloid Interface Sci., 1994, 168, 222–229 CrossRef CAS
- A. K. Poulsen, A. Z. Andersen, J. C. Brasen, A. M. Scharff-Poulsen and L. F. Olsen, Biochemistry, 2008, 47, 7477 CrossRef CAS
- L. J. Nielsen, L. F. Olsen and V. C. Özalp, ACS Nano, 2010, 4, 4361 CrossRef CAS
- D. H. J. Bunka and P. G. Stockley, Nat. Rev. Microbiol., 2006, 4, 588 CrossRef CAS
- T. Mairal, V. C. Özalp, P. L. Sanchez, M. Mir, I. Katakis and C. K. O'Sullivan, Anal. Bioanal. Chem., 2008, 390, 989 CrossRef CAS
- A. D. Ellington and J. W. Szostak, Nature, 1990, 346, 818 CrossRef CAS
- D. Schneider, C. Tuerk and L. Gold, J. Mol. Biol., 1992, 228, 862 CrossRef CAS
- J. M. Torkko, K. T. Koivuranta, I. J. Miinalainen, A. I. Yagi, W. Schmitz, A. J. Kastaniotis, T. T. Airenne, A. Gurvitz and J. K. Hiltunen, Mol. Cell. Biol., 2001, 21, 6243 CrossRef CAS
- A. Cid, R. Perona and R. Serrano, Curr. Genet., 1987, 12, 105 CrossRef CAS
- S. Lecchi, C. J. Nelson, K. E. Allen, D. L. Swaney, K. L. Thompson, J. J. Coon, M. R. Sussman and C. W. Slayman, J. Biol. Chem., 2007, 282, 35471 CrossRef CAS
- A. N. Campetelli, G. Previtale, C. A. Arce, H. S. Barra and C. H. Casale, FEBS J., 2005, 272, 5742 CrossRef CAS
- J. Ariño, J. Ramos and H. Sychrová, Microbiol. Mol. Biol. Rev., 2010, 74, 95 CrossRef
- K. J. Parra and P. M. Kane, Mol. Cell. Biol., 1998, 18, 7064 CAS
- R. Serrano, Arch. Biochem. Biophys., 1983, 227, 1 CrossRef CAS
- A. Z. Andersen, A. L. Carvalho, A. R. Neves, H. Santos, U. Kummer and L. F. Olsen, Comput. Biol. Chem., 2009, 33, 71 CrossRef CAS
- R. Serrano, FEBS Lett., 1983, 156, 11 CrossRef CAS
- D. A. Harris, Biochim. Biophys. Acta, Bioenerg., 1989, 974, 156 CrossRef CAS
- J. Berg, Y. P. Hung and G. Yellen, Nat. Methods, 2009, 6, 161 CrossRef CAS
- J.-H. Kim, J.-H. Ahn, P. W. Barone, H. Jin, J. Zhang, D. A. Heller and M. S. Strano, Angew. Chem., Int. Ed., 2010, 49, 1456 CAS
- S. Kunzelmann and M. R. Webb, J. Biol. Chem., 2009, 284, 33130 CrossRef CAS
- H. Imamura, K. P. H. Nhat, H. Togawa, K. Saito, R. Iino, Y. Kato-Yamada, T. Nagai and H. Noji, Proc. Natl. Acad. Sci. U. S. A., 2009, 106, 15651 CrossRef CAS
Footnotes |
| † Electronic supplementary information (ESI) available: Fig. S1–S3. See DOI: 10.1039/c1ib00108f |
| ‡ Present address: Institute for Polymer Materials (Polymat), University of the Basque Country (UPV/EHU), Avda. de Tolosa 72, E-20018 Donostia-San Sebastián, Spain. |
| This journal is © The Royal Society of Chemistry 2012 |