Systematic optimization of a biocatalytic two-liquid phase oxyfunctionalization process guided by ecological and economic assessment†
Daniel
Kuhn
a,
Mattijs K.
Julsing
a,
Elmar
Heinzle
b and
Bruno
Bühler
*a
aLaboratory of Chemical Biotechnology, Department of Biochemical and Chemical Engineering, Technische Universität Dortmund, Emil-Figge-Str. 66, 44221, Dortmund, Germany. E-mail: bruno.buehler@bci.tu-dortmund.de; Fax: +49 231 7557382; Tel: +49 231 7557384
bBiochemical Engineering Institute, Saarland University, Campus A 1.5, 66123, Saarbrücken, Germany
First published on 5th January 2012
Abstract
Next to economic success, ecological considerations have become increasingly important for companies synthesizing various compounds ranging from bulk chemicals to pharmaceuticals. In this context, the economic and ecological feasibility of asymmetric biocatalytic styrene epoxidation has previously been investigated and compared to chemical alternatives. Although the biotechnological two-liquid phase approach was found to be highly interesting in economic terms, the ecological performance is restrained by the applied organic carrier solvent bis(2-ethylhexyl)phthalate, which is toxic to humans and produced from non-renewable resources. As an alternative carrier solvent, the biodiesel constituent ethyl oleate was tested. Furthermore, the switch from glucose to glycerol as a carbon and energy source was investigated, the latter being a cheap abundant resource, as it is a waste product of the biodiesel and soap industries. Both strategies slightly reduced the productivity and final product titer. An ecological and economic assessment on process level, however, revealed a superior environmental performance (by 13%) with ethyl oleate as the extractive solvent, at the expense of slightly reduced economics (by 9%), whereas glycerol use reduced the performance with respect to both aspects. Based on available data, the application of resting cells was evaluated, providing the opportunity of more efficient carbon utilization via decoupling of growth and biotransformation. Their stability is, however, yet to be improved to achieve competitiveness. In general, this study underlines the potential of ecological and economic assessments for systematic process intensification. Even if advantages of proposed changes seem obvious, their true suitability can only be judged by detailed economic and ecological analyses at the process level.
Introduction
Biocatalysis offers new opportunities in the synthesis of industrial goods, especially when the target products are difficult to obtain by traditional chemical means.1–4 In order to profit from the great promises of biocatalysis, it is essential to develop these ideas and have them implemented in industrial processes,5,6 which are still scarce compared to the respective scientific publication activity. In this respect, ecological and economic assessment methodologies7–10 can support decision-making and knowledge-based engineering strategies.9,11 For early development phases, simple and flexible methodologies coping with limited information are required,9,12 such as the calculation of environmental indices on the basis of ABC classification.9The latter assessment tool has been used for the ecological and economic evaluation of biocatalytic oxyfunctionalization using whole microbial cells in a two-liquid phase system, including a comparison against chemical process alternatives.13 Specifically, the biocatalytic approach was based on recombinant Escherichia coli, harboring the styrene monooxygenase StyAB of the Pseudomonas sp. strain VLB120 and catalyzing the asymmetric epoxidation of styrene to enantiopure (S)-styrene oxide (e.e. >99.5%).14–17 Oxygenase catalysis in whole cells is generally preferred over isolated enzyme catalysis due to the cofactor (e.g., NADH) dependency, low stability in isolated form, and often multicomponent nature of these enzymes.18–20 The toxicity of hydrophobic substrates and products can be alleviated by the use of a second immiscible organic carrier solvent, which serves as a substrate reservoir and product sink.21–23 For asymmetric styrene epoxidation, this biotechnological setup proved to be more cost efficient than three chemical alternatives.13 From an environmental point of view, however, the biotechnological process was inferior to one of the investigated chemical alternatives, mainly due to the environmental burden imposed by the solvent bis(2-ethylhexyl)phthalate (BEHP), which is toxic to humans and is produced from petroleum-based resources. The solvent is thus the obvious target for improving the ecological performance of biotechnological two-liquid phase processes. Next to the organic phase, the carbon and energy source (e.g., glucose) was found to be critical with regard to production costs. Finding either cost-saving alternatives or improving the product yield on the energy source will reduce related expenses. The latter can be achieved by the timely separation of growth and biotransformation phases, e.g., by applying the biocatalyst in a resting state.24–26 Thereby, the cells remain metabolically active, but are not able to produce biomass due to a nutrient limitation, such as lack of nitrogen sources in the medium. Hence, energy metabolism can be maximally exploited for the biotransformation (i.e., cofactor regeneration). Indeed, application of the biocatalyst in a resting state led to a 3.3 and 1.9-fold improvement in average product yields on glucose and maximum specific activities, respectively, confirming the attractiveness of this approach for asymmetric styrene epoxidation.26
The aim of this study was the optimization of the ecological and economic performance of the biocatalytic asymmetric styrene epoxidation. Replacement of the organic solvent BEHP by the renewable biodiesel component ethyl oleate (EO) was therefore investigated, as well as glycerol as a promising carbon source, which is in abundance as it is the waste product of soap and biodiesel industries. The suitability of these reaction engineering approaches was economically and ecologically assessed in detail. Moreover, biotransformations based on resting cells were included in the assessment. To date, such case studies systematically assessing the advantages and challenges during (bio-)process development are limited in number despite their potential for the implementation of bio-based reactions in the chemical industry.5,11 Finally, this paper shows the potential of the systematic assessment of lab-scale optimization studies for the implementation of bioprocesses on an industrial scale.
Results and discussion
Investigation of different organic carrier solvents and carbon sources for biocatalytic styrene epoxidation in a two-liquid phase system
In consideration of the recent finding that BEHP compromises the ecological viability of the biocatalytic two-liquid phase process for styrene epoxidation, the selection of the organic solvent was revisited in this study. So far, BEHP was the best performing organic phase in terms of efficient product extraction, low foaming tendency, and non-toxicity for microbes. Nevertheless, the maximum achievable (S)-styrene oxide titer was still restricted by the toxic effects of styrene oxide and possibly 2-phenylethanol.13,27 This stresses the importance of a high extraction efficiency by the organic solvent for these products in order to keep their aqueous concentration low. The fatty acid ester EO was identified as a promising alternative for BEHP, because of its favorable partition coefficients (comparable to BEHP, Table 1). EO is the major component of canola-based biodiesel (55–65 wt%)28 and is considered as an attractive solvent due to its biodegradability, non-toxic nature, and the production from renewable feed stocks.28–30 EO was tested as an organic solvent in an identical setup and compared to the BEHP-based process (Fig. 1A,B, Table 2).| BEHP27 | EO | |
|---|---|---|
| Styrene | 2990 ± 200 | 2600 ± 490 |
| Styrene oxide | 170 ± 20 | 138 ± 13 |
| 2-Phenylethanol | 6.0 ± 0.5 | 5.9 ± 1.1 |
| BEHP | EO | BEHP | EO | Resting cellsa | Resting cellsa | ||
|---|---|---|---|---|---|---|---|
| Glucose | Glucose | Glycerol | Glycerol | 10 gCDW L−1 | 30 gCDW L−1 | ||
| Cell mass is given in gram of cell dry weight (gCDW).a Data source: resting cell biotransfromations presented in Fig. 1 in Julsing et al.26b Average product yield on carbon source is calculated considering the amount of carbon source consumed during biotransformation. | |||||||
| Biotransformation time | [h] | 8 | 8 | 8 | 9 | 10 | 7 |
| Initial styrene | [mM] | 695 | 718 | 721 | 695 | 729 | 672 |
| Final styrene | [mM] | 21 | 149 | 114 | 165 | 315 | 173 |
| Final (S)-styrene oxide | [mM] | 604 | 445 | 490 | 412 | 325 | 412 |
| Final 2-phenylethanol | [mM] | 69 | 40 | 49 | 36 | 31 | 33 |
| Cell concentration after batch | [gCDW L−1] | 5.4 | 6.6 | 5.5 | 6.7 | — | — |
| Max. cell concentration | [gCDW L−1] | 39.3 | 32.8 | 34.9 | 37.6 | 9.8 | 30.3 |
| C-source fed (fed-batch, biotransf.) | [g] | 113.7 | 109.1 | 93.6 | 123.6 | — | — |
| C-source fed (biotransf.) | [g] | 91.0 | 85.6 | 63.4 | 93.3 | 20.0 | 39.3 |
| C-source remaining | [g Laq−1] | 7.4 | 2.3 | 1.0 | 1.1 | 6.5 | 13.7 |
| Acetate formed | [g Laq−1] | 3.6 | 6.0 | 5.3 | 4.7 | 1.0 | 2.4 |
| Ave. productivity | [g Ltot−1 h−1] | 4.54 | 3.34 | 3.68 | 2.75 | 1.95 | 3.53 |
| Max. productivity | [g Ltot−1 h−1] | 6.57 | 4.63 | 4.71 | 3.87 | 3.91 | 8.70 |
| Max. spec. epoxidation rate | [U gCDW−1] | 56 | 44 | 40 | 36 | 104 | 80 |
| Product yieldb | [mol mol−1] | 1.30 | 0.96 | 0.72 | 0.41 | 4.34 | 2.89 |
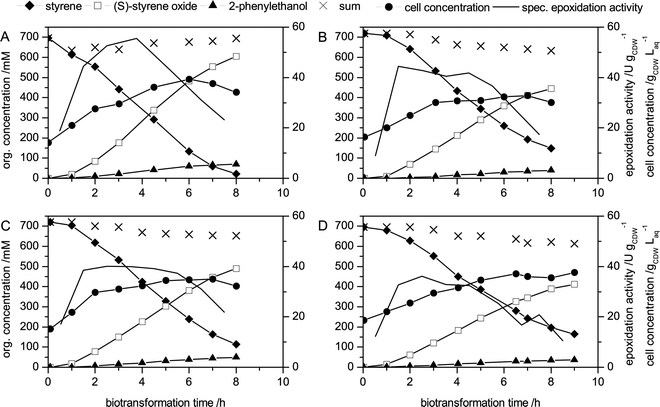 | ||
| Fig. 1 Styrene epoxidation by E. coli JM101 (pSPZ10) during two-liquid phase biotransformation with different carbon sources and organic carrier solvents. (A) BEHP/glucose setup as published before,13 (B) EO/glucose; (C) BEHP/glycerol, (D) EO/glycerol. At 0 h, the biotransformation was initiated by the addition of 1 L of the respective carrier solvent containing 80 mL styrene (∼695 mM) and 10 mL octane to induce styAB expression. During the biotransformation, the carbon source feed rate was kept constant and was not reduced until the carbon source started to accumulate in the aqueous phase at the end of the biotransformation. | ||
As compared to biotransformations with BEHP, maximal epoxidation activities were about 20% lower using EO. Final product titers, however, accounted for 445 mM (53.5 g Lorg−1), which is 159 mM lower than with BEHP. This lower product titer is likely to be associated with the lower partition coefficient of EO for styrene oxide (Table 1), resulting in higher aqueous concentrations at identical overall concentrations in the two-liquid phase system. As a consequence, the biocatalyst was toxified and thus inactivated at lower overall styrene oxide titers. At the end of the biotransformation, cellular metabolism broke down before the styrene was completely converted.
Next to the carrier solvent, the carbon source was found to be an important raw material cost factor for styrene epoxidation.13 With respect to carbon source selection, the ability of E. coli to grow on glycerol as the sole energy and carbon source is an interesting feature. Glycerol bears a considerable economic and ecological potential as it is an inevitable by-product of the biodiesel and soap industries.31–33 Additionally, the high reduction degree of the carbon atoms in glycerol compared to common sugars may foster the regeneration of reducing equivalents,34 which was found to restrict styrene epoxidation in growing cells.35 Therefore, glycerol was investigated as the sole source for carbon and energy during styrene epoxidation (Fig. 1C, Table 2) The performance of the BEHP-based biotransformation was lower with glycerol as compared to glucose, with lower final product titers and lower specific activities at similar cell concentrations. Towards the end of the biotransformation, the activities decreased and ceased due to long exposure to high product concentrations, resulting in incomplete styrene conversion.
The combination of EO as the extractive solvent and glycerol as the carbon source also allowed productive biotransformation, but resulted in the lowest activities and final product titer after a slightly prolonged biotransformation (Fig. 1D, Table 2). The slower styrene oxide accumulation was disadvantageous for the final product titer, because the cells were exposed to high concentrations for a longer time.
The glucose/BEHP setup showed the best performance in terms of productivities and final product titers (Table 2). Although both changes, from BEHP to EO and from glucose to glycerol, had a negative effect on biotransformation performance, styrene epoxidation at lab-scale using EO and/or glycerol still appeared to achieve considerable productivities. Therefore, the environmental and economic impact of these changes on the process level was investigated in detail and compared to the original setup using BEHP and glucose. Furthermore, a recently published resting cell approach, using a similar setup with BEHP and enabling a high styrene oxide yield on glucose, was included in the assessment. With respect to the enantioselectivity, e.e. values of 99.5, 99.4, and 99.7% have been found for the BEHP/glucose, BEHP/glycerol, and EO/glucose setups, respectively, indicating that these changes in process setup did not influence the enantioselectivity of the biocatalyst. This confirms earlier findings that variations in biocatalyst formulation (isolated StyAB, resting cells, growing cells) and in reaction conditions (cofactor regeneration system, presence of a solvent, phase ratio, scale) do not affect the e.e. of styrene epoxidation catalyzed by StyAB.14–16,36–40
Process schemes for styrene epoxidation catalyzed by growing cells
For the economic and ecological assessment of the different biotransformation setups with growing cells (Fig. 1; Table 2), detailed mass balances including upstream and downstream operations are required. These were obtained by the software SuperPro Designer, which allows the design of manufacturing plants on the basis of flow sheets.41 The flow sheet used in this study was described before13 and is provided in the supplementary information.† Details of the individual unit operations are described in the experimental part and the paper indicated above. The downstream processing with EO as an organic phase was identical to the one with BEHP, which is due to the comparable distillation properties of these solvents. The production scale was set at 1000 tons per year, which is typical for the synthesis of comparable chiral compounds.42,43Process schemes for styrene epoxidation catalyzed by resting cells
With respect to the product yield on glucose during styrene epoxidation, resting cells have been proven to be clearly superior to growing cells.26 Whereas growing E. coli JM101 (pSPZ10) exhibited an average yield of 1.30 mol molglucose−1,13 the same strain reached an average yield of 4.34 mol molglucose−1 in a resting state.26 This efficient carbon source utilization makes resting cell biotransformations worth considering for ecological and economic assessment. The reaction stoichiometries for resting cell bioconversions were based on data derived from Julsing et al. Two experimental data sets with E. coli JM101 (pSPZ10) as biocatalyst were taken into consideration, which differed in the applied biomass concentration, 10 and 30 gCDW L−1 (CDW: cell dry weight). Since BEHP and glucose were used as organic solvent and carbon source, respectively, upstream and downstream processing is identical to the respective growing cell setup. The operation of the main fermenter differs and can be divided in to a batch (8 h), an induction (4 h), and a biotransformation phase (10 and 7 h with 10 and 30 gCDW L−1, respectively). For the 30 gCDW L−1 setup, a fed-batch phase additionally is introduced between the batch and the induction phase, in order to reach the biomass indicated. The switch from the induction to the biotransformation phase requires a nutrient limitation in the medium to establish the resting cell state. On the lab-scale, cells were harvested by centrifugation, washed, and resuspended in fresh medium lacking a nitrogen source.26 On the industrial scale such a procedure is not feasible.44 However, the cells do not need to be separated from the growth medium to achieve the resting state. For process evaluation, a process scheme was assumed, in which the resting cell state is induced by depletion of nitrogen within the growth medium.44 Aside from the described deviations, the unit operations for the resting cell plant were identical to the growing cell setup. In the following section, all the biocatalytic (S)-styrene oxide process alternatives are ecologically and economically assessed and their performances compared and discussed in detail.Process assessment - resource consumption and waste generation
The calculation of mass-balances is the first step in the evaluation of a process and often a first indication for its economic and ecological performance. Fig. 2 summarizes the substrate consumption (input) and the waste generation (output) of the investigated (S)-styrene oxide production processes.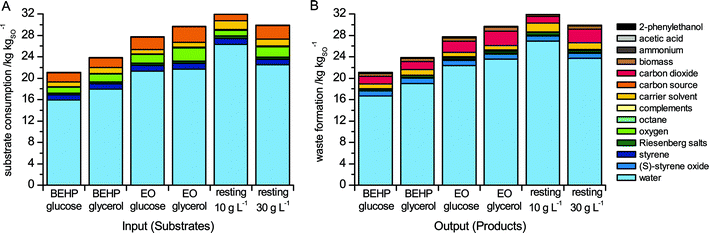 | ||
| Fig. 2 Mass-balances of resource consumption (A) and waste generation (B). Abbreviation: resting, resting cell biotransformation with biomass concentration indicated below. | ||
The use of resources was most efficient in the BEHP/glucose setup with growing cells, where 21.1 kg of substrates (15.9 kg water) were used for the production of 1 kg of (S)-styrene oxide (kgSO). In correlation with the lower productivities obtained, the growing cell setups based on BEHP/glycerol, EO/glucose, and EO/glycerol consumed 13, 32, and 42% more substrates per kgSO produced, respectively. Both biotransformations with resting cells were clearly inferior to the equivalent growing cell counterpart (BEHP/glucose) with a 42–52% higher resource demand. This is due to the relatively high resource demand for biomass synthesis overriding benefits from the excellent product yields on glucose of resting cells during biotransformation. The low catalytic stability of resting cells, resulting in lower overall productivities and product titers,26 is an important factor causing this high resource demand. Reduction of the biomass concentration from 30 to 10 gCDW L−1 decreases the growth-related and thus the total glucose demand, but affects the productivity and the product titers to such an extent that the overall mass balance is even worse.
From a mass balance perspective, the process based on BEHP, glucose, and growing cells performs best. This, however, does not necessarily reflect the ecological and economical impact of the investigated changes. In the following, this impact is quantified by means of weighing environmental burdens and costs caused by the different substrate and waste streams.
Process assessment - environmental impact potential
The environmental impact potential of a process is not only defined by the amount of resources consumed and waste formed but also by the individual impact of the materials involved. Various ecological categories are characterized using an ABC classification system that is providing a basis to estimate ecological weighting factors that are used together with the material balance to estimate an overall environmental index (see experimental for details).9,45,46 The results achieved with this assessment method are presented in Fig. 3.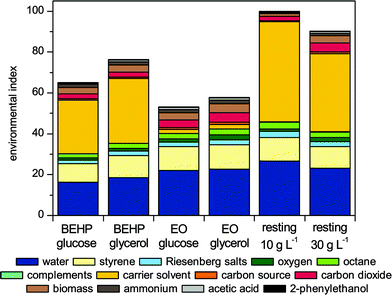 | ||
| Fig. 3 Environmental indices for the biocatalytic styrene epoxidation processes. Abbreviation: resting, resting cell biotransformations with biomass concentration indicated below. | ||
For the two-liquid phase styrene epoxidation with growing cells, the organic solvent BEHP already has been identified as the most critical factor from an ecological perspective.13 This was verified in this study as the environmental indices of all BEHP-based processes were dominated by the organic phase, contributing to approximately 40% of the total environmental indices. A switch to the biodiesel component EO reduces the impact of the organic phase significantly from 26.2 to 2.1 and 31.7 to 2.2 for the glucose- and glycerol-based setups, respectively. EO is not toxic and its production from renewable resources requires only moderate land use (‘B’-classification), whereas BEHP requires more steps for its synthesis and requires fossil raw materials (‘B’-classification) and is toxic (‘A’-classification). Thus, the environmental compatibility of the total process was enhanced as displayed by the reduction of the total environmental indices. Opening the scope for the application of biodiesel provides new opportunities towards more environmentally friendly processes by replacing harmful solvents.28,29,47 The applicability of EO in bioprocesses is affirmed by the absence of any radical polymerization during biotransformations with intense aeration (results not shown). Such broader application may support economics of biodiesel production in general by accessing new markets, beside the usage as fuel.47
A major difference between glycerol and glucose is their different production routes. The assessment of the agricultural production of glucose illustrates the challenge in judging substrates from differing origins. Agriculture involves numerous grey inputs, which are environmental burdens arising during the preparation of the input compounds, before they enter the examined process.46 Here, complexity of synthesis, raw material availability, and land use were considered for assessing the grey inputs already during early process development phases. With increasing detail level, other indicators may be included, such as the utilization of fertilizer, the probability and severity of accidents, emission by vehicles during farming and transportation.7,48 With respect to land use, glucose as well as glycerol are regarded as environmentally friendly by the ABC classification system.49 As a consequence, the contribution of the carbon source to the total environmental indices for styrene epoxidation is relatively small. The higher substrate demand of glycerol-grown cells increases the respective environmental indices. Hence, the switching of the carbon source is not beneficial for the overall ecological performance. However, it should be noted that the use of glycerol derived as a by-product of another production process reduces the environmental burden of the preceding process and might therefore be ecologically attractive.
The application of resting cells is inferior in terms of ecological aspects compared to the growing cell setups. In accordance to the mass balances, the 10 gCDW L−1 setup suffers more from the lower productivity during the biotransformation than it profits from saving growth-related substrates. The application of a higher cell density of 30 gCDW L−1 improves the environmental performance. The environmental index, however, was 1.4 times higher compared to the equivalent with growing cells, correlating with the higher resource demand (Fig. 2).
In summary, using EO instead of BEHP as extractive organic phase significantly improved the ecological performance of biocatalytic styrene epoxidation, whereas the application of glycerol and resting cells was neutral or negative with respect to ecological efficiency.
Process assessment - economic potential
Equally important to the environmental potential is the economic feasibility of the different styrene epoxidation setups under investigation, as the profitability of a process should not significantly be compromised by operational changes. Annual production costs are a key parameter and are represented in Fig. 4 and Table 3 for a 1000 t a−1 scale.| BEHP glucose | BEHP glycerol | EO glucose | EO glycerol | Resting cells 10 gCDW L−1 | Resting cells 30 gCDW L−1 | |
|---|---|---|---|---|---|---|
| k$ | k$ | k$ | k$ | k$ | k$ | |
| a Average annual installment payment over 10 years includes installment of direct fixed capital (interest rate: 9% over a period of 10 years) and installment of working capital (interest rate: 12%; period: 6 years). | ||||||
| Facility dependent costs | 3179 | 3269 | 3426 | 3503 | 3761 | 3612 |
| Depreciation | 1808 | 1865 | 1964 | 2012 | 2174 | 2081 |
| Insurance | 190 | 196 | 207 | 212 | 229 | 219 |
| Local taxes | 381 | 393 | 413 | 424 | 458 | 438 |
| Factory expenses | 300 | 300 | 300 | 300 | 300 | 300 |
| Maintenance | 500 | 515 | 542 | 555 | 600 | 574 |
| Raw materials | 2862 | 3265 | 3227 | 3652 | 3818 | 3938 |
| Ammonium | 17 | 19 | 19 | 23 | 7 | 17 |
| Carbon source | 862 | 934 | 1168 | 1469 | 618 | 1291 |
| Organic phase | 1170 | 1413 | 1094 | 1187 | 2183 | 1705 |
| Octane | 42 | 52 | 57 | 62 | 78 | 62 |
| Riesenberg salts | 117 | 140 | 153 | 166 | 210 | 166 |
| Styrene | 632 | 680 | 703 | 707 | 699 | 665 |
| Thiamine | 5 | 5 | 6 | 6 | 8 | 7 |
| Trace elements | 1 | 1 | 1 | 1 | 1 | 1 |
| Magnesium sulfate | 14 | 19 | 23 | 28 | 11 | 21 |
| Sodium hydroxide | 2 | 2 | 3 | 3 | 3 | 3 |
| Labor | 2801 | 2793 | 2787 | 2766 | 2731 | 2745 |
| Laboratory/QC | 420 | 419 | 418 | 415 | 410 | 412 |
| Consumables | 251 | 218 | 367 | 341 | 171 | 358 |
| Waste treatment | 259 | 298 | 314 | 354 | 353 | 356 |
| Utilities | 437 | 506 | 576 | 633 | 771 | 640 |
| Total unit production costs |
10![[thin space (1/6-em)]](https://www.rsc.org/images/entities/b_char_2009.gif) 209 209
|
10768
|
11115
|
11664
|
12015
|
12061
|
| Average installmenta | 3716 | 3838 | 4036 | 4141 | 4468 | 4282 |
| Annual production costs |
13925
|
14606
|
15151
|
15805
|
16483
|
16343
|
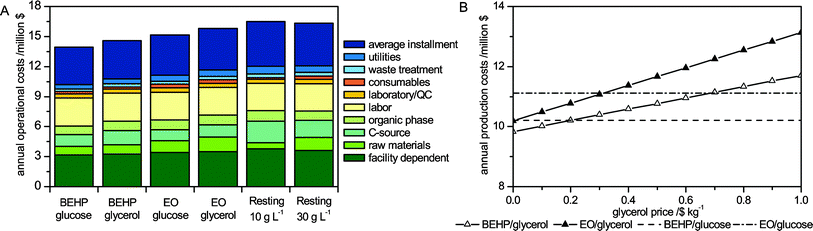 | ||
| Fig. 4 Annual production costs at current carbon source prices (A) and in dependence of the glycerol price (B). For the economic assessment, a purchase price of 0.5 $ kg−1 was assumed for glucose and glycerol. Costs for the carbon source and organic phase are displayed separately and are not included in the cost of raw materials. | ||
With growing cells, the annual production costs range between 10.2 and 11.7 $ kgSO−1. The differences are mainly productivity-related. With decreasing productivities, facility-dependent costs, installments, and raw material costs rise due to increasing equipment size and increasing resource demands. The contribution of EO to the raw material expenses is slightly lower than that of BEHP, due to the lower density at a similar price per kg. However, as an effect of the lower productivities in the EO-based setups, the overall raw material costs rise above the expenses of the BEHP-based processes, although the difference between the two different setups is relatively small.
The impact of the carbon source on the operational costs appeared to be more important. It has to be considered that market prices for glucose and glycerol vary depending on economic developments and the location of the production site. This is especially true for the glycerol price and availability, which vary depending on the biodiesel industry being supported by governmental subsidies and tax benefits to variable extents.47 Following the market price development for refined glycerol described amongst others by Pagliaro et al.,50 equal prices for glucose and glycerol (0.5 $ kg−1) were assumed to be realistic (status: 2009). On this basis, glucose is the preferred growth substrate for styrene epoxidation (Fig. 4B). In order to evaluate the effect of the glycerol price on annual production costs, a sensitivity analysis was performed showing that, depending on the solvent used, glycerol becomes cost-competitive below prices of 0.20 or 0.31 $ kg−1 (Fig. 4B). Glycerol costs may be lowered to these dimensions by coupling the styrene oxide plant to another process, in which glycerol accumulates as a waste product. However, the crude glycerol formed as a by-product is normally of low grade. For example, during biodiesel production, glycerol streams are typically contaminated by high amounts of short-chain alcohols, free fatty acids, and inorganic salts used during transesterification.50 This may affect costs for downstream processing while still sustaining biocatalyst production and activity. For a final judgment of the achievable profitability with the two carbon sources, the purification costs have to be weighed against the purchase price of glucose and the savings with respect to glycerol disposal costs of the preceding process.
From an economical point of view, the application of resting cells for styrene epoxidation is inferior to the use of growing cells (Table 3). In correlation to the generally lower productivities and final product titers, the investment for larger equipment and the higher resource consumption increase facility-dependent expenses, installments, and raw material costs. The setup with lower cell concentrations economically benefits from the lower growth-related substrate demand. As consequence, waiving high biomass concentrations is able to compensate for the lower productivities in economic terms, resulting in nearly identical production costs for both investigated resting cell setups. Reuse of resting cells for several cycles represents a possibility to reduce time and resources consumed for biomass production. Principally, recycling of the biocatalyst is possible, as inhibition rather than permanent deactivation of the biocatalyst was observed with resting cells.26 In order to avoid tedious cell harvesting after each cycle, cell immobilization (e.g., in biofilms51,52) or cell retention in membrane reactors53,54 (problematic with stable emulsions) may facilitate biocatalyst recovery.
At the present state, growing cells are economically more attractive for asymmetric styrene epoxidation than resting cells, whereas the use of EO and glycerol may be economically interesting, depending on the company-specific weighing of environmental factors and the development of raw material prices.
Conclusion
In conclusion, styrene epoxidation by growing cells was both ecologically and economically superior to resting cells, mainly due to the higher stability of the biocatalyst. The assessment also showed that the glucose amount required for the production of the resting cell biocatalyst is an important factor for overall performance evaluation. However, potential recycling of resting cell biocatalysts opens the opportunity to capitalize on their excellent yield on glucose during the biotransformation.In this study, we were able to optimize the ecological performance of a whole-cell two-liquid phase biotransformation by exchanging the organic phase. EO was shown to be an environmentally attractive and cost-competitive solvent. Application of biodiesel provides new opportunities to improve solvent-based processes with respect to ecological aspects. Furthermore, it was shown that glycerol can be used as a carbon source for styrene epoxidation, giving better flexibility in terms of carbon source selection. However, the process performance suffered from lower productivities.
This study affirms the capability of ecological and economic assessments to identify critical process parameters and to enable systematic process development towards industrial implementation.
Experimental
Strain, cultivation and two-liquid-phase biotransformation
E. coli JM101 (supE thi-1 Δ(lac-proAB) F′ [ traD36 proAB+lacIqlacZΔM15]) was used as the host strain.55 The expression plasmid pSPZ10 contains the styrene monooxygenase genes styAB from the Pseudomonas sp. strain VLB120 under the control of the alk regulatory system from Pseudomonas putida GPo1.16Transformants were selected on lysogeny broth (LB) agar plates containing 50 μg mL−1 kanamycin.56 A single colony was picked and used to inoculate 5 ml liquid LB medium. After reaching the stationary growth phase, 1 mL was diluted in 99 mL M9 medium56 complemented with 1 mL L−1 US* trace elements,57 1 mL L−1 1% (w/v) thiamine solution, and 2 mL L−1 1 M magnesium sulfate (MgSO4) solution. After overnight growth, this culture was used to inoculate a KLF 2000 reactor (Bioengineering, Wald, Switzerland) containing 900 mL modified Riesenberg medium.58 Either 15 g L−1 glucose or 20 g L−1 glycerol were used as sole carbon and energy source. The pH was maintained at 7.20 by adding 30% phosphoric acid and 25% NH4OH solutions. The latter additionally served as a nitrogen feed. The batch phase was run overnight. Aeration and stirring rate were maintained constant at 1 L min−1 and 1500 rpm, respectively. After depletion of the carbon source, a feed consisting of either 730 g L−1 glucose and 19.6 g L−1 MgSO4 × 7H2O or 600 g L−1 glycerol and 16.1 g L−1 MgSO4 × 7H2O was started and increased until a biomass concentration of approximately 18 g L−1 was reached. Then, the biotransformation was started by the addition of the organic phase consisting of 910 mL carrier solvent, either BEHP or EO, 80 mL styrene, and 10 mL octane serving as the inducer of styAB expression. The dissolved oxygen concentration was kept above 20% of saturation by increasing the stirring speed (to a maximum of 2800 rpm) and the aeration rate (up to 2.5 L min−1). Antifoam A (Sigma–Aldrich Chemie Gmbh, Steinheim, Germany) was added only in case of excessive foaming. The biotransformation was monitored by taking samples every hour as described previously.57 For two-liquid phase biotransformations, volumetric rates and concentrations are given per liter of aqueous phase (Laq), organic phase (Lorg), or total volume (Ltot).
Analytics
Concentrations of styrene, styrene oxide, and 2-phenylethanol were measured by a TRACE GC Ultra (Thermo Fisher Scientific Inc., Waltham, MA, USA) equipped with a FactorFour VF-5 ms column (Varian, Inc., Palo Alto, CA, USA). Analytical conditions were identical as published before.13 Specific epoxidation activities are given in units (U) per gram cell dry weight (CDW), whereby 1 U is defined as the activity forming 1 μmol product per 1 min.The enantiomeric excess of (S)-styrene oxide was determined by separation of the two enantiomers on a chiral RT-BetaDEXsm column (Restek Corporation, Bellefonte, PA, USA). After maintaining the temperature at 100 °C for 1 min, the oven temperature was raised to 105 °C at a heating rate of 0.5 °C min−1, followed by heating at 30 °C min−1 to 230 °C, which was maintained for 3.8 min. The enantiomeric excess (e.e.) was calculated according to the following equation: e.e. [%] = 100 × |(S − R)| (S + R)−1.
Glucose, glycerol, and acetate were separated on an Aminex HPX-87-H column (Bio-Rad Laboratories, Hercules, CA, USA) in a LaChrom Elite HPLC system (Hitachi High Technologies America, Inc., Pleasanton, CA, USA), after extraction of aqueous styrene, styrene oxide, and 2-phenylethanol by BEHP. The flow rate of 5 mM sulfuric acid as mobile phase was set to 1.0 ml min−1. The column temperature was kept constant at 40 °C. Detection of the analytes was done by a L-2420 UV-Vis and a L-2490 refractive index module.
Cell concentrations were determined spectrophotometrically on a Libra S11 spectrophotometer (Biochrom Ltd., Cambridge, UK) at a wavelength of 450 nm.59
Assessment method
Economic and ecological process efficiencies were assessed by means of a method designed for utilization at early development stages of fine chemical processes.9,41,45,46 Mass-balances were generated on the basis of process flow-sheets by SuperPro Designer version 6.0 (Intelligen, Inc., Scotch Plains, NY, United States).For the calculation of the environmental indices, all substances are characterized in different categories according to their impact on human health and on the environment. These categories are land use, raw material availability, complexity of synthesis, thermal risk, acute toxicity, chronic toxicity, biological risk, ecotoxicity, global warming potential, ozone depletion potential, photochemical ozone creation potential, odor, and eutrophication potential. For each category, the substances are classified in three rating levels (ABC analysis), whereby “A” stands for high, “B” for medium, and “C” for low risk in the respective category. The criteria for the classification have been published elsewhere.13,49 Weighing factors are used to account for the differing significance of the impact categories, allowing the calculation of an environmental index for the input and the output materials. The total environmental index of a process is obtained by balancing the input and the output indices in a 40![[thin space (1/6-em)]](https://www.rsc.org/images/entities/char_2009.gif) :60 ratio.
:60 ratio.
SuperPro Designer comprises comprehensive databases for the calculation of numerous economic parameters. These values were used for the economic assessment unless otherwise stated. Purchase prices for the equipment were taken from the SuperPro Designer database. The direct investment costs are the sum of the equipment purchase costs (PC) and charges for the installation (40% of PC), the instrumentation (15% of PC), piping (46% of PC), electric facilities (10% of PC), buildings (16% of PC), yard improvements (14% of PC), and service facilities (60% of PC) as suggested by Roffler et al.60 Additionally, indirect costs such as expenses for engineering and the contractor's fee (16% of direct costs) and construction (10% of direct costs) have to be taken into account for the total capital investment. Raw material costs were complemented with industrial market prices from the ICIS webpage (http://www.ICIS.com). The depreciation period was assumed to be 10 years with a salvage value of 5%. Insurance and local taxes were estimated to account for 1% and 2% of the investment costs, respectively, whereas the factory expenses were fixed to 300000 $ a−1 in all processes. For the maintenance costs, unit-specific default values of SuperPro Designer were used. Basic labor costs (BLC) are estimated from the labor requirements of each operational step in the factory and assuming a standard wage of 30 $ h−1 for an operator. The total labor expenses additionally include charges for fringe benefits (40% of BLC), supervision (20% of BLC), operational supplies (10% of BLC), and administration (60% of BLC). Laboratory costs for quality checks were 15% of the total labor costs.
Acknowledgements
Andreas Schmid (TU Dortmund) is acknowledged for fruitful collaboration and mentoring. Furthermore, we thank Rudolf Krumbholz and Peter Lembke (K.D.-Pharma GmbH, Germany), Michael Breuer and Peter Saling (BASF SE, Germany), Muhammad Abdul Kholiq (Environmental Technology Center – BPPT, Indonesia), and Jin Byung Park (Ewha Womans University, Korea) for helpful discussions. This work was supported by the Deutsche Bundesstiftung Umwelt (DBU; project AZ13145) and by the Ministry of Innovation, Science, Research and Technology of North Rhine-Westphalia (Bio.NRW, Technology Platform Biocatalysis, RedoxCell).References
- S. M. Thomas, R. di Cosimo and A. Nagarajan, Trends Biotechnol., 2002, 20, 238–242 CrossRef CAS.
- A. Bruggink, A. J. Straathof and L. A. van der Wielen, Adv. Biochem. Eng. Biotechnol., 2003, 80, 69–113 CrossRef CAS.
- T. Ishige, K. Honda and S. Shimizu, Curr. Opin. Chem. Biol., 2005, 9, 174–180 CrossRef CAS.
- J. M. Woodley, Adv. Appl. Microbiol., 2006, 60, 1–15 CrossRef CAS.
- J. M. Woodley, Trends Biotechnol., 2008, 26, 321–327 CrossRef CAS.
- J. H. Tao and J. H. Xu, Curr. Opin. Chem. Biol., 2009, 13, 43–50 CrossRef CAS.
- P. Saling, A. Kicherer, B. Dittrich-Krämer, R. Wittlinger, W. Zombik, I. Schmidt, W. Schrott and S. Schmidt, Int. J. Life Cycle Assess., 2002, 7, 203–218 CrossRef.
- R. A. Sheldon, Green Chem., 2007, 9, 1273–1283 RSC.
- E. Heinzle, D. Weirich, F. Brogli, V. H. Hoffmann, G. Koller, M. A. Verduyn and K. Hungerbühler, Ind. Eng. Chem. Res., 1998, 37, 3395–3407 CrossRef CAS.
- J. von Geibler, H. Wallbaum, C. Liedtke and F. Lippert, in Management models for corporate social responsibility, ed. J. Jonker and M. de Witte, SpringerBerlin Heidelberg, Heidelberg, Germany, 2006, pp. 207–213 Search PubMed.
- D. Kuhn, L. M. Blank, A. Schmid and B. Bühler, Eng. Life Sci., 2010, 10, 384–397 CrossRef CAS.
- E. Heinzle and K. Hungerbühler, Chimia, 1997, 51, 176–183 CAS.
- D. Kuhn, M. A. Kholiq, E. Heinzle, B. Bühler and A. Schmid, Green Chem., 2010, 12, 815–827 RSC.
- S. Panke, B. Witholt, A. Schmid and M. G. Wubbolts, Appl. Environ. Microbiol., 1998, 64, 2032–2043 CAS.
- A. Schmid, K. Hofstetter, H. J. Feiten, F. Hollmann and B. Witholt, Adv. Synth. Catal., 2001, 343, 732–737 CrossRef CAS.
- S. Panke, M. G. Wubbolts, A. Schmid and B. Witholt, Biotechnol. Bioeng., 2000, 69, 91–100 CrossRef CAS.
- S. Panke, J. M. Sanchez-Romero and V. de Lorenzo, Appl. Environ. Microbiol., 1998, 64, 748–751 CAS.
- B. Bühler and A. Schmid, J. Biotechnol., 2004, 113, 183–210 CrossRef.
- D. Meyer, B. Bühler and A. Schmid, Adv. Appl. Microbiol., 2006, 59, 53–91 CrossRef CAS.
- J. B. van Beilen, W. A. Duetz, A. Schmid and B. Witholt, Trends Biotechnol., 2003, 21, 170–177 CrossRef CAS.
- O. Favre-Bulle, T. Schouten, J. Kingma and B. Witholt, Nat. Biotechnol., 1991, 9, 367–371 CrossRef CAS.
- R. D. Schwartz and C. J. McCoy, Appl. Environ. Microbiol., 1977, 34, 47–49 CAS.
- B. Bühler, A. J. J. Straathof, B. Witholt and A. Schmid, Org. Process Res. Dev., 2006, 10, 628–643 CrossRef.
- A. M. McIver, S. V. B. J. Garikipati, K. S. Bankole, M. Gyamerah and T. L. Peeples, Biotechnol. Prog., 2008, 24, 593–598 CrossRef CAS.
- A. Z. Walton and J. D. Stewart, Biotechnol. Prog., 2002, 18, 262–268 CrossRef CAS.
- M. K. Julsing, D. Kuhn, A. Schmid and B. Bühler, Biotech. Bioeng., in press, http://onlinelibrary.wiley.com/doi/10.1002/bit.24404/abstract Search PubMed.
- J. B. Park, B. Bühler, T. Habicher, B. Hauer, S. Panke, B. Witholt and A. Schmid, Biotechnol. Bioeng., 2006, 95, 501–512 CrossRef CAS.
- S. Salehpour and M. A. Dubé, Green Chem., 2008, 10, 321–326 RSC.
- J. B. Hu, Z. X. Du, Z. Tang and E. Min, Ind. Eng. Chem. Res., 2004, 43, 7928–7931 CrossRef CAS.
- A. Ishizaki, S. Michiwaki, E. Crabbe, G. Kobayashi, K. Sonomoto and S. Yoshino, J. Biosci. Bioeng., 1999, 87, 352–356 CrossRef CAS.
- R. Boenigk, S. Bowien and G. Gottschalk, Appl. Microbiol. Biotechnol., 1993, 38, 453–457 CrossRef CAS.
- G. P. Agarwal, Adv. Biochem. Eng./Biotechnol., 1990, 41, 95–128 CrossRef CAS.
- Y. Dharmadi, A. Murarka and R. Gonzalez, Biotechnol. Bioeng., 2006, 94, 821–829 CrossRef CAS.
- S. S. Yazdani and R. Gonzalez, Curr. Opin. Biotechnol., 2007, 18, 213–219 CrossRef CAS.
- B. Bühler, J. B. Park, L. M. Blank and A. Schmid, Appl. Environ. Microbiol., 2008, 74, 1436–1446 CrossRef.
- S. Panke, M. Held, M. G. Wubbolts, B. Witholt and A. Schmid, Biotechnol. Bioeng., 2002, 80, 33–41 CrossRef CAS.
- F. Hollmann, P. C. Lin, B. Witholt and A. Schmid, J. Am. Chem. Soc., 2003, 125, 8209–8217 CrossRef CAS.
- F. Hollmann, K. Hofstetter, T. Habicher, B. Hauer and A. Schmid, J. Am. Chem. Soc., 2005, 127, 6540–6541 CrossRef CAS.
- R. Ruinatscha, C. Dusny, K. Bühler and A. Schmid, Adv. Synth. Catal., 2009, 351, 2505–2515 CrossRef CAS.
- K. Hofstetter, J. Lutz, I. Lang, B. Witholt and A. Schmid, Angew. Chem., Int. Ed., 2004, 43, 2163–2166 CrossRef CAS.
- E. Heinzle, A. Biwer and C. L. Cooney, Development of sustainable bioprocesses: modeling and assessment, John Wiley & Sons Ltd, Chichester, UK, 2007 Search PubMed.
- A. Schmid, J. S. Dordick, B. Hauer, A. Kiener, M. Wubbolts and B. Witholt, Nature, 2001, 409, 258–268 CrossRef CAS.
- A. J. J. Straathof, S. Panke and A. Schmid, Curr. Opin. Biotechnol., 2002, 13, 548–556 CrossRef CAS.
- Y. Li, J. Chen and S. Y. Lun, Appl. Microbiol. Biotechnol., 2001, 57, 451–459 CrossRef CAS.
- G. Koller, D. Weirich, F. Brogli, E. Heinzle, V. H. Hoffmann, M. A. Verduyn and K. Hungerbühler, Ind. Eng. Chem. Res., 1998, 37, 3408–3413 CrossRef CAS.
- A. Biwer and E. Heinzle, J. Chem. Technol. Biotechnol., 2004, 79, 597–609 CrossRef CAS.
- G. Knothe and K. R. Steidley, Ind. Eng. Chem. Res., 2011, 50, 4177–4182 CrossRef CAS.
- N. H. Rao and P. P. Rogers, Curr. Sci., 2006, 91, 439–448 Search PubMed.
- E. Heinzle, A. Biwer, M. Eissen and M. A. Kholiq, Chem. Ing. Tech., 2006, 78, 301–305 CrossRef CAS.
- M. Pagliaro and M. Rossi, in The Future of Glycerol, ed. M. Pagliaro and M. Rossi, The Royal Society of Chemistry, Cambridge, UK, 2nd edn, 2010, pp. 1–28 Search PubMed.
- R. Gross, B. Hauer, K. Otto and A. Schmid, Biotechnol. Bioeng., 2007, 98, 1123–1134 CrossRef CAS.
- B. Halan, A. Schmid and K. Buehler, Appl. Environ. Microbiol., 2011, 77, 1563–1571 CrossRef CAS.
- H. M. van Sonsbeek, H. H. Beeftink and J. Tramper, Enzyme Microb. Technol., 1993, 15, 722–729 CrossRef CAS.
- S. Lutz, N. N. Rao and C. Wandrey, Chem. Eng. Technol., 2006, 29, 1404–1415 CrossRef.
- J. Messing, Recomb. DNA Tech. Bull., 1979, 79–99, 43–48 Search PubMed.
- J. Sambrook and D. W. Russell, Molecular cloning - A laboratory manual, Cold Spring Harbor Laboratory Press, New York, NY, USA, 2001 Search PubMed.
- S. Panke, A. Meyer, C. M. Huber, B. Witholt and M. G. Wubbolts, Appl. Environ. Microbiol., 1999, 65, 2324–2332 CAS.
- B. Bühler, I. Bollhalder, B. Hauer, B. Witholt and A. Schmid, Biotechnol. Bioeng., 2003, 81, 683–694 CrossRef.
- L. M. Blank, B. E. Ebert, B. Bühler and A. Schmid, Biotechnol. Bioeng., 2008, 100, 1050–1065 CrossRef CAS.
- S. Roffler, H. W. Blanch and C. R. Wilke, Biotechnol. Prog., 1987, 3, 131–140 CrossRef CAS.
Footnote |
| † Electronic supplementary information (ESI) available: Figure A: Flow-sheet for the biocatalytic (S)-styrene oxide production. Table A: Detailed mass-balances of resource consumption and waste generation; Table B: Detailed environmental indices of the growing cell processes; Table C: Detailed environmental indices of the resting cell processes; Table D: Criteria for ABC classification. See DOI: 10.1039/c2gc15985f |
| This journal is © The Royal Society of Chemistry 2012 |