 Open Access Article
Salt release from potato crisps
Xing
Tian
and
Ian D.
Fisk
*
Division of Food Sciences, University of Nottingham, Sutton Bonington Campus, Sutton Bonington, Loughborough, Leicestershire, LE12 5RD, United Kingdom. E-mail: Ian.Fisk@nottingham.ac.uk; Fax: +44 (0)115 951 6142; Tel: +44 (0)115 951 6037
First published on 16th February 2012
Abstract
The rate of salt release in-mouth from salted potato crisps was evaluated. It was hypothesised that a slow steady release of sodium would occur on chewing and hydration; to test this a crisp was chewed and held in the oral cavity without swallowing for 60 s. Sodium release was measured over the entire holding period, after 20–30 s a peak in salivary sodium levels was recorded. A similar trend was observed with sensory perceived saltiness by trained panellists. The results suggest that a significant proportion of the crisp's salt flavouring is released in a pulse-type mechanism which would not be encountered when the crisp is exposed to normal eating patterns and would result in the consumption of a large proportion of unperceived sodium.
Introduction
High levels of dietary sodium have been linked to negative health impacts such as hypertension.1 In contrast to the World Health Organisation's recommendations for a daily salt intake limit of 5 g, many consumers exceed this limit, and often have a daily intake of >10 g salt.1 The reduction of salt in processed foods is a major challenge for health authorities across the globe and in many cases the challenge is currently being set to the food industry to change formulations and reduce dietary sodium consumption thereby reducing hypertension and associated risks on cardiovascular disease.2In addition to salts role as a flavour enhancer, the food industry has historically added salt (sodium chloride) to foods to enhance shelf life, modify flavour,3 enhance functionality, and to control fermentation. There is a clear need for the food industry to identify technical routes to enable functionality to be modified, flavour to be enhanced and shelf life to be preserved whilst reducing the concentration of sodium salts and maintaining the consumer experience.
Salt (sodium chloride) is the major dietary source of sodium and in western diets starchy foods are one of the major dietary contributors (e.g. breads, snacks and crisps). The reason behind the addition of sodium and the point of addition differs within each product category. In this study, the focus will be the topical application of salt to salted crisps (fried sliced potato of approximately 1 mm thickness).
When a crisp is consumed, it typically passes through a number of phases: chewing, hydration, bolus formation and swallowing.4 If the fate of topically applied salt is considered, during chewing the salt is firstly mixed with the crisp and the bolus is formed, the salt then becomes hydrated and dissolves into the local saliva and is then distributed across the mouth cavity by a tongue mixing phenomenon, finally the bulk is swallowed, but small parts of the crisp remain distributed across the mouth surface which are subsequently collected by the tongue and swallowed.
The perception of salt is driven by the local sodium concentration at the saliva-receptor interface relative to the normal baseline concentration and the rate of change of concentration within the saliva,5,6 the salt must therefore pass from the fatty matrix of the crisp to the saliva bulk, and then migrate to the saliva-receptor interface7 where it has the opportunity to interact with ion-channel receptors, subsequently leading to perception (if suprathreshold). There is therefore a temporal dimension to salt perception which lasts from the point of chewing until all the salt is removed from the mouth.
There are a number of studies investigating the temporal dimension to salt perception in foods, including the delivery of salt from dairy gels,8 bologna type sausages,9 chewing gum,10 bread,11 cheese analogues,12 hard cheese and salad cream.13 All of the studies show a similar time-intensity profile, firstly baseline sodium in the mouth and then following the placement of the food matrix within the mouth, sodium levels increase to a maximum and then return to the baseline. Due to the varied food matrices and sampling protocols the data cannot be compared directly, but in general the higher the salt level or the more available the salt (ease of transfer from matrix to saliva-receptor interface), the greater the maximum sodium concentration in the saliva or sensory perceived intensity (if measured). Given that consumption occurs very quickly and that changes in salt concentration can be perceived in as little as 0.6 s14 the authors believe that many of the published studies do not have enough data points to truly identify a time to maximum intensity or a maximum value.
Previous studies within the Division of Food Science at the University of Nottingham have focused both on low viscosity and semi-solid/solid systems. When considering low viscosity aqueous systems the relocation of sodium ions with differing hydrocolloid types (varying free space) in various aqueous–hydrocolloid suspensions15,16 was shown to impact the perception of free aqueous sodium, additionally changes in sodium availability in starch slurries through the application of buccal amylase17 changed the delivery of perceived salt; the development of a temporal understanding of sodium delivery was achieved through the use of pulsed delivery18,19 of sodium in an aqueous suspension and when considering solid/semi-solid systems the use of a mouth brace was previously used to illustrate the impact of structural and textural properties on the development of conductivity after consumption of salted foods.20
The objective of the present study builds on previous works and aims to investigate the rate of release of salt from a fried potato matrix (crisps) into the saliva and to correlate the delivery of sodium to the saliva with sensory perceived saltiness over a 60 s timeline. This will be conducted with a forced chew/swallow protocol to exemplify the release of sodium from the matrix.
Materials and methods
Crisps were purchased commercially and were within manufacturing specifications and recommended use by date, unsalted crisps contained 0% sodium chloride and salted crisps contained 7% sodium chloride. Diluent water was ultrapure water (Pur1te select, ONDEO, UK), sodium standards were analytical pre-prepared standards from Sherwood (Cambridge, UK). Cellulose filter papers (FB59025) were cut into 2 cm2 squares and used for tongue swabbing and were sourced from Fisher Scientific (Loughborough, UK). Conductivity was measured with a Pt/Pt electrode and meter (PTI-58 Digital conductivity meter) from Scientific Industries International Inc. (UK) and the Flame Photometer (Model 410) was from Sherwood (UK). Sensory time-intensity was measured by FIZZ 2.0 (Biosystems, Couternon, France).Statistical analysis was performed with SPSS (Portsmouth, UK) and FIZZ 2.0 software (Biosystems, Couternon, France) (P < 0.05).
Chewing and swabbing protocol
Panellists were trained in a standard chewing protocol prior to evaluation and two practice sessions were conducted. Individual intact crisps were inserted in the mouth and place on the rear of the tongue, the crisp was then chewed a defined number of times, and with free tongue movement a bolus was formed (where possible), the timer was then started. The tongue was cleaned by the front teeth and the tongue swabbed (every 5 s for 60 s) with pre-weighed filter papers and subsequently placed in pre-weighed sample bottles (30 mL). Isolated saliva samples were then weighed to calculate saliva weight, diluted with ultrapure water (20 mL) mixed on a bottle roller for 10 min, samples were analysed for sodium content by flame photometer or conductivity.Sensory evaluation
Panellists (n = 10, aged 20–25, 4 male, 6 female) were selected from the University of Nottingham's student internal panel on the basis of their ability to discriminate between samples varying in salt concentration and their ability to conduct time-intensity evaluation and a repeatable swabbing protocol. Panellists received training on saliva swabbing and time-intensity evaluation using FIZZ 2.0. Panellists consumed samples (both salted and unsalted crisps, 1 g) in triplicate for evaluation of saltiness by time-intensity (FIZZ 2.0). On a separate occasion they swabbed their tongue (every 5 s for 60 s) after chewing for evaluation of sodium concentration in saliva. The order of presentation was balanced within a session and all panellists were required to palate cleanse (plain crackers, diluted lime cordial and bottled water) prior to sample testing with a 5 min break between samples.Sodium concentration
Sodium content was analysed by flame photometry using a Model 410 Flame Photometer from Sherwood, UK. Sodium content was evaluated at a wavelength of 589 nm against blank samples and control standards at 1 ppm and 10 ppm, calibration curves demonstrated repeatability (R2 > 0.99), and linearity up to 10 ppm.Samples with validated sodium contents were also evaluated for conductivity with a PT-58 digital conductivity meter, which showed repeatability (R2 > 0.99) and linearity up to 10 ppm when calibrated against flame photometer validated true standards.
The choice of either conductivity or flame photometry to evaluate sodium concentration was chosen for practical considerations due to the large sample numbers. There may be a concern that using saliva conductivity as a measure of sodium release could lead to erroneous answers due the changes in salivary proteins, modification of the saliva flow rate and dissolution of starch and lipid particles. In all cases samples were diluted 200 times and there was a linear correlation between conductivity and saliva sodium concentration, although a small increase in baseline conductivity was not attributed to sodium and was probably due to the release of charged components of the saliva or crisp base. This shift was negligible when compared to the sodium delivery by the salted crisps and therefore conductivity and sodium content are considered interchangeable when operating in a scale range >10 μs cm−1.
Experimental approach
An evaluation of the delivery of salt from salted crisps to the saliva of the mouth consisted of the measurement of perceived saltiness, saliva conductivity and sodium content by tongue swabbing over a 60 s period after a crisp was chewed but not swallowed.The work was conducted in four phases: Firstly the change in saliva conductivity (a measure of the release of salt) was measured after chewing either a salted crisp, an unsalted crisp or a blank sample (no crisp), this was repeated with a varied number of chewing repetitions to modify the surface area (one to five chews); secondly, the first approach was repeated for the salted crisp specifically and the sodium content measured in the saliva, thirdly individual crisps were chewed once every 60 s for 300 s with no swallowing and the change in saliva sodium concentration was measured; finally ten trained consumers chewed individual crisps (salted and unsalted) and both their saliva sodium concentration and their perception of saltiness was measured during a 60 s holding period.
Results and discussion
When chewing was conducted with nothing in the mouth, with 1 chew up to 5 chews, there was a small but gradual increase in saliva conductivity in the mouth (Fig. 1a). This change is presumed to be the baseline modification of saliva composition as a consequence of the chewing action, which will include modification of the salivary protein concentration and the dilution of saliva by further saliva production. When unsalted crisps were consumed (Fig. 1b) there was a slightly greater increase with the presence of crisps, which is presumed to be due to the release of soluble conductive materials. In both the blank and the unsalted crisp sample there was no impact of chew number on the saliva conductivity.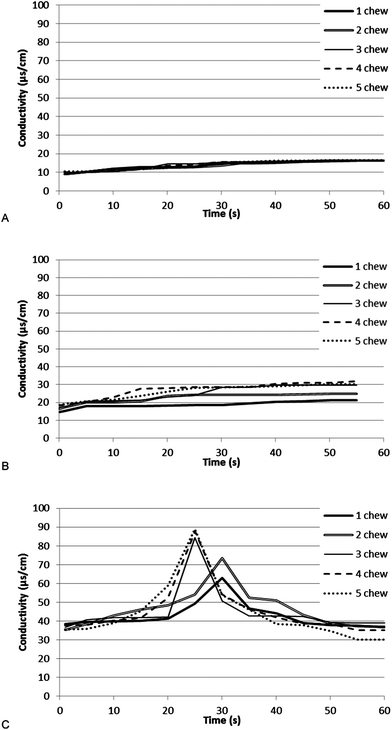 | ||
| Fig. 1 Saliva conductivity after chewing of individual salted crisps chewed a defined number of time (c) chewing of individual unsalted crisps chewed a defined number of times (b) chewing of no crisps (blank) with a fake chewing action a defined number of times (a). | ||
When salted crisps were consumed the baseline was higher and did not change during the time course (Fig. 1c). There was a significant and marked peak in conductivity 25–30 s post-chewing. This occurred in all samples and could not be statistically correlated to the number of chews, although, the higher the chew number the greater the area of the 25–30 s peak. The increase in the peak area plateaued at three chews and did not increase further. A three chew number was therefore chosen as the standard chew number for future experiments.
The salted crisp study was repeated by measuring sodium in the saliva (Fig. 2) and similar conclusions were drawn as were found in Fig. 1c. There was a peak in sodium content in the saliva at 20–30 s after chewing, but there was no correlation between chew number and sodium release, although there is an indication that the highest two chew frequencies offer the highest maximum saliva sodium concentration, the lowest chew number showed the lowest maximum sodium concentration and the base line was unaffected by the chew number.
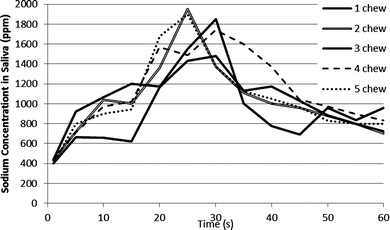 | ||
| Fig. 2 Saliva sodium concentration after chewing of individual salted crisps chewed a defined number of times. | ||
To further understand the delivery of salt in mouth from crisps, a series of sequential chew events was conducted on one crisp. Five chew events were conducted over the 300 s period with no swallow event and saliva conductivity was measured at 5 s intervals over this time. The results are shown in Fig. 3 and show a similar peak and trough curve for conductivity after the first chew event, sequential chew events gave similar peaks. The trough minima did not vary over sequential chew events, but the peak maximum did vary and increased with each sequential chew event. This indicates that the mouth chemistry has changed such that sodium release from the crisps may be more effective, resulting in a greater peak maximum or that the product had changed during the in-mouth holding period.
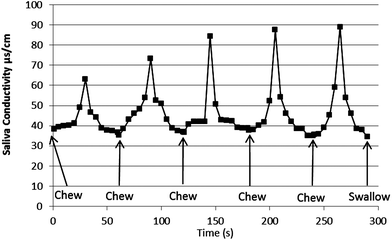 | ||
| Fig. 3 Saliva conductivity during the sequential consumption of five ready salted crisps. | ||
For the third evaluation of salt release in saliva, true sodium content was measured in duplicate in the saliva of 10 trained panellists, every five seconds over 60 s, for salted and unsalted crisps (Fig. 4). The entire experiment was conducted in triplicate. In addition, panellists in separate sessions were asked to rate saltiness on a time-intensity scale over the 60 s period for each crisp type in triplicate.
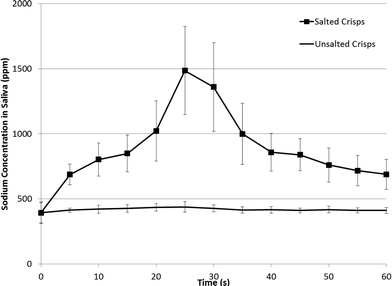 | ||
| Fig. 4 Sodium concentration in saliva after chewing of both salted and unsalted crisps chewed three times by 10 trained panellists in triplicate. Error bars indicate ± standard deviation. | ||
Time-intensity of saltiness was conducted using FIZZ Software, and the FIZZ normalisation and computation algorithm was used for the formulation of extracted parameters from the time intensity curves (Tmax and Imax) (Fig. 5), calculated time-intensity curves are shown in Fig. 6.
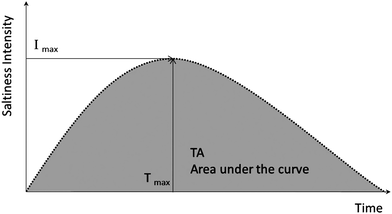 | ||
| Fig. 5 Illustration of time-intensity curve and extracted parameters. | ||
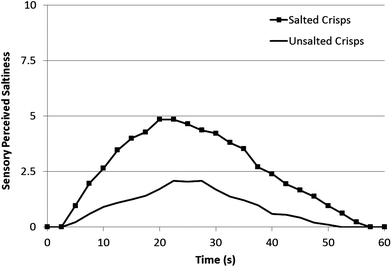 | ||
| Fig. 6 Perception of saltiness after chewing both salted and unsalted crisps chewed three times by 10 consumers in triplicate. | ||
There was no change in saliva salt concentration over the experimental time course for the unsalted crisps, for the salted crisps, there was a repeatable increase in saliva sodium concentration over the 60 s period with a peak maximum at 25 s (Fig. 4). This correlated with the conductivity results shown previously and confirms the delayed delivery of sodium at 25–30 s after chewing as detailed in Fig. 1a and Fig. 2.
Saltiness perception for the same samples as Fig. 4 showed highly comparable shaped curves to the sodium concentration data. Unsalted crisps had no increase in sodium concentration and had a minimal increase in saltiness which was attributed to a salt non-discriminating panellist (one panellist). The salted crisps had a marked increase in saltiness after the chew event which peaked at 20–25 s, calculated values for Imax and Tmax are shown in Table 1.
| Sample | I max | T max | TA |
|---|---|---|---|
| Salted crisp | 4.9 | 20 | 150 |
| Unsalted crisp | 2.1 | 23 | 54 |
During normal consumption the delayed peak will not be perceived as the sodium load will be delivered after swallowing, there therefore is a clear opportunity to further investigate the exact Tmax with different crisp types and salt crystal sizes with the aim of delivering sodium faster and more directly to the receptors.
Conclusion
Holding of a chewed crisp in the mouth for an extended period of time allows the continued delivery of sodium over time, surprisingly there was a peak in sodium delivery at 20–30 s after chewing. The peak intensity was not significantly impacted by chew frequency and was not found in unsalted crisps or blank samples. Sensory evaluation demonstrated a similar correlating peak in panellist perceived saltiness at 20–30 s. The results serves to highlight that a proportion of sodium is consumed without being perceived and that future development of novel technologies to modify the rate-release mechanism of sodium in mouth may offer significant commercial and health opportunities within the food industry.References
- World Heath Organisation, Report of a WHO forum and technical meeting, ed. W. D. P. Services, 2007 Search PubMed.
- F. M. Sacks, L. P. Svetkey, W. M. Vollmer, L. J. Appel, G. A. Bray, D. Harsha, E. Obarzanek, P. R. Conlin, E. R. Miller, D. G. Simons-Morton, N. Karanja, P. H. Lin and D.-S. C. R. Grp, N. Engl. J. Med., 2001, 344, 3–10 CrossRef CAS.
- M. Mitchell, N. P. Brunton and M. G. Wilkinson, Food Res. Int., 2011, 44, 1036–1043 CrossRef CAS.
- A. J. Rosenthal, Food texture: measurement and perception, Aspen Publishers Inc, 1999, Maryland, USA, 18–26 Search PubMed.
- J. L. H. C. Busch, C. Tournier, J. E. Knoop, G. Kooyman and G. Smit, Chem. Senses, 2009, 34, 341–348 CrossRef.
- M. Bertino, G. K. Beauchamp and K. Engelman, Am. J. Clin. Nutr., 1982, 36, 1134–1144 CAS.
- H. L. Meiselman, H. E. Bose and W. E. Nykvist, Physiol. Behav., 1972, 9, 35–38 CrossRef CAS.
- C. de Loubens, M. Panouillé, A. Saint-Eve, I. Déléris, I. C. Tréléa and I. Souchon, J. Food Eng., 2011, 105, 161–168 CrossRef CAS.
- S. Ventanas, E. Puolanne and H. Tuorila, Meat Sci., 2010, 85, 410–419 CrossRef CAS.
- E. Neyraud, J. Prinz and E. Dransfield, Physiol. Behav., 2003, 79, 731–737 CrossRef CAS.
- N. Barylkopikielna, I. Matuszewska and U. Hellemann, Food Sci. Technol., 1990, 23, 422–426 Search PubMed.
- C. R. Stampanoni and A. C. Noble, J. Texture Stud., 1991, 22, 381–392 CrossRef.
- S. Shamil, L. J. Wyeth and D. Kilcast, Food Qual. Preference, 1991, 3, 51–60 CrossRef.
- J. F. Delwiche, B. P. Halpern and J. A. Desimone, Physiol. Behav., 1999, 66, 27–32 CrossRef CAS.
- A. L. Koliandris, C. Morris, L. Hewson, J. Hort, A. J. Taylor and B. Wolf, Food Hydrocolloids, 2010, 24, 792–799 CrossRef CAS.
- A. L. Ferry, J. Hort, J. R. Mitchell, D. J. Cook, S. Lagarrigue and B. Valles Pamies, Food Hydrocolloids, 2006, 20, 855–862 CrossRef CAS.
- A. L. S. Ferry, J. R. Mitchell, J. Hort, S. E. Hill, A. J. Taylor, S. Lagarrigue and B. Valles-Pamies, J. Agric. Food Chem., 2006, 54, 8869–8873 CrossRef CAS.
- C. Morris, C. Labarre, A. L. Koliandris, L. Hewson, B. Wolf, A. J. Taylor and J. Hort, Food Qual. Preference, 2010, 21, 489–494 CrossRef.
- C. Morris, A. L. Koliandris, B. Wolf, J. Hort and A. Taylor, Chemosens. Percept., 2009, 2, 1–8 CrossRef.
- J. M. Davidson, R. S. T. Linforth and A. J. Taylor, J. Agric. Food Chem., 1998, 46, 5210–5214 CrossRef CAS.
| This journal is © The Royal Society of Chemistry 2012 |
