Modulation of lipid digestibility using structured emulsion-based delivery systems: Comparison of in vivo and in vitro measurements
Yan
Li
,
Jonggun
Kim
,
Yeonhwa
Park
and
David Julian
McClements
*
Department of Food Science, University of Massachusetts, Amherst, Massachusetts 01003, USA. E-mail: mcclements@foodsci.umass.edu
First published on 20th February 2012
Abstract
Emulsion-based delivery systems are finding increasing application to enhance the oral bioavailability of poorly water-soluble pharmaceuticals and nutraceuticals, and to control the biological fate of ingested lipids. These systems can be designed to encapsulate lipophilic components, and then release them at specific locations within the gastrointestinal tract. The current study evaluated the performance of four emulsion-based delivery systems with different structures: (A) conventional emulsions; (B) small microcluster emulsions; (C) large microcluster emulsions; (D) filled hydrogel beads. These systems were fabricated from protein-coated lipid droplets, alginate, and/or calcium. The mean diameters (d43) of the particles in these systems were 0.36, 4.7, 200, and 510 μm, respectively. The fate of the delivery systems within the gastrointestinal tract was ascertained by introducing them into rat stomachs. Confocal microscopy showed that system D remained intact in the stomach, but systems A, B and C exhibited considerable disruption leading to droplet coalescence. No intact delivery systems were observed within the small intestine using optical microscopy. Gas chromatography analysis using a marker lipid (tridecanoic acid) demonstrated that absorption was increasingly inhibited as the size of the droplet-biopolymer complexes increased, i.e., A > B > C > D. These results are in good qualitative agreement with previous in vitro digestion studies using similar delivery systems. This study showed that an in vitro digestion model is a useful predictive tool for in vivo feeding studies, and that encapsulation is an effective strategy to control the fate of lipids within the gastrointestinal (GI) tract.
1. Introduction
Emulsion-based delivery systems have been developed to increase the oral bioavailability of lipophilic compounds within the gastrointestinal (GI) tract.1–4 They have also been used to control the release of lipophilic agents at specific locations within the GI tract, such as the mouth, stomach, small intestine, or colon.5–9 Emulsion-based delivery systems typically utilize relatively small lipid droplets (d = 10 nm–100 μm) to encapsulate the lipophilic components.10 The functionality of this type of delivery system can be tailored by controlling their composition and structural organization. This has led to the development of a number of different categories of emulsion-based delivery systems, including conventional emulsions, nanoemulsions, multilayer emulsions, solid lipid nanoparticles, multiple emulsions, microcluster emulsions, and filled hydrogel particles.11–15 Each of these systems has its own specific advantages and disadvantages for controlling lipid digestion and for releasing lipophilic components.1,6,8,10,16The suitability of a specific type of emulsion-based delivery system for a particular application can often be established using in vitro models to screen its efficacy under simulated digestion conditions.17–20 There are a number of benefits in carrying out initial screening experiments using in vitro models, rather than using only animal or human feeding studies. First, they provide insights into the physicochemical processes occurring during digestion (e.g., structural changes, compositional changes, and release mechanisms), since it is usually easy to collect and analyze samples using in vitro experiments. Second, they are much quicker and cheaper to carry out than animal or human studies, allowing a greater number of candidate delivery systems to be rapidly analyzed. Third, they reduce the number of studies that need to be carried out using animals or humans, which has important ethical and economic implications. Nevertheless, there are always concerns about how accurately simple in vitro digestion models mimic the complex physicochemical and physiological processes occurring within animals or humans.21 Consequently, it is important to correlate the information obtained using in vitro studies with those obtained using in vivo studies.22–24
In previous studies, we have fabricated and characterized a number of different kinds of emulsion-based delivery systems, and then tested their ability to control lipid digestion and release using in vitro digestion models.25–27 We found that there were large differences in the rate and extent of lipid digestion depending on the structural design of the emulsion-based delivery systems. In particular, we found that encapsulating lipid droplets within indigestible polysaccharide matrices could greatly slow down their digestion, with the digestion rate decreasing with increasing matrix dimensions and increasing internal cross-linking. In these previous studies we utilized alginate as the indigestible polysaccharide and formed polysaccharide matrices around the lipid droplets using either layer-by-layer, complex coacervation, or extrusion methods.
The purpose of the current study was to ascertain the fate of the different structured delivery systems we previously developed using an in vivo animal (rat) study, so as to determine their ability to control lipid digestion under more realistic gastrointestinal conditions. In addition, we aimed to compare the results of our previous in vitro digestion measurements with these in vivo animal studies to ascertain the suitability of the in vitro model for screening purposes.
2. Materials and methods
2.1. Materials
Powdered β-lactoglobulin (β-Lg) was obtained from Davisco Foods International (Lot # JE 002-8-415, Le Sueur, MN, USA). Corn oil was purchased from a local supermarket and used without further purification. Sodium alginate and fluorescent dye (Nile Red) were purchased from Sigma-Aldrich (St. Louis, MO). A fatty acid (C13![[thin space (1/6-em)]](https://www.rsc.org/images/entities/char_2009.gif) :0) not normally found in nature was used as a marker in the lipid digestion experiments, while a long-chain polyunsaturated fatty acid (C20:4) found in tissues or serum was used as a standard in gas chromatography analysis. The tritridecanoin, tridecanoic acid (C13:0) and arachidonic acid (C20:4) were purchased from NU-CHEK PREP Inc. (Elysian, MN, USA). Analytical grade hydrochloric acid (HCl) and sodium hydroxide (NaOH) were purchased from Sigma-Aldrich. Calcium chloride (CaCl2·2H2O) was obtained from Fisher Scientific. Purified water from a Nanopure water system (Nanopure Infinity, Barnstead International, Dubuque, IA) was used for the preparation of all solutions.
:0) not normally found in nature was used as a marker in the lipid digestion experiments, while a long-chain polyunsaturated fatty acid (C20:4) found in tissues or serum was used as a standard in gas chromatography analysis. The tritridecanoin, tridecanoic acid (C13:0) and arachidonic acid (C20:4) were purchased from NU-CHEK PREP Inc. (Elysian, MN, USA). Analytical grade hydrochloric acid (HCl) and sodium hydroxide (NaOH) were purchased from Sigma-Aldrich. Calcium chloride (CaCl2·2H2O) was obtained from Fisher Scientific. Purified water from a Nanopure water system (Nanopure Infinity, Barnstead International, Dubuque, IA) was used for the preparation of all solutions.
2.2. Solution preparation
An emulsifier solution was prepared by dispersing 1.0 wt% powdered β-Lg into buffer solution (5 mM phosphate, pH 7.0) and stirring for at least 2 h. The protein solution was then stored at 4 °C overnight to ensure complete hydration. An alginate solution (4.0 wt%) was made by dispersing alginate powder into buffer solution (5 mM phosphate, pH 7.0) and stirring overnight. Calcium solution was prepared by dissolving a certain amount of CaCl2 powder into double distilled water.2.3. Emulsion preparation
| Delivery system | Alginate:Fat Ratio |
Composition of CaCl2 bath | d 32 (μm) | d 43 (μm) |
|---|---|---|---|---|
| a The mean diameter of the A, B, and C delivery systems was determined by laser diffraction, while that of the D delivery systems was estimated from optical microscopy images. | ||||
| A: Conventional emulsion | 0 | 0 | 0.24 ± 0.01 | 0.36 ± 0.01 |
| B: Small microclusters | 1:10 |
0 | 4.03 ± 0.02 | 4.66 ± 0.03 |
| C: Large microclusters | 1:10 |
0.075 wt% | 13 ± 2 | 200 ± 50 |
| D: Filled hydrogel beads | 1:2.5 |
10 wt% | — | 510 ± 30a |
—Conventional emulsion (Sample A): The stock emulsion was used directly as an example of a conventional emulsion. The particles in this system consist of lipid droplets coated by a layer of protein emulsifier (β-lactoglobulin).
—Small microcluster emulsion (Sample B): An emulsion containing relatively small microclusters of protein-coated lipid droplets was prepared using a method described previously.25,27 Briefly, an aliquot of stock emulsion (Sample A) was added to an alginate solution to reach a final sample composition of 5 wt% corn oil and 0.5 wt% alginate (pH 7). This mixture was then stirred continuously for 30 min and then adjusted to pH 3.5 to promote adsorption of the anionic alginate molecules onto the surfaces of the cationic protein-coated lipid droplets. The particles in this system consisted of β-lactoglobulin coated lipid droplets held together by an alginate matrix.
—Large microcluster emulsions (Sample C): An emulsion containing relatively large microclusters of protein-coated lipid droplets was prepared using a method described previously.25,27 Briefly, aliquots of the small microcluster emulsions (Sample B) were added dropwise into a calcium chloride solution (0.075 wt% CaCl2) using a syringe under continuous stirring. The calcium ions promoted further aggregation of the droplets in the system, leading to a delivery system containing particles that consisted of β-lactoglobulin coated lipid droplets held together by a calcium-alginate hydrogel matrix.
—Filled hydrogel beads (sample D): Filled hydrogel beads were prepared according to a method described previously.27 A solution containing protein-coated lipid droplets and alginate molecules (5% corn oil and 2% alginate) was prepared by mixing stock emulsion (Sample A) and alginate solution together and then stirring for at least 30 min to ensure complete mixing (pH 7). This mixture was then left to stand for a further 30 min to allow any air bubbles to rise to the surface before preparing the beads. Filled hydrogel beads were then prepared using a syringe to drip a total of 6 mL of the droplet-alginate solution into 10 mL of 10 wt% CaCl2 solution with continuous stirring. The resulting beads were then stored overnight in the CaCl2 solution to form hard beads. Beads were then collected by filtration and washed with distilled water to remove excess Ca2+ on the surface. The particles in the filled hydrogel beads consisted of β-lactoglobulin coated lipid droplets embedded within a calcium-alginate hydrogel matrix. The calcium and alginate levels used to form the beads were appreciably higher than those used to form the large microcluster emulsions, which led to appreciable differences in their microstructures.
All samples were stored in the dark after preparation to avoid photo-bleaching of the fluorescent dye. Differences in the above preparation procedures led to the production of four emulsion-based delivery systems with different structural organizations (Fig. 1).
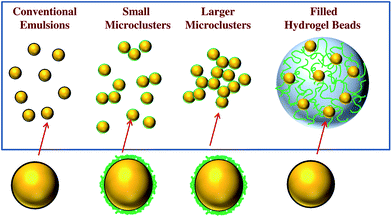 | ||
| Fig. 1 Schematic representation of the different kinds of delivery system used in this study: (A) conventional emulsion; (B) small microcluster emulsion; (C) large microcluster emulsion; (D) filled hydrogel beads. | ||
2.4. In vivo study design
Female Sprague Dawley rats (Crl:SD, about 250 g) were purchased from Charles River Laboratories (Wilmington, MA). The Institutional Animal Care and Use Committee of the University of Massachusetts, Amherst, approved all animal procedures. Animals were housed in individual wire-bottomed cages in a windowless room with a 12-h light-dark cycle. After 7 days of adaptation, feeds were removed, and rats were fasted overnight. The next day, 1 ml of sample (delivery system) was administered into a rat's stomach using a feeding needle (Roboz Surgical Instrument, Gaithersburg, MD). Sample administration was conducted four times with one hour intervals so that we could obtain information about delivery systems present within different locations of the GI tract. One hour after the final administration, the rats were sacrificed by CO2 gas asphyxiation and blood samples were collected via cardiac puncture. Collected blood samples were allowed to clot for 30 min and then the serum layer was separated by centrifugation at 800 g for 20 min at 4 °C. Serum was kept at −80 °C until analysis. The gastrointestinal tract (from stomach to rectum) was removed from the rats, and digesta were collected from stomach (S), duodenum (SI1), jejunum (SI2), and ileum (SI3). The small intestine was flushed with buffer solution (PBS) five times, and 2 cm of jejunum, the middle of the intestine, was collected and used for fatty acid composition analysis.2.5. Particle size measurements
The particle size distribution of the emulsions was measured using a laser light scattering instrument (Mastersizer, Malvern Instruments, MA). This instrument measures the angular dependence of the intensity of laser light (λ = 632.8 nm) scattered by a dilute emulsion and then finds the particle size distribution that gives the best agreement between theoretical predictions (Mie theory) and experimental measurements. To avoid multiple scattering effects, emulsions were diluted to a lipid droplet concentration of approximately 0.005 wt% using buffer solution at the pH of the sample. A refractive index ratio of 1.08 was used in the calculations of the particle size distribution. Particle size measurements are reported as the volume-weighted (d43 = ∑nidi4/∑nidi3) or surface-weighted (d32 = ∑nidi3/∑nidi2) mean diameters, where ni is the number of droplets of diameter di. The hydrogel beads (Sample D) were too large to be analyzed by the laser diffraction method, and therefore their diameter was estimated from optical microscopy images (see next section).It should be noted that particle size measurements made on flocculated emulsions should only be used as a guide to particle aggregation, since the theory used to interpret the data assumes that the particles are homogeneous and spherical, whereas flocs are inhomogeneous and non-spherical. In addition, stirring and dilution may alter the particle size distribution. Nevertheless, light scattering measurements can still be used to provide a qualitative insight into the extent of droplet aggregation in an emulsion system.
2.6. Optical microscopy
The microstructures of selected delivery systems were observed using an optical microscope (Nikon Eclipse E400, Nikon Corp., Japan). Samples were thoroughly mixed in a glass test tube before analysis. A drop of sample was then placed on a microscope slide and covered by a cover slip. The images were captured using a 20× objective lens. An image of the sample was acquired using digital image processing software (Micro Video Instruments Inc., Avon, MA) and stored on a personal computer.A Nikon Confocal Microscope (C1 Digital Eclipse, Tokyo, Japan) with a 60× oil immersion and 20× air immersion objective lens was used to capture the confocal images. Nile Red (a fat soluble fluorescent dye) was excited using a 488 nm argon laser. The fluorescence emitted from the sample was monitored using a fluorescence detector (515/30) with a pinhole size of 150 μm. The resulting images consisted of 512 × 512 pixels, with a pixel size of 414 nm, and a pixel dwell time of 61.44 μs.
2.7. Determination of fatty acid by gas chromatography
Lipids were extracted from samples, jejunum, and blood by the Folch method,28 and then the fatty acids were methylated as previously described.29 Methyl esters of fatty acids were analyzed using a gas chromatography instrument (GC-17A, Shimadzu, Kyoto, Japan) fitted with a flame-ionization detector. A fused-silica capillary column (30 m × 0.25 mm i.d., 0.25 μm film thickness) was used (DB-5, Agilent Technologies, Wilmington, Delaware) and the oven temperature was programmed to be held for 4 min at 180 °C, increased by 4 °C per min to 250 °C, and then held for 5 min. The relative concentration of tridecanoic acid in each sample was determined by dividing its peak area by that of arachidonic acid (a fatty acid found in animal tissue, but not the original delivery systems): | (1) |
2.8. Statistical analysis
All experiments were performed three times on freshly prepared samples. The results were then reported as averages and standard deviations of these measurements.3. Results and discussion
In previous studies, we developed a number of structured delivery systems based on encapsulating lipid droplets within hydrogel matrices, and then showed that they were capable of inhibiting lipid digestion using an in vitro digestion model.25,27 The purpose of the current study was to test similar structured delivery systems using an animal (rat) feeding study to determine whether similar trends were obtained in in vivo and in vitro experiments.3.1 Characterization of initial delivery systems
Initially, we measured the mean particle diameter (Table 1), particle size distributions (Fig. 2), and microstructures (Fig. 3) of the four different emulsion-based delivery systems. There were large differences in the microstructures of the different delivery systems depending on their composition and the preparation method used to fabricate them. The conventional emulsions had a monomodal particle size distribution and a relatively small mean particle diameter (d43 = 0.36 μm). The microstructure images showed that the lipid droplets were uniformly distributed throughout the sample, indicating that it was stable to droplet aggregation. This might be expected since this system consisted of β-lactoglobulin-coated lipid droplets, which should be stable to flocculation at neutral pH due to the strong electrostatic repulsion acting between the droplets.30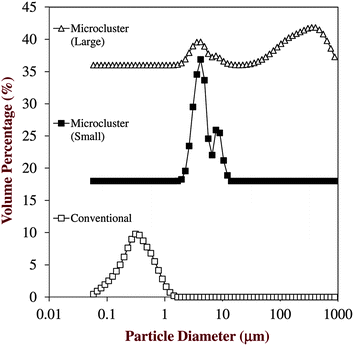 | ||
| Fig. 2 Particle size distributions of the different emulsion-based delivery systems used in this study: conventional emulsion, small microcluster emulsion, and microcluster emulsion. The filled beads were too large to measure by laser diffraction. | ||
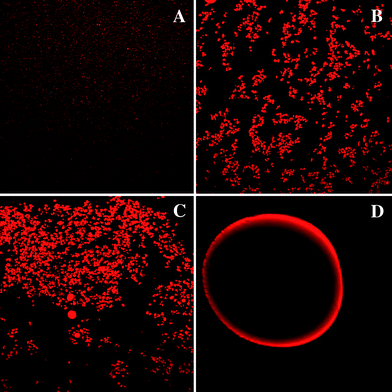 | ||
| Fig. 3 Microstructure of emulsion-based delivery systems before feeding as observed by confocal microscopy: (A) conventional emulsions; (B) small microcluster emulsions; (C) large microclusteremulsions; and, (D) filled hydrogel beads. The images for samples A, B and C were taken using a 60× objective lens and represent an area of 150 × 150 μm, while the images for sample D were taken using a 20× objective lens and represent an area of 450 × 450 μm. | ||
The size of the particles in the small microcluster emulsions (d43 = 4.7 μm) was appreciably larger than that in the conventional emulsions (Fig. 2), and the microstructure images indicated that appreciable droplet aggregation occurred (Fig. 3). The relatively large particle size can be attributed to the adsorption of anionic alginate molecules to the surfaces of the cationic protein-coated lipid droplets, which results in multilayer formation and bridging flocculation, i.e., the linking of positively charged droplets by negatively charged polymers.31,32
The size of the particles in the large microcluster emulsions (d43 = 200 μm) was considerably larger than that in the conventional emulsions (Fig. 2), and large clusters of lipid droplets were clearly observed in the microstructure images (Fig. 3). These results can be attributed to extensive flocculation that occurs when alginate/β-lactoglobulin-coated lipid droplets are injected into a solution containing calcium. Cationic calcium ions (Ca2+) are known to promote the self-association of anionic alginate molecules through an electrostatic bridging mechanism.33 Calcium ions may also promote the aggregation of protein-coated droplets through electrostatic screening and bridging effects.34 It is therefore likely that the anionic protein-coated lipid droplets were held together in microclusters by a calcium alginate network.
The mean diameter of the particles in the filled hydrogel beads (d = 510 μm) was the largest of all of the systems studied. The filled hydrogel beads consisted of lipid droplets dispersed within relatively large spheroid particles, which were presumably comprised of a strong calcium alginate hydrogel. Microstructure images indicated that the lipid droplets were distributed throughout the beads, although there did appear to be some preferential accumulation of lipid droplets towards the outer edges of the beads (Fig. 3). The size of the beads in this system is mainly determined by system composition and injection conditions.27 We used a relatively high alginate and calcium concentration to fabricate the beads (Table 2), which should have led to rapid gelation of the alginate-droplet mixtures as soon as they were injected into the calcium bath. Consequently, the final dimensions of the beads are largely determined by the size of the drops formed by the syringe used to inject the solution containing the lipid droplets and alginate into the calcium bath.
| Sample | Serum | Jejunum |
|---|---|---|
| A – Conventional | 59.3 ± 12.1 (a) | 27.6 ± 6.3 (a) |
| B – Small microcluster | 11.7 ± 3.2 (b) | 13.6 ± 2.8 (b) |
| C – Large microcluster | 5.5 ± 2.4 (c) | 7.0 ± 1.8 (c) |
| D – Filled hydrogel particles | 0.9 ± 0.6 (d) | 1.9 ± 0.8 (d) |
3.2 In vivo evaluation of fate of delivery systems
In this section, the fate of the emulsified lipids within the gastrointestinal (GI) tract of rats was observed after the four different delivery systems were introduced into the animal's stomach. A fluorescent dye (Nile Red) was added to the lipid phase prior to fabricating the delivery systems so as to facilitate identification of the lipid droplets within the GI tract. Aliquots (1 mL) of delivery system were administrated into rat's stomachs using a feeding needle four times at one hour intervals. One hour after the final administration the rats were sacrificed and samples of digesta were collected from the stomach and three locations within the small intestine (SI1, SI2, SI3). For all samples, the digesta collected from the stomach had a red/pink color (Fig. 4), which indicated that some of the lipid droplets remained in the stomach one hour after ingestion. The digesta collected from different regions of the small intestine had a yellow/green/brown appearance, which can be attributed to the presence of bile produced by the liver. We did not observe a strong red color in the samples collected from the small intestine, which suggests that either the lipids did not reach this region of the GI tract or that they had already been digested and absorbed.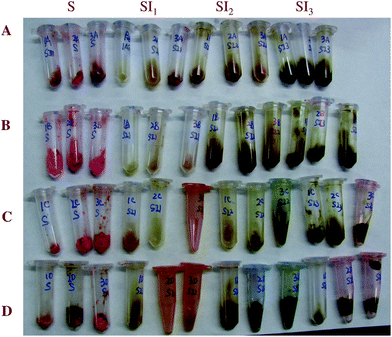 | ||
| Fig. 4 Visible images after feeding at different collecting points (stomach-S, duodenum -SI1, jejunum-SI2, ileum-SI3). The samples are (A) conventional emulsions, (B) small microcluster emulsions, (C) large microcluster emulsions, and (D) filled hydrogel microspheres. | ||
The microstructure of the digesta collected from different regions of the GI tract was examined by optical and confocal microscopy (Fig. 5 and 6). There was strong evidence of droplet flocculation and coalescence in the samples collected from the stomach for the conventional emulsions, small microcluster emulsions, and large microcluster emulsions. On the other hand, the filled hydrogel beads appeared to remain largely intact within the stomach, with only some deformation in their shape being noted. In the different regions of the small intestine (SI1, SI2, SI3) there was little evidence of lipid droplets being present, with the confocal images appearing to be primarily dark (Fig. 5). A number of possible mechanisms could account for the absence of lipid droplets being observed within the small intestine. First, the lipid droplets may not have moved from the stomach to the small intestine. However, previous studies have shown that ingested lipids move into the small intestine of rats within a few hours after feeding, e.g., <3 h.7 In addition, our lipid absorption measurements indicated that lipids had entered the small intestine, at least for the conventional emulsion (see Section 3.3). It is possible that some of the larger particles within the delivery systems were too big to pass through the pyloric sphincter separating the stomach from the small intestine,35 and therefore remained in the stomach for extended periods. This may have been the case for the filled hydrogel beads, which were relatively large (Table 1, Fig. 5). Second, it is possible that the emulsified lipids had passed into the small intestine and were fully digested, leading to the formation of mixed micelles that were absorbed by the animal. The presence of any unabsorbed mixed micelles would be difficult to detect because they are too small to be observed using optical microscopy. The fact that appreciable amounts of marker lipids were detected in the blood of the animals suggests that the lipid was digested and absorbed (see next section).
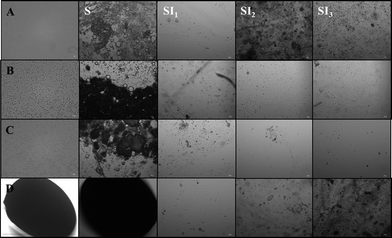 | ||
| Fig. 5 Microstructure of samples taken from different collection points (stomach-S, duodenum -SI1, jejunum-SI2, ileum-SI3) of rat after feeding. The samples are (A) conventional emulsions, (B) small microcluster emulsions, (C) large microcluster emulsions, and (D) filled hydrogel microspheres. The images were taken using a 60× objective lens and represent an area of 117 × 156 μm, except for the first two images for sample D (beads) which were taken using a 20× objective lens and represent an area of 350 × 470 μm. | ||
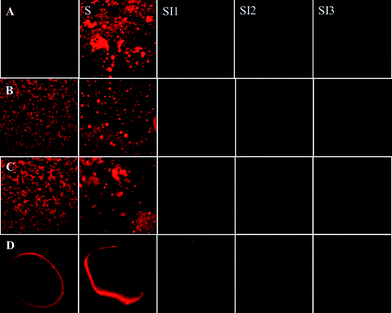 | ||
| Fig. 6 Lipid microstructure of samples taken from different collection points (stomach-S, duodenum-SI1, jejunum-SI2, ileum-SI3) of rat after feeding. Sample Key: (A) conventional emulsions; (B) small microcluster emulsions; (C) large microcluster emulsions; and (D) filled hydrogel beads. The images for samples A, B and C represent an area of 150 × 150 μm, while the images for sample D represent an area of 450 × 450 μm. | ||
3.3 In vivo evaluation of lipid digestion and absorption
The digestion and absorption of the encapsulated lipids was evaluated using gas chromatography (GC) analysis of biological tissue collected from the small intestine (jejunum) and from the serum. A fatty acid marker (tridecanoic) was incorporated into the lipid phase (corn oil) prior to preparing the delivery systems. This fatty acid is not normally found in nature, and therefore measurements of its concentration in segments of the GI tract or in the serum can be used to quantify the amount of lipid coming from the delivery systems (rather than from other sources). The tridecanoic acid was originally incorporated into the lipid phase in the triacylglycerol form, and therefore it has to be digested by lipase before it was converted into the free fatty acid form suitable for GC analysis. Arachidonic acid was used as an internal standard for GC analysis because the lipid phase (corn oil) used to fabricate the delivery systems did not contain significant levels of this fatty acid, whereas the animal tissue and blood naturally contained appreciable levels of this fatty acid.Initially, preliminary experiments were carried out to determine the GC profiles of the different lipid constituents: marker lipid (tridecanoic acid); internal standard (arachidonic acid); carrier lipid (corn oil); and, sample lipid (carrier lipid plus marker lipid) (Fig. 7). The retention times of tridecanoic acid and arachidonic acid were about 6.2 and 19.3 min respectively under the GC conditions used, which meant that the marker and standard lipids could clearly be distinguished from each other. The GC chromatogram of pure corn oil did not contain peaks corresponding to tridecanoic acid or arachidonic acid, which confirmed that these fatty acids were suitable for use as a marker and a standard, respectively. The GC chromatogram of the sample lipid contained peaks corresponding to both corn oil and tridecanoic acid, which is to be expected since the marker lipid was mixed with the corn oil prior to fabricating the delivery systems.
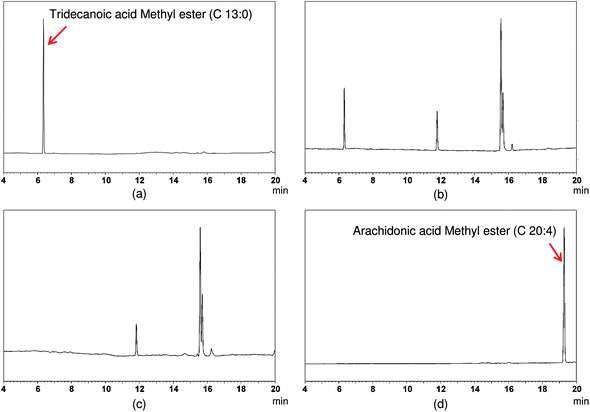 | ||
| Fig. 7 Chromatograms of (a) marker lipid (tridecanoic acid), (b) corn oil + marker lipid, (c) corn oil, and (d) standard lipid (arachidonic acid). These measurements were used to establish the retention time of the different lipids. | ||
GC chromatograms of samples collected from jejunum tissue and from the serum of rats after ingestion of the different delivery systems were measured (Fig. 8). The relative amount of marker lipid (tridecanoic acid) to standard lipid (arachidonic acid) was calculated from this data (Table 2). The amounts of marker lipids detected in both the jejunum and the blood serum were significantly less for the structured delivery systems than for the conventional emulsions. The total amount of marker lipid detected decreased as the size of the hydrogel matrices within the delivery systems increased, i.e., conventional emulsion > small microclusters > large microclusters > filled hydrogel particles. These results indicate that the structure of emulsified lipids had a pronounced influence on the rate of lipid digestion and/or absorption. A number of physicochemical mechanisms may account for the ability of the structured delivery systems to inhibit the digestion and absorption of emulsified lipids, which can be related to either the composition or the structure of the hydrogel matrices surrounding them.
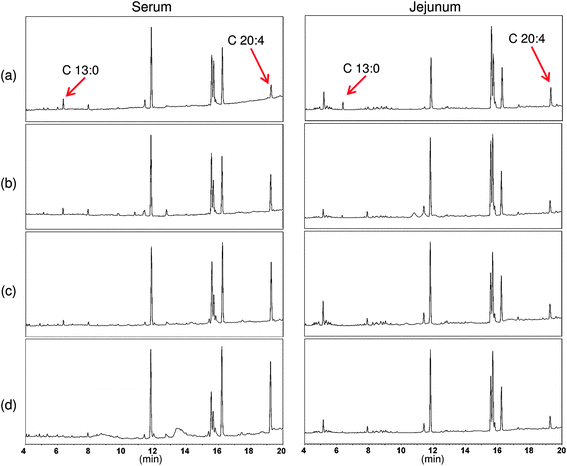 | ||
| Fig. 8 Chromatograms of serum and jejunum fatty acid methyl ester from rats fed (A) conventional emulsions, (B) small microcluster emulsions, (C) large microcluster emulsions, and (D) filled hydrogel microspheres. | ||
The structured delivery systems were fabricated from components (alginate and calcium) that have previously been shown to influence lipid digestion and absorption. Calcium ions can interact with long chain saturated fatty acids to form precipitates (“soaps”) that may be absorbed less readily, thereby reducing lipid absorption.36–38 On the other hand, calcium ions may facilitate lipid digestion by preventing the accumulation of long-chain fatty acids at the droplet surfaces, since this normally restricts the access of lipase to the emulsified lipids.39 Calcium has also been shown to play an important role in the activity of pancreatic lipase, acting as a co-factor required for activity.40 Alginate may influence lipid digestion and absorption through its direct interactions with components present within the GI tract, such as calcium ions or lipase/co-lipase.27,33 For example, anionic alginate can bind cationic calcium ions strongly and therefore prevent them from promoting or inhibiting lipid digestion by the mechanisms discussed earlier.
The structural organization of the molecules within the hydrogel matrices surrounding the lipid droplets may also have influenced lipid digestion and absorption. This effect can be attributed to the ability of the hydrogel matrices to restrict the access of the digestive enzymes (and possibly other components, such as bile acids and co-lipase) to the encapsulated lipid droplets, as well as to the retardation of the movement of digestion products (free fatty acids) away from the droplet surfaces.27,41 Recent studies have shown that the rate of lipid digestion decreases as the size and internal cross-linking of the hydrogel matrices increases.27,41 This effect would account for the fact that we saw lower concentrations of the marker lipid in the jejunum and serum as the size of the hydrogel matrices increased (Table 2). Another possible reason for this phenomenon is that the passage of hydrogel particles from the stomach to the small intestine may have been delayed with increasing particle size due to physical constraints (pylorus sphincter size).
For the conventional emulsion, the concentration of marker lipid measured was higher in the serum (59 ± 12%) than in the jejunum (28 ± 6%) (Table 2). In contrast, there was slightly more marker lipid measured in the jejunum (2–14%) than in the blood serum (1–12%) for the structured delivery systems (Table 2). The level of the internal standard (arachidonic acid) was different in the jejunum and the blood serum, and so it is not possible to directly compare the absolute values. Nevertheless, the difference in the ratios of the marker lipid in the blood serum-to-jejunum suggests that the structured delivery systems were capable of inhibiting the digestion and/or absorption of the lipids compared to the conventional emulsions.
3.4 In vivo – in vitro comparison
Finally, we compared the in vivo digestion/absorption data obtained in this study with the in vitro digestion data we obtained for similar structured delivery systems in earlier studies.25,27,41 The lipid digestion profiles of the four delivery systems measured using a pH-stat method designed to simulate lipid hydrolysis in the small intestine are summarized in Fig. 9. This data clearly shows that the rate of in vitro lipid digestion depends on the nature of the delivery system used. The rate of lipid digestion decreased in the following order: conventional emulsion ≈ small microcluster emulsion > large microcluster emulsion > filled hydrogel beads. The most likely reason that the lipid digestion rates of the conventional emulsion and small microcluster emulsion were fairly similar in the in vitro study is that that the protein-coated lipid droplets and alginate are both negatively charged at pH 7, and therefore the alginate molecules would tend to desorb from the lipid droplet surfaces. Consequently, they will no longer be able to restrict the access of lipase (or other molecules involved in the digestion process) to the lipid droplet surfaces.42 The large microcluster emulsion and filled hydrogel beads both contained appreciable amounts of calcium which may hold the alginate molecules within the hydrogel matrices at neutral pH, and account for their greater effectiveness at inhibiting lipid digestion. Thus, the lipid droplets would have remained embedded within a hydrogel matrix that restricted the access of digestive enzymes to their surfaces.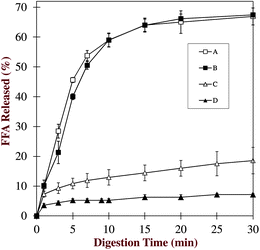 | ||
| Fig. 9 In vitro lipid digestion profiles of various structured delivery systems: (A) conventional emulsions; (B) small microcluster emulsions; (C) large microcluster emulsions; and (D) filled hydrogel beads. This data was taken from previous studies in our laboratory (see text for details). | ||
Overall, there were fairly similar qualitative trends in the digestion rates from the in vitro study (System A ≈ B > C > D) and the digestion/absorption rates in the in vivo study (System A > B > C > D). Nevertheless, there were still some important differences. In particular, the small microcluster emulsion showed less lipid absorption in the in vivo study than the conventional emulsion (Table 2), whereas they were digested at similar rates in the in vitro study (Fig. 9). As mentioned earlier, this may have been because alginate desorbed from the lipid droplet surfaces at neutral pH in the small microcluster emulsions. In addition, the in vitro testing method used in our previous studies only simulated the small intestine phase, but not the stomach phase. Consequently, there may have been appreciable differences in the behavior of the conventional emulsion and small microcluster emulsions in the stomach, which altered their subsequent digestion and absorption in the small intestine. It would therefore be useful to utilize a more sophisticated in vitro digestion model to compare with animal studies in future studies.
It should be noted that a number of other recent studies have reported an influence of the structural organization of lipid droplets within the GI tract on the digestion and release of lipids. Human feeding studies have shown that altering emulsion structure by changing emulsifier type or controlling the physical state of the lipid phase led to differences in blood lipid profiles after consumption.9,16 Reviews of in vitro and in vivo studies of controlling lipid digestion and absorption using various structured delivery systems have also been published recently.8,10,13,43,44 There hence seems to be great potential for using structural design principles to create food products that control the digestion and absorption of lipids at different locations within the GI tract. These structured emulsions may be useful for applications such as controlled release of encapsulated lipophilic compounds within specific regions of the GI tract, or for controlling the feeling of fullness (satiety and satiation) experienced during and after consumption of foods.
4. Conclusions
The influence of encapsulation of emulsified lipids within structured delivery systems upon their fate within the gastrointestinal tract of animals (rats) was studied. Encapsulation of lipids within hydrogel matrices fabricated from dietary fibers (alginate) and divalent cations (calcium) slowed down their digestion and absorption. The magnitude of this inhibition increased as the dimensions of the hydrogel particles containing the lipid droplets increased. A number of physicochemical phenomena may account for this effect including: (i) limitations of the passage of encapsulated lipids through the GI tract due to particle size constraints; (ii) direct interactions between components in the hydrogel matrices (e.g., alginate and calcium) and substances playing a key role in the digestion/absorption process (such as enzymes, bile salts, free fatty acids); (iii) the ability of hydrogel matrices to restrict the access of digestive enzymes (and other components) to the encapsulated lipid droplet surfaces. Further work is required to identify the relative importance of these physicochemical mechanisms for each delivery system, as well as to identify any other potential mechanisms. This will require the preparation of delivery systems with well-defined compositions and microstructures, as well as detailed studies of the changes in their composition and structure as they pass through different regions of the GI tract. This study has important implications for the fabrication of emulsion-based delivery systems designed to control the fate of lipids within the GI tract. These delivery systems could be used to increase the bioavailability of lipophilic components, for controlled or targeted release applications, or for modulating the satiety/satiation response. Consequently, they may be an important tool in the development of functional food products designed to improve human health and wellbeing.Acknowledgements
This material is based upon work supported by United States Department of Agriculture, CREES, NRI and AFRI Grants, and Massachusetts Department of Agricultural Resources.References
- D. J. McClements, E. A. Decker and Y. Park, Crit. Rev. Food Sci. Nutr., 2009, 49, 48–67 CrossRef.
- C. J. H. Porter, N. L. Trevaskis and W. N. Charman, Nat. Rev. Drug Discovery, 2007, 6, 231–248 CrossRef CAS.
- H. Singh, A. Ye and D. Horne, Prog. Lipid Res., 2009, 48, 92–100 CrossRef CAS.
- C. J. H. Porter, K. M. Wasan and P. Constantinides, Adv. Drug Delivery Rev., 2008, 60, 615–616 CrossRef CAS.
- S. Kosaraju, Crit. Rev. Food Sci. Nutr., 2005, 45, 251–258 CrossRef CAS.
- A. R. Patel and K. P. Velikov, LWT–Food Sci. Technol., 2011, 44, 1958–1964 CrossRef CAS.
- M. A. Augustin, M. Y. Abeywardena, G. Patten, R. Head, T. Lockett, A. De Luca and L. Sanguansri, J. Funct. Foods, 2011, 3, 25–37 Search PubMed.
- M. Golding and T. J. Wooster, Curr. Opin. Colloid Interface Sci., 2010, 15, 90–101 CrossRef CAS.
- M. Golding, T. J. Wooster, L. Day, M. Xu, L. Lundin, J. Keogh and P. Clifton, Soft Matter, 2011, 7, 3513–3523 RSC.
- D. J. McClements, in Annual Review of Food Science and Technology, M. P. Doyle and T. R. Klaenhammer, Annual Reviews, Palo Alto, CA, vol. 1, 2010, pp. 241–269 Search PubMed.
- A. Muellertz, A. Ogbonna, S. Ren and T. Rades, J. Pharm. Pharmacol., 2010, 62, 1622–1636 CrossRef.
- D. J. McClements, J. Food Sci., 2010, 75, R30–R42 CrossRef CAS.
- D. J. McClements and Y. Li, Adv. Colloid Interface Sci., 2010, 159, 213–228 CrossRef CAS.
- W. Mehnert and K. Mader, Adv. Drug Delivery Rev., 2001, 47, 165–196 CrossRef CAS.
- S. A. Wissing, O. Kayser and R. H. Muller, Adv. Drug Delivery Rev., 2004, 56, 1257–1272 CrossRef CAS.
- J. B. Keogh, T. J. Wooster, M. Golding, L. Day, B. Otto and P. M. Clifton, J. Nutr., 2011, 141, 809–815 CrossRef CAS.
- A. Dahan and A. Hoffman, J. Controlled Release, 2008, 129, 1–10 CrossRef CAS.
- S. J. Hur, B. O. Lim, E. A. Decker and D. J. McClements, Food Chem., 2011, 125, 1–12 CrossRef CAS.
- D. G. Fatouros and A. Mullertz, Expert Opin. Drug Metab. Toxicol., 2008, 4, 65–76 Search PubMed.
- D. J. McClements and Y. Li, Food Funct., 2010, 1, 32–59 RSC.
- G. Y. Park, S. Mun, Y. Park, S. Rhee, E. A. Decker, J. Weiss, D. J. McClements and Y. Park, Food Chem., 2007, 104, 761–767 CrossRef CAS.
- C. J. H. Porter, A. M. Kaukonen, A. Taillardat-Bertschinger, B. J. Boyd, J. M. O'Connor, G. A. Edwards and W. N. Charman, J. Pharm. Sci., 2004, 93, 1110–1121 CrossRef CAS.
- J. H. Lee, J. S. Jeong, S. W. Park, D. S. Kim, W. Kim, S. I. Ahn, J. H. Park, Y. T. Kim, H. S. Shin, J. M. Rhee and G. Khang, J. Tissue Eng. Regener. Med., 2008, 5, 750–757 Search PubMed.
- M. Ostrowski and T. Baczek, Curr. Pharm. Anal., 2010, 6, 289–298 Search PubMed.
- Y. Li, M. Hu, H. Xiao, Y. M. Du, E. A. Decker and D. J. McClements, Eur. J. Pharm. Biopharm., 2010, 76, 38–47 CrossRef CAS.
- Y. Li and D. J. McClements, Food Hydrocolloids, 2011, 25, 1025–1033 CrossRef CAS.
- Y. Li, M. Hu, Y. M. Du, H. Xiao and D. J. McClements, Food Hydrocolloids, 2011, 25, 122–130 CrossRef CAS.
- J. Folch, M. Lees and G. H. S. Stanley, J. Biol. Chem., 1957, 226, 497–509 CAS.
- Y. Park and M. W. Pariza, Lipids, 1998, 33, 817–819 CrossRef CAS.
- D. Guzey and D. J. McClements, J. Agric. Food Chem., 2007, 55, 475–485 CrossRef CAS.
- D. J. McClements, Langmuir, 2005, 21, 9777–9785 CrossRef CAS.
- Y. H. Cho and D. J. McClements, Langmuir, 2009, 25, 6649–6657 CrossRef CAS.
- M. Hu, Y. Li, E. A. Decker and D. J. McClements, Food Hydrocolloids, 2010, 24, 719–725 CrossRef CAS.
- U. Lesmes, P. Baudot and D. J. McClements, J. Agric. Food Chem., 2010, 58, 7962–7969 CrossRef CAS.
- T. T. Kararli, Biopharm. Drug Dispos., 1995, 16, 351–380 CAS.
- J. K. Lorenzen, S. Nielsen, J. J. Holst, I. Tetens, J. F. Rehfeld and A. Astrup, Am. J. Clin. Nutr., 2007, 85, 678–687 CAS.
- T. Karupaiah and K. Sundram, Nutr. Metab., 2007, 4, 1–17 CrossRef.
- K. E. Scholz-Ahrens and J. Schrezenmeir, Int. Dairy J., 2006, 16, 1399–1407 CrossRef CAS.
- G. Fave, T. C. Coste and M. Armand, Cellular and Molecular Biology, 2004, 50, 815–831 Search PubMed.
- M. Mukherjee, J. Mol. Catal. B: Enzym., 2003, 22, 369–376 CrossRef CAS.
- Y. Li and D. J. McClements, Food Hydrocolloids, 2011, 25, 1025–1033 CrossRef CAS.
- M. Hu, Y. Li, E. A. Decker, H. Xiao and D. J. McClements, Food Biophys., 2011, 6, 37–48 CrossRef.
- S. Sandra, E. A. Decker and D. J. McClements, J. Agric. Food Chem., 2008, 56, 7488–7494 CrossRef CAS.
- H. Singh, A. Q. Ye and D. Horne, Prog. Lipid Res., 2009, 48, 92–100 CrossRef CAS.
| This journal is © The Royal Society of Chemistry 2012 |