 Open Access Article
Creative Commons Attribution 3.0 Unported Licence
Exploiting the spontaneous potential of the electrodes used in the capacitive mixing technique for the extraction of energy from salinity difference†
D.
Brogioli
*a,
R.
Ziano
a,
R. A.
Rica
a,
D.
Salerno
a,
O.
Kozynchenko
b,
H. V. M.
Hamelers
cd and
F.
Mantegazza
a
aDipartimento di Medicina Sperimentale, Università degli Studi di Milano – Bicocca, Via Cadore 48, Monza (MB) 20900, Italy. E-mail: dbrogioli@gmail.com
bMAST Carbon International Limited, Viable Estate, Jays Close, Basingstoke, Hampshire RG22 4BA, UK
cWetsus – Centre of Excellence for Sustainable Water Technology, Agora 1, 8900 CC Leeuwarden, The Netherlands
dWageningen University, 6708 HD Wageningen, The Netherlands
First published on 25th September 2012
Abstract
The “capacitive mixing” (CAPMIX) technique is aimed at the extraction of energy from the salinity difference between the sea and rivers. It is based on the voltage rise that takes place at the electrodes when changing the salt concentration of the solution in which the two electrodes are dipped. In this paper, we focus on activated carbon electrodes, produced with various methods and treatments, and we measure their behaviour in CAPMIX experiments. We find that they behave as polarizable electrodes only on time scales of the order of minutes, while on longer time scales they tend to move to a specific “spontaneous” potential, likely due to chemical redox reactions. This analysis sheds light on the charge leakage, i.e. the loss of the stored charge due to undesired chemical reactions, which is one of the main hurdles of the CAPMIX technique when performed with activated carbon electrodes. We show that the leakage finds its origin in the tendency of the electrode to move to its spontaneous potential. Our investigation allows us to completely get rid of the leakage and demonstrates the striking result that CAPMIX cycles can be performed without an external power supply.
Broader ContextThe controlled mixing of the water from a river and from the sea can be used for producing electrical energy. In the two main existing technologies, namely “pressure retarded osmosis” and “reverse electrodialysis”, the control of the mixing is obtained by interposing membranes which can be crossed by either the water or the ions. In the recently proposed “capacitive mixing” (CAPMIX) technique, the freshwater and the saltwater flow through the cell in alternating phases. The mixing is obtained by electrically storing the ions inside two electrodes during the saltwater flow and releasing them during freshwater flow. The electrodes can be either chemically inert porous materials [D. Brogioli, Phys. Rev. Lett., 2009, 103, 058501], or membrane-based ion-selective electrodes [B. B. Sales et al., Env. Sci. Techn., 2010, 44, 5661], or chemically active materials, like in batteries [F. La Mantia et al., Nano Lett., 2011, 11, 1810]. In this paper, we present the analysis of activated carbon materials produced with various methods and treatments and we show that their behavior in CAPMIX experiments can display features coming both from the electric double layer and from chemical reactions, including redox reactions and chemical adsorption. By exploiting the new information, we are able to improve the energy extraction, up to the value of 50 mW per square meter of electrode. |
I. Introduction
The mixing of saltwater with freshwater, which takes place at the river estuaries, is accompanied by a huge loss of free energy, due to the entropy increase experienced by the solutions, when the ions become free to move in a larger volume. The free energy change upon mixing is around 2.4 kJ when one liter of freshwater is poured into the sea.1 The total free energy dissipated by all the rivers of the world is around 2 TW, a relevant part of the global energy need.2,3This promising source of energy has been noticed since the 1950s,4–6 but a commercially viable technology to tap this energy source has not yet been found. In order to harvest the available free energy, it must be intercepted by interposing a suitable device between the salt and the freshwater, so that the mixing takes place in a controlled way.
In pressure-retarded osmosis (PRO),7–9 a semi-permeable membrane is interposed between the flows of salt and freshwater. Osmosis generates a hydrostatic head and a water flow, which is converted into electrical current using a turbine. Another method, based on the vapour pressure difference between freshwater and saltwater, has been proposed.10 The mixing of solutions is performed in a controlled way in both methods, because only the water or its vapour is allowed to move between the solutions of different salt concentrations.
A different approach is used in reverse electrodialysis (RED).2,11 This technique is based on a stack of positively and negatively charged ion-exchange membranes, where the solutions with different concentrations flow in adjacent compartments. The Donnan potentials developed across the membranes are used to generate a current, which is collected by the electrodes placed in the final compartments of the stack. In this case, the control of the mixing is obtained by means of the membranes, which allow the migration of only one species of ions between the solutions of different concentrations, while the exchange of water molecules through the membrane is irrelevant in this case.
Prototypes have been built for both PRO12 and RED.2,11 The main difficulty of these techniques concerns the use of membranes, which are prone to fouling; moreover, permeabilities and selectivities still need to be improved before successful application.2,11
Recently, a new concept has been proposed, which led to a new family of techniques, called “capacitive mixing” (CAPMIX).3,13,14 In this approach, the high-concentration and the low-concentration salt solutions do not flow simultaneously in different compartments of the cell; instead, the solutions of different salinities flow through the same compartment in different, consecutive moments, obtaining the cycles shown in Fig. 1. The CAPMIX cell contains two electrodes, as will be described in more detail below, immersed in a solution with uniform concentration. Starting with the cell filled with saltwater, the cycle is composed of the four following phases:
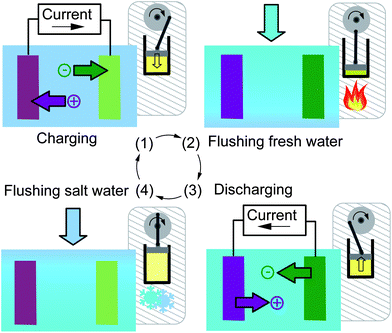 | ||
| Fig. 1 Cycles of the CAPMIX technique. The cycle starts with the cell filled with saltwater. The phases are: (1) charging, (2) flow of freshwater, (3) discharging, and (4) flow of saltwater. The image shows the analogy with the heat engine, with the corresponding phases, namely (1) compression, (2) heating, (3) expansion, and (4) cooling. | ||
1. The cell is charged by means of an imposed electrical current.
2. The solution in the cell is substituted by freshwater in open circuit.
3. The cell is discharged by means of an electrical current flowing in the opposite direction with respect to phase (1).
4. The solution in the cell is substituted with saltwater in open circuit.
The electrical charge is temporarily stored in the electrodes in phase (1), and is later extracted in phase (3). The solution change that takes place in phase (2) induces an increase of the voltage of the cell called “voltage rise”. This corresponds to an extraction of electrical energy because the discharging phase is performed at a higher voltage than the charging phase. Finally, phase (4) closes the cycle.
This cycle has a strong analogy with the thermodynamic cycle of a heat engine,13,15 see Fig. 1. The charge corresponds to the volume of the gas, and the pressure corresponds to the voltage. In the heating phase (2), the pressure increases, and in the cooling phase (4) the pressure decreases. By moving the piston, the volume is changed by the same amount in phases (1) and (3), but at different pressures. The work that the engine performs during expansion (discharging) exceeds the work done by the external system during compression (charging), giving a positive net energy production.
The cycle is quantitatively represented in Fig. 2 by means of the voltage versus charge graph. The graphs show the behaviour of three different kinds of electrodes, that will be discussed in more detail later. The lines representing phases (1) and (3) show the change of accumulated charge, while the lines representing phases (2) and (4) are obtained in open circuit and show the voltage rise and fall due to the change of salinity. We see that the charging curve is at a higher voltage than the discharging curve, and thus the energy enclosed in the counter-clockwise cycle represents the extracted energy. Following the analogy with the heat engine, the presented cycle is the analogous of the volume versus pressure graph.
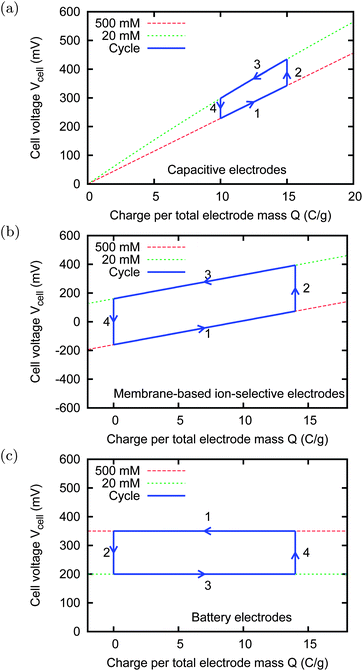 | ||
| Fig. 2 Charge–voltage cycles (schematic sketches). The phases are: (1) charging, (2) flow freshwater, (3) discharging, and (4) flow saltwater. The area enclosed by the counter-clockwise cycle represents the extracted electrical energy. The freshwater and saltwater solutions have respectively the concentrations cf = 20 mM and cs = 500 mM. Panel (a): ideal capacitive electrodes for CDLE. Panel (b): membrane-based ion-selective electrodes for CDP. Panel (c): battery electrodes, such as AgCl/Na2Mn5O10. The green and red continuous lines represent the voltage versus charge graphs at a fixed salt concentration. | ||
Various kinds of electrodes have been used with a technique based on the CAPMIX cycle. They can be classified on the physical mechanism leading to the voltage rise obtained as a consequence of salt concentration change.
• Porous “supercapacitor” electrodes,16–18 made of activated carbon, are the first proposed solution.13,19 The voltage versus charge relation, shown in Fig. 2(a), is determined by the electric double layers on the surface of the carbon, classically described by the Gouy–Chapman–Stern (GCS) model.20 It can be noticed that, at a fixed charge, the voltage becomes higher when the salt concentration becomes lower. This effect constitutes the voltage rise upon concentration reduction. Physically, it is due to the so-called “capacitive double layer expansion” (CDLE) effect,13,19,21,22 which is not discussed here. It is worth noting that the voltage rise depends on the initial charge accumulated in the double layers, and vanishes for completely discharged electrodes.
• In the technique called “Capacitive energy extraction based on Donnan Potential” (CDP),3 each electrode is an assembly composed of an activated carbon film and an ion-exchange membrane which separates the carbon from the solution in the cell.3,23 Such assemblies can be actually described as membrane-based ion-selective electrodes, similar to the ones that are commonly used in electrochemistry. The voltage versus charge relation, shown in Fig. 2(b), is determined by the Donnan potential across the ion-exchange membrane.
• Battery electrodes have been used to extract energy from salinity differences with the CAPMIX cycle.24 Actually, in this case the ion storage is not capacitive, but based on a battery, and thus the more appropriate name should be “accumulator mixing”. The voltage versus charge relation, shown in Fig. 2(c), is determined by the redox reactions which take place on the surface of the electrode, described by the Nernst equation. In this case, the voltage should not depend on the charge.
The energy produced with a CAPMIX method is actually extracted from the free energy of mixing of the two salt solutions. The current flowing in phase (1) results in a temporary storage of ions extracted from the saltwater; the ions are then released into the freshwater in phase (3). The migration of ions from the high-concentration to the low-concentration solution is mediated by their temporary storage inside the electrodes, and the free energy decrease associated with this controlled mixing becomes available in the form of electrical energy. Indeed, we have recently shown that the ability of an electrode to adsorb salt together with charge by any storage mechanism is connected to the voltage rise.22
The temporary storage of ions inside the electrodes, during phase (1), is due to a different physical mechanism in each kind of electrode. In the porous electrodes made of activated carbon, for the CDLE technique, the ions are stored in the electric double layers. In the battery electrodes, the ions undergo a redox reaction, and are temporarily stored as different chemical compounds, possibly inside the crystalline structure of the electrode. Finally, in the electrodes used for CDP, the ions are stored both in the electric double layer on the surface of the carbon, and in the solution between the membrane and the carbon. The coexistence of various storage mechanisms has already been noticed.25
The CAPMIX technique can be interpreted as the inverse of capacitive deionization,26 and the CAPMIX technique with battery electrodes24 is the inverse of the deionization technique with battery electrodes.27 It is worth noting that the cycle representation in the charge versus voltage graph has been reported first in the context of capacitive deionization.28 The other cited energy extraction techniques can also be described as the inverse of known desalination techniques, in particular PRO,7,8 RED,2,11 and the vapour pressure method10 are respectively the reverse of the desalination methods called reverse osmosis, electrodialysis and vacuum distillation.
One of the main obstacles for the practical application of the CDLE technique comes from the fact that the cell must be charged by means of an external power supply. In an ideal condition, the charge that is stored in the cell in phase (1) should be completely recovered in phase (3). In practical cases, the charge recovered in phase (3) is often less than the charge stored in phase (1), due to the so-called leakage current. The effect of the leakage current, discussed in Section III, is that the external power supply must continuously provide a current for compensating the leakage. This current represents also a power loss that, in practical cases, can be larger than the power produced by the CAPMIX cycle.
The CDLE technique is very promising, due to the low cost of the activated carbon materials, but the problem of leakage must be solved. In order to tackle this problem, we studied the leakage from a different point of view, i.e., by measuring not only the properties of the cell as a whole, but measuring the potentials of the single electrodes with respect to a reference electrode.
In Section III, we show that the leakage consists in the tendency of the charged electrodes to move toward a given “spontaneous potential”: the activated carbon electrodes are not ideally polarizable. They can be charged, and they could maintain their charge for some minutes, but, on longer time scales, they tend to come back to their spontaneous potential.
In Section IV, we analyze the behaviour of the potential of the two electrodes independently upon salinity change. We observe a potential rise even when the electrodes are not externally charged which depends on the material.
In Section V, we show that different materials have different spontaneous potentials, likely generated by chemical reactions or specific adsorption of ions. This enables us to devise a method for completely avoiding the effects of leakage in the CAPMIX technique. In this method, the two electrodes are made of different materials with different spontaneous potentials. A spontaneous cell voltage is present between them, equal to the difference between the spontaneous potentials of the two electrodes. The external voltage is then chosen equal to the spontaneous cell voltage. In this way, the electrodes stay at their spontaneous potential and no leakage takes place.
We find that the dependence of the potential of the activated carbon electrodes on the salt concentration shows significant deviations from GCS theory. This suggests that part of the charge actually accumulates by means of redox reactions, like in battery electrodes,24 or that specific adsorption of ions takes place. Thanks to the presence of various physical processes leading to the variation of the potential upon concentration change, it is possible to find different electrodes that have the same spontaneous potential, but change their potential in different ways upon concentration change. With such electrodes, we chose the external voltage VExt = 0 V, and we still get a cell voltage rise upon concentration change. In other words, it is possible to make a CAPMIX cycle without externally charging the electrodes, therefore without using any power supply.
The improvements obtained with this method can be evaluated in terms of the specific surface power, i.e. the produced power per unit surface of the electrode material. In the proof of principle of CDLE,13 the specific surface power was about 7 mW m−2. A much larger prototype cell,19 able to generate some Joules per cycle, reached a higher value of specific surface power. The highest specific surface power obtained reported in this paper is around 50 mW m−2, and the principles here proposed open a new way for further improvements.
II. Experimental setup
The cell used for the experiments described in this paper is shown in Fig. 3. The two activated carbon electrodes under analysis are dipped into the salt solution, which can be exchanged between the content of two water reservoirs, containing NaCl at cf = 20 mM and cS = 500 mM.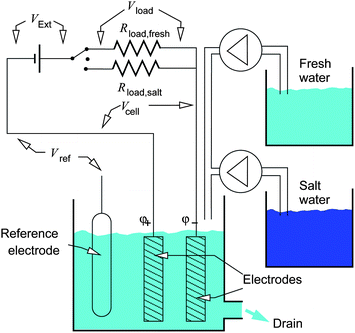 | ||
| Fig. 3 Schematic view of the experimental cell for CAPMIX energy extraction and of the electric circuit. The external power supply provides the external voltage VExt. The resistors Rload,fresh and Rload,salt represent the loads, i.e. the devices that are powered by the system; they are used respectively in freshwater and saltwater. The solutions contained in the two reservoirs, at cf = 20 mM and cs = 500 mM of NaCl, flow in the cell in different phases of the CAPMIX cycle. The potentials of the single electrodes are measured independently with respect to the reference electrode, that is used only for measurement purposes and does not play any role in the energy production cycles. | ||
The load, i.e. the device to be powered, is represented by the resistors Rload,salt and Rload,fresh, that are used respectively in phases (1) and (3). We use two different loads in order to match the internal resistance of the cell, that depends on the salt concentration.
The experiments presented in this paper make use of the constant-voltage scheme. The cell is connected in series with the load. The circuit is connected, during phases (1) and (3), to the power supply, which provides a constant voltage VExt,13,19 that is called “external voltage”. Neglecting the leakage current of the cell, the charge which enters and exits at each cycle from the power supply is nearly the same, and flows at the same voltage VExt: the power supply does not consume energy, and can be seen as the equivalent of the flywheel of the heat engine.
We added a reference electrode (Ag/AgCl/KCl) with 3 M KCl to the cell in order to monitor independently the potentials of the two single electrodes. The potentials of the two electrodes with respect to the reference electrode are:
| φ− = Vref | (1) |
| φ+ = Vcell + Vref | (2) |
In the following, we use the symbol φ for the potentials of the electrodes, measured with respect to the reference electrode, and we use the symbol V for the voltages, i.e. the difference of potentials, in particular for the difference between the potentials of the two electrodes.
A. Materials
In this paper, we analyze various activated carbon materials produced in different ways. Table 1 shows a list of these materials. The films are prepared by casting a slurry with the activated carbon powder and 10% of polyvinylidene fluoride (PVDF) on a graphite substrate. Only in the case of the 45 μm-thick NS30 sample the substrate is stainless steel.| Name | Form | Thickness (μm) | Producer | Surface (m2 g−1) | Notes |
|---|---|---|---|---|---|
| MCC | Cloth | ≈400 | Mast Carbon | 976 | Derived from viscose rayon fabric |
| PAN | Cloth | ≈400 | Mast Carbon | 515 | Derived from polyacrylonitrile (PAN) fabric |
| THM | Film | 200 | Mast Carbon | 1011 | Three-modal (nano–meso–macroporous) |
| NS30 | Film | 45, 100, 200 | Norit | 1650 | Commercial, Norit Super 30 |
| NS50 | Film | 105 | Norit | 1400 | Commercial, Norit Super 50 |
| A-PC-2 | Film | 40 | Wrocław University | 1167 | KOH activated pitch coke, KOH/coke ratio 2![[thin space (1/6-em)]](https://www.rsc.org/images/entities/char_2009.gif) : :![[thin space (1/6-em)]](https://www.rsc.org/images/entities/char_2009.gif) 1, ash free 1, ash free |
| A-PC-4 | Film | 75 | Wrocław University | 2617 | KOH activated pitch coke, KOH/coke ratio 4![[thin space (1/6-em)]](https://www.rsc.org/images/entities/char_2009.gif) : :![[thin space (1/6-em)]](https://www.rsc.org/images/entities/char_2009.gif) 1, ash free 1, ash free |
| CWZ | Film | 180 | Gryfskand | 998 | Commercial, steam activated, from coal (5% ash) |
The electrodes (both the cloths and the films) are prepared before the experiments by dipping them into a 2% ethanol solution, kept under medium vacuum, at a pressure around the boiling point of the solution, in order to remove the air. The electrodes are then put into the 500 mM NaCl salt solution for 12 hours, under atmospheric pressure, before starting the experiments.
III. The charge leakage in the activated carbon electrodes
Fig. 4 shows two typical results of a sequence of CAPMIX cycles. It can be noticed that the cycle moves towards the right. This is due to charge leakage: at each cycle, the amount of charge transferred to the cell in phase (1) is larger than the charge that is taken back in phase (3); the missing charge is lost, likely due to Faradaic reactions on the surface of the carbon.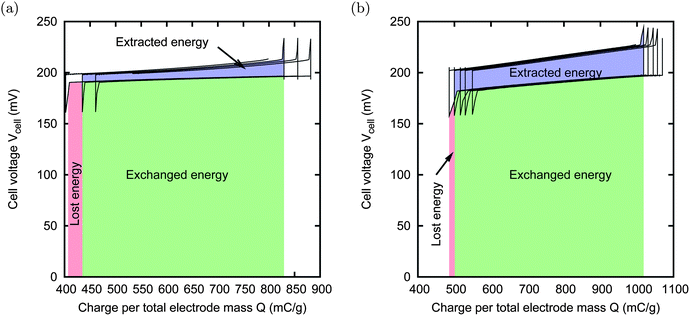 | ||
| Fig. 4 Consecutive CAPMIX cycles with external voltage VExt = 200 mV and concentrations cs = 500 mM and cf = 20 mM. Panel (a): THM sample, Rload,salt = 5 Ω, Rload,fresh = 30 Ω. Panel (b): NS30, 45 μm thick film, Rload,salt = 20 Ω, Rload,fresh = 90 Ω. In both cases the electrode size is 15 × 15 mm, and the gap between them is 1 mm. A drift towards the right can be noticed due to the charge leakage inside the electrodes. The red and green areas represent the energy spent during the charging phase, while the blue and green areas represent the energy produced during the discharging phase. The net produced energy is thus the difference between the blue and the red areas. The cycles depicted in (a) lead to no net energy production. In the case (b), the leakage is much smaller, and a net energy of 135 μJ is extracted per cycle, corresponding to a power production of about 4 mW m−2. | ||
The effect of the leakage on the energy extraction during the first cycle is graphically shown with the colored areas. The energy that is consumed by the external electric system (including the power supply and the load) during phase (1) is the area below the curve, corresponding to the parts colored in red and green. The energy that is extracted from the cell corresponds to the parts colored in blue and green. The difference between the two areas is the actual extracted energy. Since the green part is common, we can consider only the blue area as extracted energy, i.e. the area enclosed in the cycle, and only the red area as energy lost due to the leakage, i.e. the nearly rectangular area, which has the lost charge as base, and VExt as height.
Until now, the maximum power obtained with this technique is of the order of 10 mW m−2. The main obstacle for improving this figure is mainly due to leakage: increasing the external voltage would increase the voltage rise, but also the leakage, and a good compromise between the two tendencies is achieved at VExt = 200 mV (data not shown).
The leakage consists in a reduction of the charge accumulated in the electric double layers of one or both electrodes. Overall, it can be represented as the recombination of the charges of an electric double layer, i.e. it consists in a redox reaction. It is thus useful to study the leakage of the two electrodes independently, because the corresponding redox reaction should depend on the polarity of the electrode. In order to investigate this point, we measure the potentials of each activated carbon electrode independently, i.e. φ+ and φ−, by means of the reference Ag/AgCl/KCl electrode.
Fig. 5 shows the results obtained through the following experiment. An external voltage VExt is applied for 10 minutes; within this time, the cell voltage Vcell reaches a plateau. The value of the plateau is reported in Fig. 5(a): we can observe that it is very close to VExt. Moreover, the electrode potentials φ+ and φ− also reach a plateau whose values are shown in Fig. 5(b). It can be noticed that, when the cell is completely discharged, i.e. with Vcell = 0 V, the electrodes are at the same potential, because Vcell = φ+ − φ− = 0 V. We call this potential “spontaneous potential”, which corresponds to the “open circuit potential” of Goldin et al.29 It is worth noting that it does not correspond to the absence of charge, i.e. to the zero charge potential.
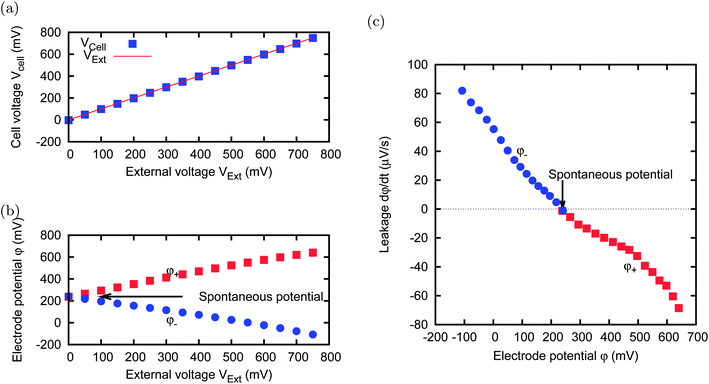 | ||
| Fig. 5 A cell with two electrodes (MCC, 5 × 5 mm), immersed in a cs = 500 mM salt solution, is charged for 10 minutes at every value of the external voltage VExt shown in the horizontal axis of panels (a) and (b). The resulting cell voltage Vcell is shown in panel (a) and the single electrode potentials φ+ and φ− (independently measured by using the reference electrode) are shown in panel (b). After charging, the circuit is open for 30 s, and the leakage is evaluated in terms of potential fall speed, shown in panel (c). The leakage tends to bring the electrodes to their spontaneous potential. | ||
After each charging phase, we open the circuit for 30 s; during this time, we monitor the change in the potentials of the two electrodes. The variation, during the 30 s in the open circuit, is of the order of a few millivolts or less, and is due to the leakage. We define the leakage speed as the derivative of the potential with respect to time during the open circuit phase. We repeated the procedure for various external voltages. The leakage speeds measured for various external voltages are reported in Fig. 5(c). It can be noticed that the leakage speed is negative for the electrode that is charged at a potential higher than the spontaneous potential, and is positive in the other case. This means that each electrode tends to come back to its spontaneous potential, which is not necessarily equal for every material. This process shows that the electrodes behave as polarizable on time scales of the order of the minutes and non-polarizable on the time scale of the hours, while they display a very complex behaviour in between.
The presence of a spontaneous potential, different for various materials, is already known, and has been exploited in CDI devices.30
IV. The rise of the potential upon concentration reduction
The cell voltage rise upon the decrease of salt concentration is the effect of the individual variations of the potential of both electrodes. In this section, we investigate the variations of the potential due to the concentration change in the two electrodes, independently considered. Fig. 6 shows the electrode potentials φ+ and φ−. The solution concentration is switched between 20 mM and 500 mM solution for every 130 s. The cell is filled with freshwater for 40 s, then with saltwater for 30 s, and finally it is charged for 60 s by applying the external voltage VExt in the same salt solution. The graph shows the variations of the potential, caused by the concentration changes. We call “base potential” φ0 the electrode potential in saltwater, i.e. the potential reached during the charging phase, and we call “potential rise” Δφ the difference between the potential reached in freshwater and the base potential.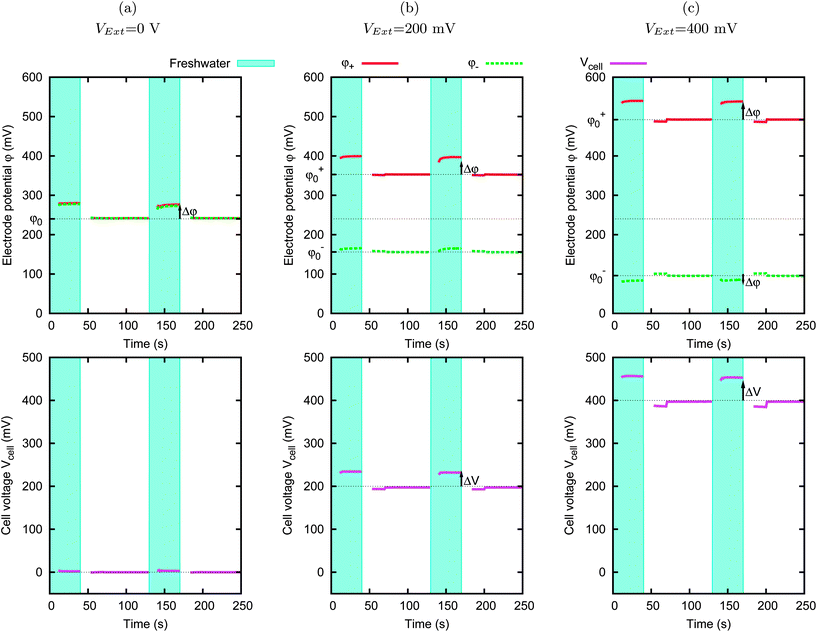 | ||
| Fig. 6 Effect of salinity change on the electrode potentials. The concentration of the solution is switched between cf = 20 mM and cs = 500 mM for every 130 s. Both electrodes are MCC, 5 × 5 mm, with a 1 mm gap between them. The various panels correspond to different external voltages VExt. The upper row of graphs shows the potentials of the two electrodes, i.e. φ+ and φ−. The lower row of graphs shows the cell voltage, i.e. Vcell = φ+ − φ−. | ||
Fig. 6(a) shows the results obtained just after dipping the electrodes in the solution, with VExt = 0 V (the potentials of the two electrodes are equal). The other panels show the results obtained after charging at two different values of VExt (200 mV and 400 mV) for two hours. Due to the charging process, the base potentials φ0 of the electrodes change and are about ±VExt/2, resulting in a cell voltage Vcell ≈ VExt. The salinity change is performed on a time scale of the order of seconds, and on this time scale the electrodes can be considered as polarizable, as already discussed in Section III. In particular, we can assume that they hold their charge while the salinity changes are performed. We observe that, for both electrodes and for the various base potentials, the potentials of the single electrodes φ+ and φ− change when the concentration of the solution changes. Quite surprisingly, this change takes place also for the completely discharged cell. Anyhow, this effect cannot be seen without measuring the potentials of the single electrodes independently, and indeed, in this case, the cell potential Vcell = φ+ − φ− = 0 V is not affected by the salinity change. The graph also shows that the potential rise Δφ is larger when the electrode is charged to a higher potential and, on the other hand, for the lowest potential we reach, i.e. around 100 mV, the potential changes in the opposite way, i.e., it decreases upon salinity decrease.
The electrode potential rise Δφ and the electrode base potential φ0 are reported in Fig. 7. The arrows connect couples of points on the graph representing the two electrodes in the same measurement during the experiment shown in Fig. 6. The displacement along the x-axis represents the cell voltage, corresponding to the difference between the base potentials φ0 of the two electrodes and nearly corresponds to the external voltage VExt. The displacement along the y-axis represents the voltage rise of the whole cell.
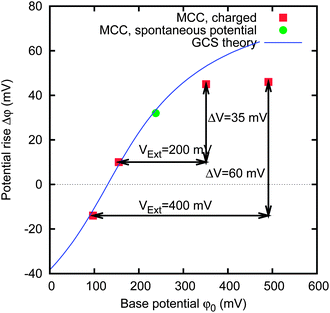 | ||
| Fig. 7 Potential rise Δφ upon salt concentration decrement and the electrode base potential φ0 in saltwater. The sample is the same as that of Fig. 6. The solid line represents the result of GCS theory. | ||
This kind of graph contains some of the information of the charge versus potential graph. Indeed, the charge versus potential graph is implicitly defined by the function φ(Q,c), i.e. the potential of the electrodes at a given charge Q and concentration c. On the other hand, the potential rise Δφ versus base potential φ0 is defined by the parametric curve with curvilinear abscissa Q:
| φ0 = φ(Q,c = 500 mM) | (3) |
| Δφ = φ(Q, 20 mM) − V(Q, 500 mM). | (4) |
The potential rise Δφ versus base potential φ0 graph has the advantage that the quantities Δφ and φ0 are directly accessible, without the knowledge of Q, that is difficult to evaluate in our case because of the leakage.
The graph shows that the experimental points close to Δφ = 0 V fall on the curve given by GCS theory, with a specific Stern layer capacitance of 0.16 F m−2. A discrepancy appears at higher potential, likely due to the finite size of ions.15,31 It can be noticed that the GCS theory intersects Δφ = 0 V at φ0 = 130 mV; this potential is measured with respect to the reference electrode and is a parameter of the fit.
The position of the points in the potential rise Δφ versus base potential φ0 graph (see Fig. 7) allows us to forecast the results of a CAPMIX cycle performed with a given material. In particular, the external voltage VExt gives the displacement along the base potential φ0 axis, and the displacement along the potential rise Δφ axis will provide the rise of the cell voltage, i.e. the voltage that is actually available to the load.
V. Comparison between various materials
As we have seen in the previous section, the activated carbon materials can have a potential rise Δφ also when the base potential φ0 is their spontaneous potential, i.e. without the need of charging them externally, with VExt = 0 V. In this section, we focus on the potential rise of various materials at their spontaneous base potential. Fig. 8 shows an example of the potential rise obtained by switching the salinity of the solution for two electrodes made of different materials. No external charging is performed. It can be noticed that the two materials present differences both in their spontaneous base potential φ0 and in their potential rise Δφ. The striking observation is that, for the A-PC-2 sample, the potential decreases when the salinity is reduced, i.e. the potential rise Δφ is negative.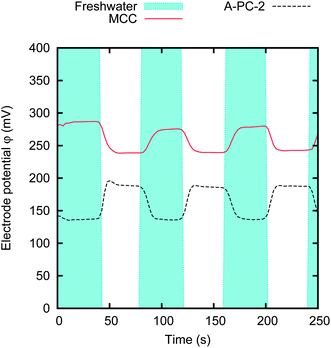 | ||
| Fig. 8 Potential variation upon salinity change, obtained without external charging (VExt = 0 V). The graph shows the results for two different materials, MCC and A-PC-2. The electrodes are 5 × 5 mm, spaced by a 1 mm thick gap. The data have been obtained by switching the concentration of the solution between cf = 20 mM and cs = 500 mM for every 40 s. | ||
We measured the potential rise Δφ at the spontaneous base potential φ0 for the various activated carbon materials. The results are reported in Fig. 9. It can be noticed that the spontaneous potentials range from 50 to 250 mV, and the potential rise ranges between −50 and 40 mV. In particular, MCC, THM, PAN and A-PC-4 have nearly the same spontaneous base potential φ0 ≃ 230 mV, but quite different potential rise Δφ. Moreover, CWZ, A-PC-2 and A-PC-4 materials have a large negative potential rise Δφ = −50 mV: this means that their potential increases when the salt concentration is increased.
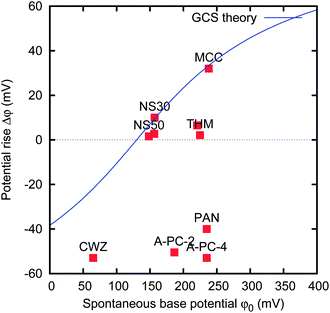 | ||
| Fig. 9 Graph of potential rise Δφ versus spontaneous base potential φ0 of various activated carbon materials. The data have been obtained without charging, i.e. the base potential is the spontaneous potential. The electrodes are 5 × 5 mm separated by a 1 mm thick gap. The solid line represents the result of GCS theory. | ||
The potential rise shown in Fig. 9 refers to the change of the concentration from cs = 500 mM to cf = 20 mM. In order to understand the specific electrochemical and electrokinetic behaviour of the electrodes, we also measured the potential at different salt concentrations ranging from 1 mM to 5 M.
Fig. 10 shows the results for two activated carbon materials with negative potential rise, i.e. Δφ < 0 V, namely A-PC-2 and PAN. This means that the potential increases with increasing salt concentration. The potential rise Δφ and the spontaneous base potential φ0 reported in Fig. 9 are respectively the potential at the concentration 500 mM and the difference between the potentials at 20 mM and 500 mM shown in Fig. 10. Both curves can be roughly fitted with GCS theory (see the solid lines of Fig. 10), with an additional constant displacement along the vertical axis and with different surface charge densities. In order to obtain a potential which increases with the increase of concentration, we must assume that the surface charge is negative. At the higher salt concentrations, the discrepancies that arise can be due to non-ideality of the solution. At the lower salt concentrations, the discrepancies can be attributed to specific ion adsorption.20 When the concentration is reduced, the amount of specifically adsorbed ions is consequently reduced, thus reducing the adsorbed surface charge. This avoids a further change of the potential. It should be pointed out that the surface charge is partially due to the specific ion adsorption, which is expected to be stronger at high concentrations. Analogously, redox reactions in battery electrodes are responsible for the voltage versus charge relation.20
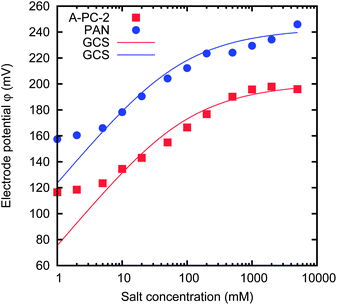 | ||
| Fig. 10 Dependence of the electrode potential on the salt concentration of the solution, for two materials, namely A-PC-2 and PAN. The solid lines are the results of GCS theory, with different surface charges. | ||
Fig. 11 shows the results for two activated carbon materials with positive potential rise Δφ > 0 V. In this case, it is much more difficult to see a similarity with GCS theory; anyhow, their behaviour can be still qualitatively described by taking into account specific ion adsorption.
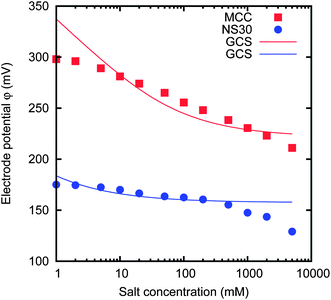 | ||
| Fig. 11 Dependence of the electrode potential on the concentration, for two materials, namely MCC and NS30-100 μm. The solid lines are the results of GCS theory, with different surface charges. | ||
VI. Energy extraction with spontaneous charge matching
The reported experimental findings do not solve all the possible questions about the physical parameters defining the base potential φ0 and the potential rise Δφ, and a complete discussion is outside the scope of the present work. Anyhow, it is possible to use these data in order to improve the CAPMIX energy extraction. The idea is to use different materials for the positive and negative electrodes, instead of using the same material for both electrodes. Fig. 12 shows three good choices of couples of electrodes, which will be described in the following.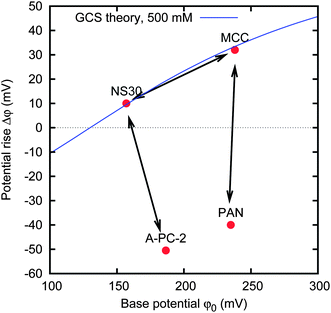 | ||
| Fig. 12 Three couples of materials that are good candidates for energy extraction. The displacement of the base potentials φ0 of the couple (horizontal component of the arrow) represents the external voltage VExt that must be applied. The displacement of the potential rise Δφ of the couple (vertical component of the arrow) represents the resulting cell voltage rise. | ||
The couple MCC–NS30 is chosen because the two activated carbon materials have quite different spontaneous potentials, their difference being around 100 mV. They roughly fall on the same GCS curve, and thus we could argue that their charge versus potential curve is roughly the same. We used the MCC as the positive electrode, and the NS30 as the negative electrode. The spontaneous voltage of the cell is thus around 100 mV. We fix the external voltage VExt to 100 mV, i.e. roughly equal to the spontaneous voltage of the cell. Since the leakage tends to take the potential of the electrode back to the spontaneous potential, in this case, we should not observe any leakage. A series of CAPMIX cycles performed with such a cell is shown in Fig. 13. Indeed, we observe that the curves in the voltage versus charge graph move to the right for the very first cycles, then they accumulate to a steady cycle. This shows that the leakage is negligible, leading to a power production of 1.5 mW m−2. It is worth noting that this result is striking because it has been obtained immediately after dipping the electrodes in the cell for a few minutes, while the results previously reported required hours of charging before obtaining the first cycles with energy extraction.13,19
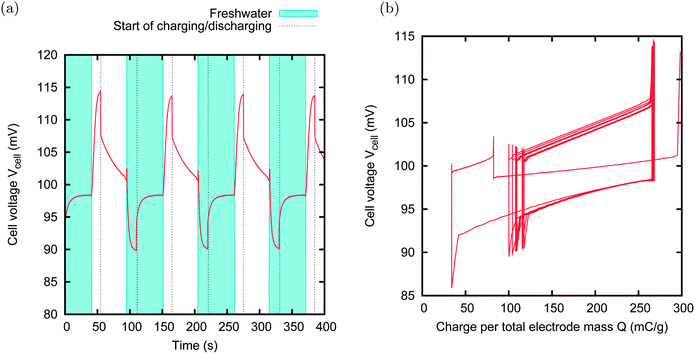 | ||
| Fig. 13 CAPMIX cycles with MCC and NS30, 100 μm thick film. Size of the electrode: 15 × 15 mm. External resistors: 5 Ω in saltwater, 40 Ω in freshwater. External voltage VExt = 100 mV. Produced power: 1.5 mW m−2. A steady state is nearly immediately reached, after only one cycle. The charge does not present any drift toward right, which means that no charge leakage takes place. | ||
In the other two couples, namely MCC–PAN and A-PC-2–NS30, the two activated carbon materials have a similar spontaneous potential, but extremely different potential rises. In these cases, the external voltage VExt is set to 0 V, i.e. no power supply is needed, and the charging and discharging phases are obtained simply by discharging the cell through the load. Anyhow, the cell will experience a voltage rise, due to the different potential rises of the two individual electrodes. We will call this technique “zero charging” CAPMIX. The advantage of this technique is evident: no leakage can affect the energy production, no external power supply is needed, and both charging and discharging phases are active. Examples of energy production with zero charging are provided in Fig. 14 and 15. In the first case, the power production is limited by the high internal resistance of the PAN sample. The second case provides a remarkable power production of 50 mW m−2.
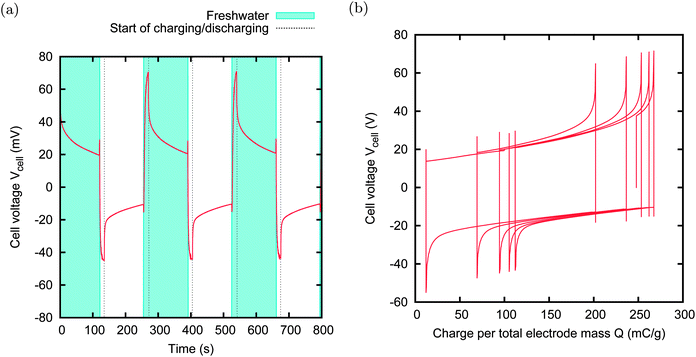 | ||
| Fig. 14 CAPMIX cycles with MCC and PAN. Size: 6 × 7 mm. External resistors: 1500 Ω in saltwater, 3000 Ω in freshwater. Power production: 1 mW m−2. In this case, the external power supply is not used because the external voltage is zero. | ||
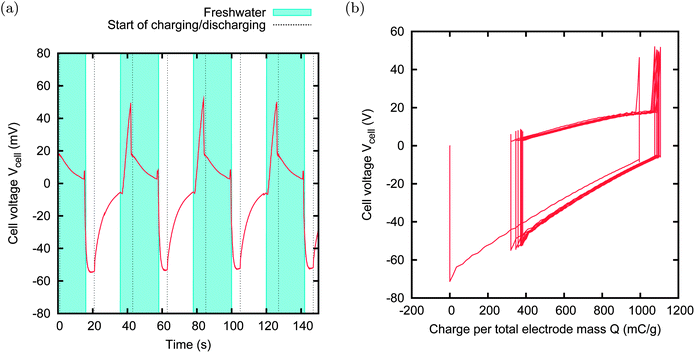 | ||
| Fig. 15 CAPMIX cycles with A-PC-2 and NS30. Size: 15 × 15 mm. External resistors: 10 Ω in saltwater, 20 Ω in freshwater. Power production: 50 mW m−2. The external power supply is not used because the external voltage is zero. This case shows the best power production obtained with the CDLE technique. | ||
It is worth noting that, for example, no net energy production is obtained when A-PC-2 is used for both electrodes in an externally charged CAPMIX cycle.
VII. Conclusions
We have shown that activated carbon electrodes produced with different methods do not behave as chemically inert materials. First of all, the analyzed activated carbons have a different spontaneous potential and a leakage current that tries to restore it, whenever the charge is modified by the flow of an external current. Both effects have a chemical origin, given respectively by the presence of charged groups on the surface, or the selective adsorption of ions and Faradaic reactions.Moreover, the dependence of the potential on salt concentration at a fixed charge shows a behaviour that cannot be always explained in terms of the GCS theory of the electric double layers. Instead, it shows that, in some cases, specific ion adsorption or redox reactions take place and contributes to the storage of charge and ions.
Both phenomena have no effect on CAPMIX energy extraction if electrodes of the same material are used and, actually, the described phenomena have been widely overlooked. Instead, the analysis of the single electrodes allows us to find suitable couples of activated carbon materials which give improved energy extraction. In particular, the first phenomenon allows us to avoid the leakage and the second allows us to make CAPMIX cycles without the need for an external power supply.
The resulting specific surface power reaches the encouraging value of 50 mW m−2, still suitable of strong improvements.
Acknowledgements
The research leading to these results received funding from the European Union Seventh Framework Programme (FP7/2007-2013) under agreement no. 256868. RAR acknowledges support from Regione Lombardia (Accordo per lo sviluppo del capitale umano nel sistema universitario lombardo). FM and DS acknowledge support of Cariplo Foundation Materiali Avanzati – 2011, Project 2011-0336. We thank M. Bryjak, O. Schaetzle, F. Liu, A. Delgado, J. Veerman, S. Tennison and all the CAPMIX partners for providing the activated carbon samples, for casting the activated carbon films and for fruitful discussions.References
- R. Semiat, Environ. Sci. Technol., 2008, 42, 8193 CrossRef CAS.
- J. W. Post, H. V. M. Hamelers and C. J. N. Buisman, Environ. Sci. Technol., 2008, 42, 5785 CrossRef CAS.
- B. B. Sales, M. Saakes, J. Post, C. J. N. Buisman, P. M. Biesheuvel and H. V. M. Hamelers, Environ. Sci. Technol., 2010, 44, 5661 CrossRef CAS.
- R. E. Pattle, Nature, 1954, 174, 660 CrossRef CAS.
- R. W. Norman, Science, 1974, 186, 350 CAS.
- B. E. Logan and M. Elimelech, Nature, 2012, 488, 313 CrossRef CAS.
- O. Levenspiel and N. de Vevers, Science, 1974, 183, 157 CAS.
- S. Loeb, Science, 1975, 189, 654 CAS.
- T. S. Chung, X. Li, R. C. Ong, Q. G. H. Wang and G. Han, Curr. Opin. Chem. Eng., 2012, 1, 246 CrossRef CAS.
- M. Olsson, G. L. Wick and J. D. Isaacs, Science, 1979, 206, 452 CAS.
- J. N. Weinstein and F. B. Leitz, Science, 1976, 191, 557 CAS.
- K. Gerstandt, K. V. Peinemann, S. E. Skilhagen, T. Thorsen and T. Holt, Desalination, 2008, 224, 64 CrossRef CAS.
- D. Brogioli, Phys. Rev. Lett., 2009, 103, 058501 CrossRef.
- M. F. M. Bijmans, O. S. Burheim, M. Bryjak, A. Delgado, P. Hack, F. Mantegazza, S. Tennisson and H. V. M. Hamelers, Energy Proc., 2012, 20, 108 CrossRef CAS.
- N. Boon and R. van Roij, Mol. Phys., 2011, 109, 1229 CrossRef CAS.
- P. Simon and Y. Gogotsi, Nat. Mater., 2008, 7, 845 CrossRef CAS.
- M. Levi, G. Salitra, N. Levy, D. Aurbach and J. Maier, Nat. Mater., 2009, 8, 872 CrossRef CAS.
- P. M. Biesheuvel and M. Z. Bazant, Phys. Rev. E: Stat., Nonlinear, Soft Matter Phys., 2010, 81, 031502 CrossRef CAS.
- D. Brogioli, R. Zhao and P. M. Biesheuvel, Energy Environ. Sci., 2011, 4, 772 CAS.
- J. Lyklema, Fundamentals of Interface and Colloid Science, Academic, New York, 1995, vol. 2 Search PubMed.
- R. A. Rica, D. Brogioli, R. Ziano, D. Salerno and F. Mantegazza, J. Phys. Chem. C, 2012, 116, 16934 CAS.
- R. A. Rica, D. Brogioli, R. Ziano, D. Salerno and F. Mantegazza, Phys. Rev. Lett., 2012, 109, 156103 CrossRef.
- F. Liu, O. Schaetzle, B. B. Sales, M. Saakes, C. J. N. Buisman and H. V. M. Hamelers, Energy Environ. Sci., 2012, 5, 8642–8650 CAS.
- F. La Mantia, M. Pasta, H. D. Deshazer, B. E. Logan and Y. Cui, Nano Lett., 2011, 11, 1810 CrossRef CAS.
- B. E. Conway, J. Electrochem. Soc., 1991, 138, 1539 CrossRef CAS.
- Y. Oren, Desalination, 2008, 228, 10 CrossRef CAS.
- M. Pasta, C. D. Wessells, Y. Cui and La Mantia, Nano Lett., 2012, 12, 839 CrossRef CAS.
- P. M. Biesheuvel, J. Colloid Interface Sci., 2009, 332, 258 CrossRef CAS.
- M. M. Goldin, V. A. Kolesnikov, M. S. Khubutiya, A. G. Volkov, G. J. Blanchard, A. K. Evseev and M. M. Goldin, J. Appl. Electrochem., 2008, 38, 1369 CrossRef CAS.
- E. Avraham, M. Noked, I. Cohen, A. Soffer and D. Aurbach, J. Electrochem. Soc., 2011, 158, P168 CrossRef CAS.
- M. Z. Bazant, M. S. Kilic, B. D. Storey and A. Ajdari, Adv. Colloid Interface Sci., 2009, 152, 48 CrossRef CAS.
Footnote |
| † Electronic supplementary information (ESI) available. See DOI: 10.1039/c2ee23036d |
| This journal is © The Royal Society of Chemistry 2012 |
