 Open Access Article
Anion-exchange membranes for alkaline polymer electrolyte fuel cells: comparison of pendent benzyltrimethylammonium- and benzylmethylimidazolium-head-groups†
Oliver I.
Deavin
a,
Sam
Murphy
a,
Ai Lien
Ong
a,
Simon D.
Poynton
a,
Rong
Zeng
b,
Henryk
Herman
ac and
John R.
Varcoe
*a
aDepartment of Chemistry, Faculty of Engineering and Physical Sciences, University of Surrey, Guildford, GU2 7XH UK. E-mail: j.varcoe@surrey.ac.uk; Tel: +44 (0)1483 686838
bGeneral Research Institute of Nonferrous Metals, Beijing, 100088, P. R. China
cGnoSys Global Ltd., 17-18 Fredrick Sanger Road, The Surrey Research Park, Guildford, GU2 7YD UK
First published on 6th July 2012
Abstract
Radiation-grafted alkaline anion-exchange membranes (AAEM) containing pendent groups with either benzyltrimethylammonium (BTM) or benzylmethylimidazolium (BMI) functionality were successfully synthesised from the same base membrane and with identical ion-exchange capacities. The conductivity of the new BMI-AAEM is comparable to the BTM-benchmark AAEM. The fuel cell performance obtained with the BMI-AAEM was, however, significantly poorer due to in situ AAEM degradation. FT-Raman spectroscopic studies on the stability of the two head-groups at 60 °C in aqueous potassium hydroxide (1 mol dm−3) indicates that the BMI-group is intrinsically less chemically stable in strongly alkaline conditions compared to the BTM-benchmark head-group. However, the stabilities of both head-groups are improved when treated at 60 °C in lower pH aqueous carbonate and bicarbonate solutions (1 mol dm−3). Contrary to a portion of the prior literature, there appears to be no real advantage in using anion-exchange polymer electrolytes containing pendent imidazolium groups in highly alkaline systems.
Broader contextA growing number of electrochemical energy and water treatment devices involve the use of anion-exchange polymer electrolyte components. Examples include alkaline polymer electrolyte fuel cells (for energy generation), redox flow batteries (for energy storage), microbial fuel cells (for wastewater treatment), electrochemical devices for carbon capture and utilisation or CO2 capture/recovery, and devices for desalination or water purification. A number of these applications/devices require the polymer electrolytes to operate in high pH environments where the commonly encountered quaternary ammonium functional groups (on the polymer electrolytes) are not stable over long time periods (especially at elevated temperatures). This is the reason for the intensification of research (worldwide) into alkali and thermochemical stable anion-exchange polymer materials. |
Introduction and background
Alkaline polymer electrolyte fuel cells (APEFC)
The alkaline polymer electrolyte fuel cell (APEFC, also referred to in the literature as solid alkaline fuel cell, SAFC, or alkaline membrane fuel cell, AMFC) is a recent class of fuel cell where international research efforts have intensified in the last 10 years (and with significant breakthroughs since 2006);1 this class of fuel cell is similar to the more well known alkaline fuel cells (AFC) but operates at temperatures <100 °C and with high pH solid polymer electrolytes (alkaline anion-exchange membranes, AAEM) replacing the aqueous KOH electrolyte in traditional AFCs. The principal reasons for this research intensification are:(1) The prospect of the use of non-precious-metal (especially non-Pt) metal catalysts2 and non-carbon supports.3
(2) Recent studies have challenged the prior wisdom that the conductivities of AAEMs are too low for application;4
(3) That the use of solid alkaline polymer electrolytes, instead of aqueous metal hydroxide solutions, leads to an increased tolerance to CO2 in the cathode gas supply5,6 especially at T > 80 °C; the development of low temperature carbonate fuel cells containing solid polymer electrolytes have even been proposed7 with groups [in the USA and UK] successfully attracting funding to study these systems.
In relation to point 3 above, reaction of CO2 with metal hydroxide risks the formation of metal carbonate and bicarbonate species and precipitates in traditional KOH-electrolyte AFCs, but precipitates cannot form in APEFCs as the positive charges are already covalently bound to the solid (polymer electrolyte) matrix. AAEMs also tend to have higher chemical stabilities in the CO32−/HCO3−-anion-forms compared to the OH−-forms.8
The high conductivities being reported for AAEMs4 indicate that high performance APEFCs, with performances comparable to the more widely known proton-exchange membranes fuel cells (PEMFC), are technically feasible. Anion-exchange membranes are even making an impact in the field of biological fuel cells,9 redox flow batteries,10 and solid alkaline electrolysers.11 However to date, the performances of H2-APEFCs have not achieved this parity with the more highly developed PEMFCs.
It has been shown that low APEFC performance can be due to high overpotentials at the anode (converse to the situation found with PEMFCs).12 The question is: are these anode overpotentials mass transport, ohmic or kinetic related? Other studies13,14 have focussed on the critical need for alkaline ionomer (anionomer) formulations (including dispersions and solutions) that enhance the ionic conductivity at the AAEM/electrode interface and provide optimal water management (recall that water is a direct reactant at the cathode and is generated at the anode). Evidence is also building that the most common benzyltrimethylammonium quaternary ammonium (QA) head-groups used in such systems can interfere with the electrokinetics of the anode catalysts (especially in systems where CO32− accumulates at the anode),15,16 while other studies17 suggest the hydrogen oxidation reaction (HOR) is enhanced in carbonate media vs. hydroxide media (ex situ electrochemical tests with the absence of quaternary ammonium species). It should not be forgotten that the HOR on Pt in alkali can be poorer than in acid media;18 this offsets the (perceived) superiority of the oxygen reduction reaction (ORR) kinetics in alkali.
The priority is the search for chemical stable head-groups
As stated above, the ionic conductivities of the AAEMs are not a significant limiter of APEFC performances when hydrated.4 However, ionic conductivity is more sensitive to AAEM hydration levels compared to proton-exchange membranes, PEMs, with large drops in conductivity with reduced hydration levels.19 A known issue with current solid polymer alkaline electrolytes is chemical stability over the medium to long timeframe. The evidence in the current literature strongly indicates that the chemical stabilities of the positively charged head-groups are inadequate for long term application in APEFCs. It is our firm belief (and of others – see below) that the research priority should be to identify anion-exchange head-groups with acceptable thermochemical stabilities (and where the head-group chemistry has a minimal impact on the HOR and ORR electrokinetics of the catalysts selected for use),15,20 whilst maintaining excellent conductivities at lower water uptakes (minimal AAEM swelling). Once a suitable head-group chemistry has been identified, an appropriate polymer backbone can then be selected (as head-group degradation is currently more significant [occurs over shorter timescales] than radical-induced polymer degradation caused by the traces of peroxide species that are generated during fuel cell operation).The recent combined experimental and modelling studies by the National Renewable Energy Laboratory and the Los Alamos National Laboratory in the USA have been focusing on this theme.21 A summary of the main findings from these studies are:
(1) For QA groups in the absence of β-hydrogen atoms (e.g. aromatic-trimethylammoniums), ylide intermediates can reversibly form by OH− attack on the α-H atoms (in parallel to the usual SN2 displacement reactions). These ylide intermediates rarely result in degradation events;
(2) Aromatic rearrangements can occur as minor side reactions via ylide intermediates with benzyltrimethylammoniums;
(3) Reconfirmation that Hofmann elimination reactions are facile and severe with QA groups and when β-hydrogen atoms are present (i.e. R-triethylammonium head-groups). However, n-alkyltrimethylammoniums are predicted to be slightly more stable compared to benzyltrimethylammoniums when n > 3;
(4) QA head-groups are reasonably stable in fully hydrated polymer electrolytes as fully hydrated OH− anions appear less nucleophilic than less hydrated OH− anions. Degradation of such head-groups is severe when polymer electrolyte hydration levels are lower.
The search is therefore on for an alkali stable class of anion-exchange head-group. The various options being proposed include those containing the following functional groups: QA head-groups synthesised using the rigid diamine 1,4-diazabicyclo[2.2.2]octane (DABCO),22 quaternary phosphonium containing tris(trimethoxyphenyl) functionality,23 as well as methylated melamine,24 guanidinium,25 and organometallic26 types. A promising option appears to be the hexyloxy-spacer-type QA head-group but there has not been significant follow-up since the original 1997 paper by Tomoi et al. on alkali stable resins.27
Recently, there has been a burst of publications on the subject of imidazolium-type (ionic liquid inspired) AAEMs, containing aliphatic hydrocarbon or polysulfone backbones, for application in APEFCs.28 One of these details a degradation study on aliphatic (non-benzyl) side chain butylimidazolium polymer electrolytes (although they would not be suitable for long-term use in alkaline fuel cells due to the presence of ester functionality in the polymer side-chains linkages).28c Using NMR, this study concluded that this head-group functionality (in OH−-form) is stable in humid conditions up to 80 °C and in mild alkaline conditions (<1 mol dm−3 aqueous KOH) at room temperatures but is unstable in dry conditions at 80 °C and in stronger alkaline conditions (>1 mol dm−3 aqueous KOH) at room temperatures. The suggested degradation pathway was via imidazolium ring-opening. Other studies conflict with the above and suggest the stabilities of imidazolium groups in alkali at 60 °C are very high.28b So is imidazolium head-group chemistry an option for application in APEFCs?
The aims of this paper are to: (1) compare the fuel cell relevant properties of AAEMs containing benzyltrimethylammonium (BTM) and benzylmethylimidazolium (BMI) pendent groups based on the same class of polymer backbone and with identical ion-exchange capacities (Scheme 1); and (2) report on a new spectroscopic screening method for evaluating the relative chemical stabilities of different anion-exchange head-groups in a variety of (including potentially accelerated) conditions. The first aim can be achieved using the established radiation-grafting synthetic methodology, which allows for the rapid lab-scale production of m2-sized batches of different AAEMs to be synthesised from the same batch of precursor membranes.29 This methodology also allows for the use of pre-formed films to alleviate the need for additional film formation steps (time consuming to develop for each type of polymer being produced).
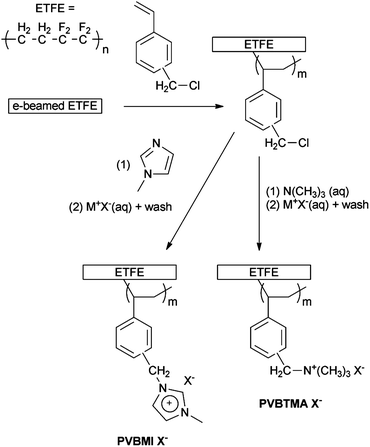 | ||
| Scheme 1 Overview of the synthesis of the ETFE-based radiation-grafted benzylmethylimidazolium- and benzyltrimethylammonium anion-exchange membranes (PVBMI-X−−−−− and PVBTMA-X−−−− respectively – X−−−− represents the anions relevant to this study: Cl−, HCO3−, CO32− and OH−). | ||
Key methodology
More detailed experimental procedures can be found in the associated ESI† (where relevant and appropriate).Anion-exchange membrane synthesis
Scheme 1 presents a schematic of the synthesis methodology used in this study. The synthesis of the radiation-grafted BTM-type benchmark AAEM has been widely reported29 and is summarised here: ETFE film (50 μm thick) was irradiated with an electron-beam to 70 kGy total dose. An intermediate ETFE-g-poly(vinylbenzyl chloride) membrane (ETFE-gggg-PVBC) was obtained after the e-beamed ETFE was submerged in a N2-purged solution, consisting of 20 vol% vinylbenzyl chloride (VBC) monomer (Dow Chemicals), 1 vol% Surfadone and 79 vol% propan-2-ol, and heated at 60 °C for 72 h. ETFE-g-poly(vinylbenzyltrimethylammonium chloride) anion-exchange membrane (PVBTMA-Cl−−−) was obtained after the ETFE-gggg-PVBC was treated in aqueous trimethylamine solution. Subsequent ion-exchange with aqueous KOH (1 mol dm−3) solution yielded the target benchmark poly(vinylbenzyltrimethyl-ammonium hydroxide) AAEM (PVBTMA-OH−−−).The BMI-analogue AAEM was synthesised as above with the following modifications: the second stage was conducted by immersion of the intermediate ETFE-gggg-PVBC in undiluted 1-methylimidazole (Sigma-Aldrich, 99%) for at least 48 h at 80 °C; ion-exchange of the resultant transparent brown ETFE-g-poly(vinylbenzylmethylimidazolium chloride) anion-exchange membrane (PVBMI-Cl−−−) to the hydroxide form (PVBMI-OH−−) was achieved using aqueous KOH (1 mol dm−3) at room temperature for 1 h.
Membrane characterisation
 | (1) |
 | (2) |
Measurement of fuel cell performance curves
Raman-based chemical stability testing of model compounds
This section describes the initial development of a simple methodology for measuring the relative chemical stabilities of different head-group chemistries in a variety of aqueous alkaline solutions. A significantly expanded study will be reported in a future publication that will present a large chemometric study of an expanded range of model molecules and polymers with a larger variety of head-groups; this expanded study will also involve in-depth analysis of degradation products. However a selection of these initial small molecule studies is communicated here due to the relevance to the membranes being compared and to complement the recent findings from the NMR investigation28c of non-benzyl imidazolium groups.To gauge the relative stabilities of the BMI- and BTM-type pendent head-groups, the following model compounds were studied (Scheme 2): (1) benzyltrimethylammonium chloride (BTMA); and (2) 1-benzyl-3-methylimidazolium chloride (1B3MI – a commercially available ionic liquid precursor). It should be appreciated that significant further method development is required to conduct analogous stability measurements on actual thin membranes (with acceptable signal to noise ratios for rigorous and quantitative chemometrics and meaningful conclusions). However, the measurement of the relative intrinsic stabilities of the different head-groups in the small molecule form will give useful guidance to the stabilities in the membrane/polymer form. The detailed rationale and assumptions made are detailed in the ESI.† The thinking is that if the head-group of interest is less/more stable than the benchmark QA BTM-head-group [when fully hydrated] in small molecule form, then it will be less/more stable than the benchmark when in the less mobile polymer form [when fully hydrated]. This compliments the studies by Pivovar et al. that investigate the stabilities of cationic head-groups [when less hydrated].21
 | ||
| Scheme 2 Benzyltrimethylammonium chloride (left, BTMA) and 1-benzyl-3-methylimidazolium chloride (right, 1B3MI). | ||
The model small molecule compounds 1B3MI and BTMA were separately dissolved in thoroughly N2-purged aqueous potassium hydroxide solutions (1 cm3, 1 mol dm−3, 1![[thin space (1/6-em)]](https://www.rsc.org/images/entities/char_2009.gif) :
:![[thin space (1/6-em)]](https://www.rsc.org/images/entities/char_2009.gif) 1 molar ratio of compound to OH− anions) in sealable glass vials (3 repeat vials were prepared for each model compound – hence triplicate spectra were recorded for each length of aging time). These vials were immediately sealed and a FT-Raman spectrum of each solution was recorded (32 scans, laser power of 1435 ± 5 mW at λ = 1064 nm, resolution of 4 cm−1 – variations to these conditions are noted in the relevant figure captions) using the same Raman spectrometer as used for membrane characterisation. These were the day = 0 measurements. The sealed vials were then stored in a convection oven at 60 °C and spectra were recorded at various time intervals (after being cooled to room temperature). The experiments can easily be repeated with different aqueous solutions, e.g. potassium carbonate (1 mol dm−3), when required. Control experiments were conducted in parallel under the same conditions and consisted of sealed vials containing aqueous solutions of the model compounds in alkali-free grade I deionised water only (of comparable concentrations).
1 molar ratio of compound to OH− anions) in sealable glass vials (3 repeat vials were prepared for each model compound – hence triplicate spectra were recorded for each length of aging time). These vials were immediately sealed and a FT-Raman spectrum of each solution was recorded (32 scans, laser power of 1435 ± 5 mW at λ = 1064 nm, resolution of 4 cm−1 – variations to these conditions are noted in the relevant figure captions) using the same Raman spectrometer as used for membrane characterisation. These were the day = 0 measurements. The sealed vials were then stored in a convection oven at 60 °C and spectra were recorded at various time intervals (after being cooled to room temperature). The experiments can easily be repeated with different aqueous solutions, e.g. potassium carbonate (1 mol dm−3), when required. Control experiments were conducted in parallel under the same conditions and consisted of sealed vials containing aqueous solutions of the model compounds in alkali-free grade I deionised water only (of comparable concentrations).
There are a number of methods used in MVSA. An example is Principal Components Regression (PCR), a method suitable for analysing problems where the spectral (or other) data are complex and the property data are not well-defined. The spectral intensities for each sample and spectral variable comprise the raw data. The first step, Principal Components Analysis (PCA), acts on these data and reduces the spectral variables (in our case wavelength) to a small number of linearly independent Principal Components (PCs) that describe the majority of the variance across the samples. These PCs are chosen according to a strict linear algorithm: the first PC accounts for the greatest amount of variance, the second for the largest amount of residual variance, and so on. In principal, there will be as many PCs as there are spectral variables. As the greatest variance is “extracted” at each PC step, in practice only a few PCs are required to describe most of the variance in the dataset – the dataset has been reduced or compressed without significant loss of information. Essentially each spectrum is reduced to a single point in this multidimensional PC space, where it is given a “score” or position. Similar samples will “sit” next to each other in this space and form a “cluster”. A trend will be seen as a trail or extended spheroid in PC space. These are not esoteric manipulations, but help us “see” relationships and trends in a graphical way.
Following this, least squares regression is used to relate the properties to the scores that are the simplified versions of the original spectral intensities. This generates the PC regression (or PCR) model, which then needs to be validated. In this case, the link between the properties and the original spectral data is the regression coefficient. In normal statistics this is a simple number, but in MVSA this has a value at each wavelength and so represents a spectral measure of the regression relationship between the property of interest and the actual measured spectra.
This regression coefficient looks like a member of the original dataset, apart from the fact that it can have positive (correlates to the property) and negative (anti-correlates to the property) values. It can also appear somewhat strange in that bands in the original dataset may not appear in the regression coefficient – which means that particular bands either stay unchanged (no variance) or do not correlate with the property being examined.
Another method used in MVSA is Partial Least Squares (PLS), which is more suitable if the property data are well defined and definite correlations are expected between the spectral and property datasets.
Both of these are linear algorithms, so they are well determined, stable, easily validated and provide a physically interpretable insight into the physical and chemical processes linking the spectra and the properties – the methods use all the data, minimising the effects of operator bias.
The validation process typically uses a subset of “test” sample data that was left out of the modelling process, and applies the model to them to estimate the property values. Providing the model is successfully validated, it can be used to predict property values for new data.30
The software used in this study was The Unscrambler v9.2 (Camo Process AS).
Results and discussion
Spectroscopic characterisation of Cl−-form membranes
The assignments of the bands in the 13C, 19F and 15N solid state NMR spectra and Raman spectra of ETFE, the intermediate ETFE-g-poly(vinylbenzyl chloride) (ETFE-gggg-PVBC) and the ETFE-g-poly(vinylbenzyltrimethylammonium chloride) (PVBTMA-Cl−−−) AAEM have been described in detail in a previous paper.29 These details will not be repeated here: the spectral data for PVBTMA-Cl−−− synthesised was as expected.FT-Raman spectroscopy was selected in preference to FT-IR spectroscopy so that the AAEMs could be analysed “as synthesised” with no drying step. The Raman spectra of ETFE-gggg-PVBC and the ETFE-g-poly(vinylbenzylmethylimidazolium chloride) (PVBMI-Cl−−−) AAEMs are presented in Fig. 1. When also analysing the Raman spectra of 1-benzyl-3-methylimidazolium chloride (1B3MI), it is clear that the ETFE-gggg-PVBC intermediate membrane has successfully reacted with the 1-methylimidazole to yield the desired PVBMI-Cl−−− AAEM. The signature band at 1268 cm−1 in the spectrum of ETFE-gggg-PVBC (the CH2Cl deformation band) is not present in the spectrum of PVBMI-Cl−−−. Several key new bands appear in the spectrum of PVBMI-Cl−−− that are also present in the spectrum of the model small molecule 1B3MI. This includes the bands at 1416 and 1022 cm−1 that are characteristic of imidazolium groups (ring ip asymmetric and symmetric stretches respectively).31 There was no evidence of any residual 1-methylimidazole in the spectrum of PVBMI-Cl−−− (i.e. the absence of the strong Raman band at 1352 cm−1 that is present in the spectrum of 1-methylimidazole [but not 1B3MI]).
![The FT-Raman spectra of (a) 1-benzyl-3-methylimidazolium chloride [1B3MI], (b) ETFE-g-poly(vinylbenzyl chloride) [ETFE-gggg-PVBC] and (c) ETFE-g-poly(vinylbenzylmethylimidazolium chloride) [PVBMI-Cl−−−]. * = 1268 cm−1 CH2Cl deformation band of the benzylchloride functionality. x = bands present in the Raman spectrum of 1B3MI that are observed in the spectrum of PVBMI-Cl−−−. The spectra were normalised to the height of the benzyl ring breathing band at 1005 cm−1 for presentational purposes.](/image/article/2012/EE/c2ee22466f/c2ee22466f-f1.gif) | ||
| Fig. 1 The FT-Raman spectra of (a) 1-benzyl-3-methylimidazolium chloride [1B3MI], (b) ETFE-g-poly(vinylbenzyl chloride) [ETFE-gggg-PVBC] and (c) ETFE-g-poly(vinylbenzylmethylimidazolium chloride) [PVBMI-Cl−−−]. * = 1268 cm−1 CH2Cl deformation band of the benzylchloride functionality. x = bands present in the Raman spectrum of 1B3MI that are observed in the spectrum of PVBMI-Cl−−−. The spectra were normalised to the height of the benzyl ring breathing band at 1005 cm−1 for presentational purposes. | ||
Regarding the conversion of the intermediate ETFE-gggg-PVBC membrane into the PVBMI-Cl−−− AAEM, the 19F spectra in both are similar to those observed for the base ETFE membrane (including a quantity of –CF3 groups as a propriety component of this ETFE grade); this indicates that there are minimal changes in the ETFE component on grafting and amination (unlike found when chemically similar poly(vinylidene fluoride) [–(CH2CF2)n–, PVDF] is used as the base polymer).32 The changes in the 13C spectra on conversion of the ETFE-gggg-PVBC into PVBMI-Cl−−− (Fig. 2) include additional signals in the aromatic region as anticipated with the addition of an imidazolium ring. The change of the δC = 47 signal (CH2Cl) into a δC = 53 signal (CH2N) is also consistent with amination of the benzyl chloride groups. The δC = 37 signal in the spectrum of PVBMI-Cl−−− corresponds to the CH3 group on the imidazolium ring. The 15N spectrum of PVBMI-Cl−−− yields two signals at δN = −193 and −209, which are consistent with the presence of an imidazolium ring; this contrasts with the signal at δN = −328 for BTM-based radiation-grafted AAEMs.29
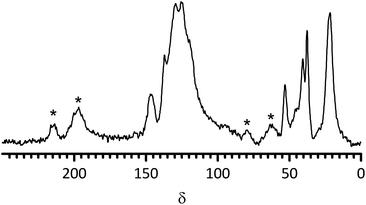 | ||
| Fig. 2 The 13C Solid State NMR spectrum of PVBMI-Cl−−− anion-exchange membrane. The signals marked * are spinning sidebands. | ||
Ion-exchange capacities
The ion-exchange capacities of the Cl−-forms of both anion-exchange membranes are shown in Fig. 3; the advantage of conducting the IEC titrations using Cl− precipitation titrations is that the anion-exchange membranes are not exposed to alkali (or acid) and therefore high (or low) pH-derived degradations are minimised. The IECs are 1.77 ± 0.03 meq. g−1 (SD, n = 8) and 1.78 ± 0.01 meq. g−1 (SD, n = 4) for the BMI- and BTM-type membranes respectively. It is evident that the IECs of the two types of radiation-grafted membranes are equivalent (as targeted by the choice of synthetic methodology). This key feature facilitates the comparison of the physical properties of the AAEMs. As the samples were taken from different areas of the membranes, the small standard deviations indicate a desirable level of grafting homogeneity [in-plane].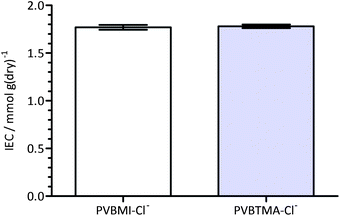 | ||
| Fig. 3 The ion-exchange capacities (IEC) of the chloride-form benzylmethylimidazolium (PVBMI-Cl−−−) and benzyltrimethylammonium (PVBTMA-Cl−−−) radiation-grafted anion-exchange membranes. Error bars are confidence intervals at the 95% confidence level. | ||
Gravimetric water uptakes (WU) and thickness increases (TI)
Despite the comparable IECs, the water uptake properties of the AAEMs differed, with the BMI-AAEM showing a more controlled water uptake (Fig. 4). AAEMs with reduced water uptakes and retained conductivities are highly desired for application in APEFCs.1,33 Within the precision of the thickness measurements, there was no significant difference between the TIs of the BTM- and BMI-type AAEMs. The thicknesses of the fully hydrated AAEMs are 90 ± 2 μm and 93 ± 2 μm for the BMI- and BTM-type AAEMs respectively. Water uptake and thickness increase measurements are susceptible to interferences such as incomplete removal of surface water, the rapid evaporation of water (between being removed from the water and being weighed), and surface “bubble” formation (a problem with some radiation-grafted ion-exchange membranes that is derived from radiation damage of the base membranes);34 this often leads to poorer precision and, as such, comparisons of WUs and TIs between membranes should be conducted with caution.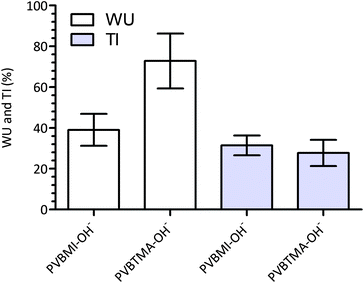 | ||
| Fig. 4 The gravimetric water uptakes (WU) and through plane thickness increases (TI) for the PVBMI-OH−− and PVTMA-OH− AAEMs. Error bars are confidence intervals at the 95% confidence level. | ||
Ionic conductivity data
The ionic conductivities of the AAEMs were measured in the bicarbonate (HCO3−) anion form (Fig. 5) as this form is not sensitive to exposure to atmospheric CO2; it is very difficult to exclude all CO2 from our standard rapid 2-probe test cells, which makes the measurement of hydroxide ion conductivities difficult and less repeatable (due to the rapid conversion of the membranes to the CO32−/HCO3− anion-forms35 [over the time period of the experiments at different temperatures]). Hickner and Yan have recommended that the best way to estimate the hydroxide conductivities is to measure the HCO3− conductivities and use a multiplication factor of 3.8 (derived from the differences in ion mobilities).36 These calculated hydroxide conductivities are also shown in Fig. 5. Other work in our laboratory on different radiation-grafted BTM-AAEMs has validated this approach (see ESI† for an example).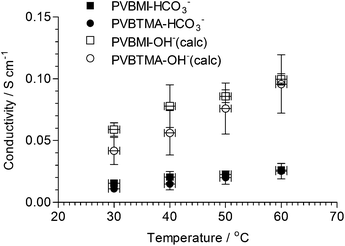 | ||
| Fig. 5 The through plane ionic (measured using 2-probe electrochemical impedance spectroscopy)19 conductivities of both AAEMs in the HCO3− forms (measured) and OH− forms (calculated36 from the HCO3− values using a 3.8× multiplication factor). The y-axis error bars are sample standard deviations (n = 3). The x-axis error bars are ± 1 °C. | ||
There is no significant difference between the HCO3− conductivities of the AAEMs with the different head-group chemistry (within experimental precision). Both AAEMs gave conductivities in the range expected for radiation-grafted AAEMs. The conductivities at different temperatures for the PVBMI-OH−− AAEM suggest that the radiation-grafted BMI-AAEM should yield a fuel cell test performance of the same order of magnitude compared to the benchmark PVBTMA-OH−−− AAEM (assuming ohmic losses are predominant).
Beginning-of-life fuel cell test data (H2/O2)
The fuel cell test data for the different AAEMs are presented in Fig. 6. Firstly, the PVBTMA-OH−−− and PVBMI-OH−− AAEMs were compared in H2/O2 fuel cells using the same alkaline ionomer (ionomer 1: cross-linked TMHDA-QA-based).13 It is immediately obvious that the PVBMI-OH−− performance was several orders of magnitude poorer than the benchmark BTM-AAEM. The in situ area resistances were also significantly higher and the performance data was noisy and scattered. The poor quality data may arise from the different chemistries between the AAEM and the alkaline ionomer. Therefore the fuel cell test was repeated with the use of an ad hoc alkaline ionomer (based on the TMHDA-ionomer concept, but where 1-methylimidazole was used as the amination agent instead of the crosslinking tertiary diamine quaternisation agent). With the use of this chemically compatible ionomer, the fuel cell performance data showed a slight improvement (double the maximum current density) with smoother data being observed (and a decrease in the in situ area resistance). However, the performance obtained was still significantly lower than that of the benchmark QA-AAEM.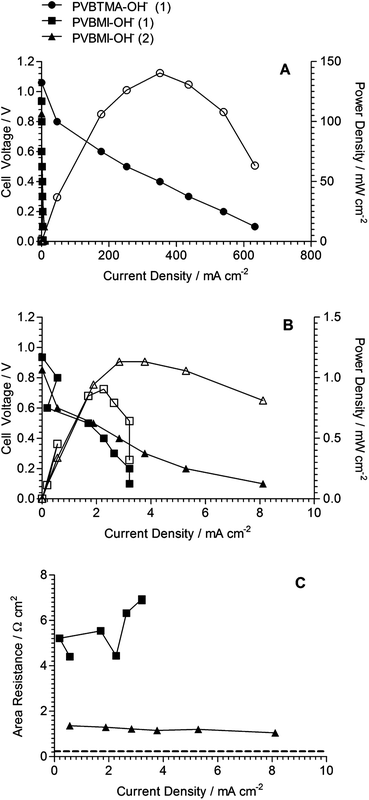 | ||
| Fig. 6 H2/O2 beginning-of-life fuel cell test data (50 °C, no gas back-pressurisation) of the PVBTMA-OH−−− and PVBMI-OH−− AAEMs. (A) Polarisation (filled symbols) and power density (open symbols) plots for all membranes and ionomers. (B) Polarisation and power density plots for the PVBMI-OH−− AAEM using different ionomers. (C) In situ area resistance data for the PVBMI-OH−− AAEM and the different ionomers (the horizontal dashed line shows the average in situ area resistance for the PVBTMA-OH−−− AAEM). Ionomer (1) is the poly(vinylbenzyl chloride)-N,N,N′,N′-tetramethylhexane-1,6-diamine concept that has been reported previously.2,13 Ionomer (2) is the ad hoc poly(vinylbenzyl chloride)-1-methylimidazole concept that was used to attempt chemical compatibility between the PVBMI-OH−− AAEM and the catalyst layer. | ||
The lower open circuit voltages (OCV) for PVBMI-OH−− [OCV = 0.853 and 0.936 V with ionomer (1) and (2) respectively vs. OCV = 1.06 V for PVBTMA-OH−−− with ionomer (1)] also indicate the inferiority of the BMI-AAEM when operating in the fuel cell. It should be appreciated that the test conditions used have been optimised over many years for use with the BTM-AAEM and QA-type alkaline ionomers, whereas this is a first attempt with a radiation-grafted BMI-AAEM. Considering the main conclusions from this study (see the end of this article) and the post-mortem data below, a lengthy optimisation process for the BMI-type AAEM was deemed not to be justified.
Fig. 7 presents the FT-Raman spectra of the BMI-AAEM before and after fuel cell testing. It is immediately evident that the intensities of the bands at 1413 and 1025 cm−1 (imidazolium ring related) had decayed in the post test sample relative to the 1005 cm−1 benzene ring breathing mode. This is strong evidence that the poor fuel cell performance was due to the in situ degradation of the BMI head-groups during the fuel cell test at 50 °C (even though the tests were at RH = 100%, there would have been lower RH transients during cell start-up). The poor fuel cell performances cannot wholly be accounted for by the area resistances; the poor performances likely stem from a combination of increased resistance and poor electrokinetics due to electrocatalytic interferences from the imidazolium groups and any imidazolium-group-derived degradation products. This is the first evidence in this study that the alkali stability of the BMI-AAEM is not adequate for use in APEFCs.
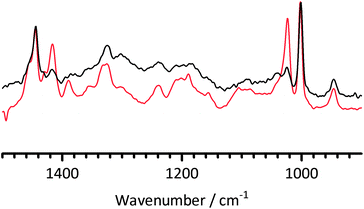 | ||
| Fig. 7 The FT-Raman spectra of the PVBMI membrane in the Cl− form before fuel cell testing (red) and in the unknown anion-form after fuel cell testing (black). The post mortem (post test) sample was taken from the active area of the membrane after the electrodes had been separated from the AAEM and the catalyst layer removed by scraping. | ||
FT-Raman stability measurements on model small molecules
![[thin space (1/6-em)]](https://www.rsc.org/images/entities/char_2009.gif) :
:![[thin space (1/6-em)]](https://www.rsc.org/images/entities/char_2009.gif) 1 molar ratio of BTMA
1 molar ratio of BTMA![[thin space (1/6-em)]](https://www.rsc.org/images/entities/char_2009.gif) :
:![[thin space (1/6-em)]](https://www.rsc.org/images/entities/char_2009.gif) KOH) were heated at 60 °C. The exact nature of this precipitate has not been established as the experiments are on-going (currently 6 months – the precipitate will be isolated and fully characterised when the experiment is terminated as part of the aforementioned extended study using this FT-Raman ex situ stability testing). The solution phase has remained colourless throughout the experiment [to date].
KOH) were heated at 60 °C. The exact nature of this precipitate has not been established as the experiments are on-going (currently 6 months – the precipitate will be isolated and fully characterised when the experiment is terminated as part of the aforementioned extended study using this FT-Raman ex situ stability testing). The solution phase has remained colourless throughout the experiment [to date].
However, the analogous experiment with 1-benzyl-3-methylimidazolium chloride (1B3MI) model compound yielded a more dramatic change. The initially colourless solution started to turn orange/brown within hours of the 1B3MI-containing vials being heated to 60 °C. A large amount of dark brown precipitate was then observed within ca. 1 day from the commencement of heating (this was also mixed with a white precipitate over longer experiment times).
No precipitate or solution colour changes were observed in the control vials (containing only the model compound and deionised water) for both model molecules. For the BTMA, the formation of precipitate was significantly retarded when the aqueous KOH was switched to aqueous K2CO3 (1 mol dm−3) with only traces of fine crystalline needles over several months of experiment; no obvious precipitation was observed when aqueous NaHCO3 (1 mol dm−3) was used [to date]. Similarly, for the 1B3MI, precipitation was retarded when aqueous K2CO3 (1 mol dm−3) and aqueous NaHCO3 (1 mol dm−3) were used and no change in the colour of the solution was observed (to date).
Even before the FT-Raman data is examined, the visual evidence suggests that the BMI-type head-group is less stable than the [not overly stable] BTM-type head-group (as the initial compounds were soluble in the aqueous solutions, the precipitates suggest formation of degradation products). The evidence also suggests that the stability of both head-groups is enhanced when treated at 60 °C in the lower pH solutions.
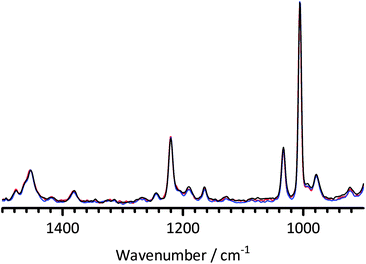 | ||
Fig. 8 The FT-Raman spectra of BTMA at 0 days (dissolved in water – red) and treated at 60 °C in aqueous KOH (1 mol dm−3, 1![[thin space (1/6-em)]](https://www.rsc.org/images/entities/char_2009.gif) : :![[thin space (1/6-em)]](https://www.rsc.org/images/entities/char_2009.gif) 1 molar ratio BTMA 1 molar ratio BTMA![[thin space (1/6-em)]](https://www.rsc.org/images/entities/char_2009.gif) : :![[thin space (1/6-em)]](https://www.rsc.org/images/entities/char_2009.gif) KOH) for 2 (blue) and 23 (black) days. Spectra were normalised to the ring breathing mode at 1005 cm−1. KOH) for 2 (blue) and 23 (black) days. Spectra were normalised to the ring breathing mode at 1005 cm−1. | ||
Visual comparisons of the spectra (facilitated by the thin line overlapping format used in this study as opposed to the commonly encountered vertically stacked presentation) suggest that the BTMA [remaining in solution] does not vary on alkali treatment (at least up to the 23 days presented in Fig. 8). Despite the slow formation of precipitate, significant quantities of BTMA remain in solution in a non-degraded form.
The analogous spectra of the 1B3MI experiments are presented in Fig. 9 (with the non-KOH control experiments presented in Fig. 10); the evolving orange/brown colouration of the solution caused significant fluorescence interferences at higher and lower wavenumbers. Again a precipitate evolved with time for the KOH experiment, which settled quickly, so the spectra will primarily be of the species remaining in solution. The contrast with BTMA is stark: there are significant changes in the spectra with increasing alkali treatment time (that were not observed in the water-only control experiments). An example of the changes observed is the relative changes in the intensities of imidazolium ring mode at 1025 cm−1 compared to the benzene ring breathing mode at 1005 cm−1 (the intensity of the 1025 cm−1 band declines with heating time).31 There are also significant changes in the bands in the range 1300–1500 cm−1: these are also attributable to the imidazolium functionality as they are different to the BTMA spectral features in the same wavenumber range (the chemistry of the base structures for both polymers are identical – it is only the head-group chemistry that has changed). The imidazolium rings are clearly being affected by the strong alkali treatment even at a moderate temperature of 60 °C. This contrast with BTMA suggests that the BMI functionality is inherently less chemically stable to alkali than the BTM functionality.
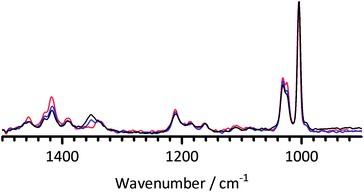 | ||
Fig. 9 The FT-Raman spectra of 1B3MI at 0 days (dissolved in water – red) and treated at 60 °C in aqueous KOH (1 mol dm−3, 1![[thin space (1/6-em)]](https://www.rsc.org/images/entities/char_2009.gif) : :![[thin space (1/6-em)]](https://www.rsc.org/images/entities/char_2009.gif) 1 molar ratio 1B3MI 1 molar ratio 1B3MI![[thin space (1/6-em)]](https://www.rsc.org/images/entities/char_2009.gif) : :![[thin space (1/6-em)]](https://www.rsc.org/images/entities/char_2009.gif) KOH) for 2 (blue) and 23 (black) days. The 1B3MI experiments were conducted in parallel chronologically to both the BTMA experiments (Fig. 8) and the KOH-free control experiments (Fig. 10). Spectra were normalised to the ring breathing mode at 1005 cm−1 and the fluorescence background was removed. KOH) for 2 (blue) and 23 (black) days. The 1B3MI experiments were conducted in parallel chronologically to both the BTMA experiments (Fig. 8) and the KOH-free control experiments (Fig. 10). Spectra were normalised to the ring breathing mode at 1005 cm−1 and the fluorescence background was removed. | ||
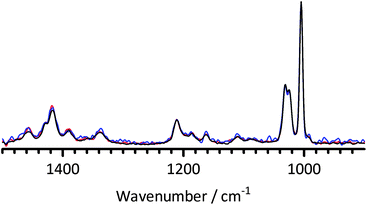 | ||
| Fig. 10 The FT-Raman spectra of 1B3MI dissolved in grade I deionised water (KOH-free control experiment) and treated at 60 °C for 0 (red), 2 (blue) and 23 (black) days. Spectra were normalised to the ring breathing mode at 1005 cm−1. | ||
In confirmation of the visual observations above, the FT-Raman spectra of 1B3MI (see ESI†) and BTMA (not shown) do not show any significant variations when heated at 60 °C in less alkaline aqueous K2CO3 and NaHCO3. This corroborates prior reports8 that the stability of anion-exchange head-groups exhibit higher stabilities in CO32− and HCO3− solutions compared to higher pH aqueous OH− solutions. As an aside, the analogous experiments with a benzene-ring-free analogue (1-butyl-3-methylimidazolium chloride) have commenced [and will be reported in due course]; the photograph presented in the ESI† shows a similar change in the colour of the solution (as is observed with 1B3MI).
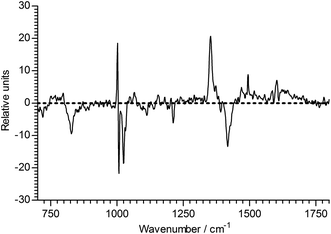 | ||
| Fig. 11 The regression coefficient of the ageing time of 1B3MI. | ||
An examination of the PCA allows the trajectory of degradation to be examined (Fig. 12). Given that PC2 describes 27% of the variance in the ageing data, while PC1 describes 57%, it appears that up to about 16 days of ageing the changes are relatively modest, but at longer times species are produced that cause large changes in the underlying fluorescence of the samples. It is worth noting that the triplicate spectra associated with ageing at 23 days are not clustered in a tight group like the other data, suggesting that there is a large variability in the underlying fluorescence once ageing has proceeded to this stage. This is confirmed by an examination of the two PCs, as seen in Fig. 13. PC1 shows some molecular features superimposed on a strong fluorescence background, while PC2 has a flat background.
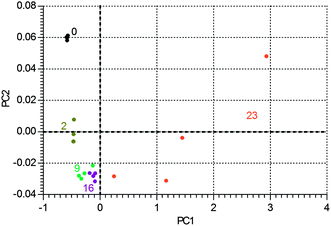 | ||
| Fig. 12 The degradation pathway in PC-space of 1B3MI, with data points labelled (by colour) with number of days of ageing. | ||
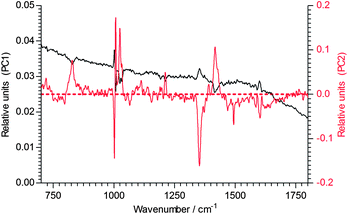 | ||
| Fig. 13 The two PCs that contribute to the regression coefficient of the ageing time of 1B3MI. | ||
A similar analysis of BTMA does show changes on ageing, but these are much smaller. The regression coefficient seen in Fig. 14 should be compared to that of Fig. 11 – it is considerably weaker. There are two bands that change significantly: the largest negative peak is at 1008 cm−1, again suggesting a change in the environment of the ring-breathing aromatic mode, while there are other significant contributions at 1222, 1460, 1495 and 1611 cm−1. The corresponding degradation trajectory is also much less marked than seen with 1B3MI. Fig. 15 shows the changes in BTMA occurring from left to right, but the magnitude of the changes is just over 1% of those seen with 1B3MI.
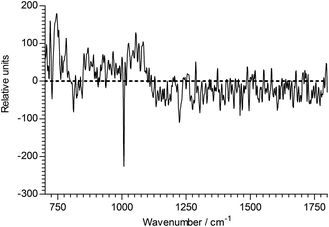 | ||
| Fig. 14 The regression coefficient of the ageing time of BTMA. | ||
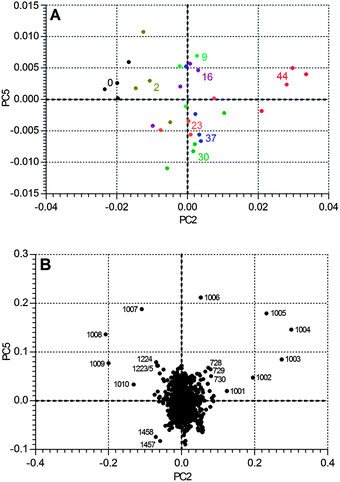 | ||
| Fig. 15 The Degradation Pathway in PC-space of BTMA, with (A) data points labelled with number of days of ageing, and (B) a plot of the two significant PCs (PC5 vs. PC2) with selected data labelled by wavenumber. | ||
Fig. 15 also shows a plot of the two PCs that contribute most to accounting for the ageing variance. It is clearly seen that ageing corresponds to a loss of molecular population centred at 1008 cm−1, and an increase in that around 1004 cm−1. It is evident that this methodology is capable of tracking much smaller changes than simple comparison of spectra, and lends itself to regression against other material properties.
How do these stability results compare to the literature?
The recent literature contains a sudden increase in the number of reports that investigate anion-exchange polymer electrolytes containing pendent imidazolium groups in APEFCs; these describe a range of imidazolium functionalities ranging from polymers with benzylmethylimidazolium-containing side-chains (directly analogous to this study),28b,f polymers containing non-benzylic side-chains containing imidazolium groups,28c,d,h imidazolium groups directly attached to aromatic polymer backbones via –CH2– linkages,28a,e,i,j imidazolium groups directly connected to alkyl (non-benzene) polymer main chains,28g and alkyl-chain bound bisimidazolium groups.28k These studies present conflicting conclusions and so careful and detail contrasts are warranted; this is presented below, along with comments and recommendations on the future methodologies that should be employed.Firstly, the polymer electrolytes containing BMI-type side-chains will be considered as they are the most directly comparable to this study. Yan et al. reported the development of alkyl backbone (tri)co-polymer AAEMs containing styrene and acrylonitrile components with either an additional BMI- or an additional BTM-containing component;28b The IECs were 1.6 meq. g−1 for both types of AAEM and similar ionic conductivities were reported in the temperature range of 20–90 °C and at RH = 100% (e.g. σ = 20 mS cm−1 at 90 °C). This prior study presents data that shows that the BMI-group is much more stable in aqueous KOH (1 mol dm−3) at 60 °C than the BTM-group. This was measured by monitoring both the IEC and ionic conductivity vs. alkali heat treatment time (note: two complimentary methodologies were sensibly used). This result is in stark contrast with the results presented in this current paper (with directly comparable head-group chemistry and alkali treatment conditions [and similar AAEM IEC values]). The only difference is the nature of the polymer back-bone with the presence of non-fluorinated styrene and acrylonitrile copolymer components (that are more than 7 atoms separated from the imidazolium groups). Similarly, the study by Fang et al. on a similar imidazolium containing (bi)copolymer (this time without the acrylonitrile component: IEC = 1.5 meq. g−1, σ = 41 mS cm−1 at 90 °C and when fully hydrated [immersed in water]) also suggests high stability in alkali;28f this result was from a study of the change in ionic conductivity only with immersion in aqueous NaOH solutions at 60 °C for 120 h and concentrations up to 10 mol dm−3.
The next closest type of chemistry of relevance to this current study is where the imidazolium groups were still attached to benzylic groups, but this time where the benzene rings were part of the polymer main chains. Several of these prior studies involved methylimidazolium groups attached to polysulfone polymer main chains via –CH2– links. The first of these recent studies did not present any alkali stability data (AAEMs with IEC in the range 0.8–2.2 meq. g−1 and σ values of up to 83 mS cm−1 at 60 °C when fully hydrated).28a A second study on similar AAEMs also did not present alkali stability data (IECs in the range 1.14–2.03 meq. g−1 and fully hydrated σ values of up to 40 mS cm−1 at 80 °C).28j A study by Zhang et al., however, did present stability data (AAEMs with IEC in the range 1.5–2.5 meq. g−1 and σ = 16–20 mS cm−1 at 20 °C and when immersed in deionised water).28e This group used the conditions of aqueous NaOH (3 mol dm−3) at 60 °C and they monitored the change in AAEM appearance, mass loss, and ionic conductivity with alkali treatment time: The decrease in mass and conductivity were 6.8% and 23.3% respectively after only 24 h. The authors of this prior paper commented specifically that their results conflicted with other studies (e.g. those in ref. 28g and h) and they could not offer a definitive explanation for this disparity.
Another recent study involved poly(phenylene oxide)-based imidazolium AAEMs;28i the IECs were in the range 1.1–2.4 meq. g−1 and the ionic conductivities (4-probe) were 20–70 mS cm−1 at 60 °C (fully hydrated – immersed in water). The membranes changed colour (to deep yellow) on immersion in aqueous NaOH (2 mol dm−3) and the ionic conductivities dropped over the first 60 h of alkali treatment at both 25 and 60 °C (and then stabilised). This then suggests that this type of imidazolium AAEM has lower alkali stability [the conclusion of reasonable alkali stability stated in this prior study was, in hindsight, too strong considering only conductivity vs. time data were studied].
Moving onto non-benzylic systems, the study by Elabd and Ye involving poly(1-[(2-methacryloyoxy)ethyl]-3-butylimidazolium) electrolytes (already discussed in detail) presents clear NMR spectroscopic data for imidazolium ring opening when treated in strongly alkaline conditions.28c A study by Yan et al. (note: the same authors as for ref. 28b) presents data on a class of imidazolium AAEM where the dimethylimidazolium groups are connected to a fluorenyl-sulfone polymer backbone via long alkyl pendent side-chains; the additional methyl group is attached to the carbon atom located between the two nitrogen atoms.28d The AAEM had an IEC = 0.98 meq. g−1 and σ = 43 mS cm−1 at 60 °C in a RH = 100% atmosphere. The alkali stability tests were conducted by monitoring the conductivity and IEC of the polymer electrolyte when immersed in aqueous KOH (1 mol dm−3) at 60 °C; this study also, correctly, used additional spectroscopic data to probe for degradation. The NMR and FT-IR spectroscopic data both suggested a lack of degradation at 400 h; the AAEM did not show any significant drop in conductivity over a period of 400 h, whilst the IEC decreased from 0.98 to 0.93 meq. g−1 (the statistical significance of this decrease in IEC cannot be established as no error data [from replicate measurements] was presented). The data from the studies in ref. 28c and d produce conflicting conclusions on the alkali stability of polymer bound alkylimidazolium groups. A question that needs to be addressed is this: does the additional methyl group attached to the C located between the two imidazolium N atoms stabilise the imidazolium functional groups?
Fang et al. (note: the same group that conducted the study in ref. 28f) presented data on a benzene-free polymer where the methylimidazolium group is attached to an alkyl main chain copolymer via –CH2– links.28h The AAEMs studied had IECs in the range 1.54–1.79 meq. g−1 and σ values in the range 36–66 mS cm−1 at 90 °C and in a RH = 100% atmosphere. The alkali stabilities of the AAEMs were evaluated by measuring the drop in conductivity on immersion in aqueous KOH (6 mol dm−3) at various temperatures: small drops in conductivity were noted after 120 h at 60 °C with more significant drops in conductivity at 80 °C. No significant drops in the masses of the AAEMs or changes in AAEMs' appearances were reported for the 120 h 60 °C alkali treatment.
A further study of interest by Yan et al. involved (tri)copolymer-class of AAEM containing styrene and acrylonitrile components and a final component where the methylimidazolium group is attached directly to the alkyl main chain (no –CH2–, alkyl or benzyl links).28g The AAEMs had IECs in the range 0.2–1.5 meq. g−1 and σ = 2.8–54 mS cm−1 at 60 °C in a RH = 100% atmosphere. The alkaline stabilities were probed by monitoring the IEC and conductivity after immersion of the AAEMs in aqueous KOH (both 1 and 10 mol dm−3) at 60 °C. The data presented indicated that the non-benzylic imidazolium groups were highly alkaline stable. Finally, Yan et al. have reported on an AAEM containing alkyl-chain-based bisimidazolium groups.28k Again, high stabilities were reported where the IEC were 1.42 meq. g−1 as synthesised and only dropped to 1.40 meq. g−1 after immersion in aqueous KOH (1 mol dm−3) at 60 °C for 120 h. There was also no significant drop in conductivities after immersion in aqueous KOH (1 mol dm−3) at 60 °C for 30 days.
It is evident from the above that there is a significant amount of conflicting data in the prior literature regarding the stability of both benzylic and benzene-ring-free imidazolium polymer electrolytes. The new spectroscopic data presented in this current paper clearly indicates that BMI groups are less stable than BTM groups. This is in the starkest contrast with the Yan study involving polymer-bound BMI which were reported to be more stable than BTM groups.28b It is highly unlikely that the relative stabilities of these two functional head-group chemistries would switch dramatically on going from being small molecules to polymer-bound in nature (i.e. this study vs. the prior study in ref. 28b). In fact, the fuel cell post mortem test on the radiation-grafted AAEMs discussed above (Fig. 7) actually indicate that the BMI groups are just as alkali unstable when polymer bound (as radiation-grafted AAEMs) as they are when attached to small model molecules.
As a final experiment to clarify this, samples of both types of AAEM(Cl−-form) were immersed in both deionised water and N2-purged KOH (1 mol dm−3) for 14 days at 60 °C: after removal from the solutions, the FT-Raman spectra of the post-treated membranes (both of which were considerable darkened in colour when alkali treated) were then analysed and compared (Fig. 16). This simple experiment reconfirms the relative instability of the radiation-grafted polymer membranes with the pendent benzylmethylimidazolium group compared to the benchmark benzyltrimethylammonium group (i.e. the imidazolium-related bands decrease in intensity on alkali treatment).
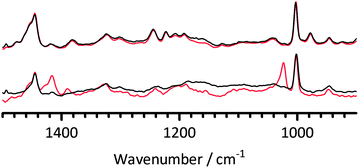 | ||
| Fig. 16 The FT-Raman spectra of PVBMI-Cl−−− (bottom) and PVBTMA-Cl−−− (top) after 14 days heat treatment at 60 °C in deionised water (red) and aqueous KOH (1 mol dm−3) (black). Spectra were normalised to the ring breathing mode at 1005 cm−1 and the fluorescence background was removed. | ||
A key question that needs to be addressed is this: would distant inductive effects from the different polymer backbone components induce such a dramatic change in imidazolium (or BTM) alkaline stability? Another possibility for the discrepancies in the literature is the different methodologies that have been followed in order to measure the chemical stabilities of AAEMs.
A critique of the methods used to measure the alkaline stability of AAEMs
It is clear that there is a lack of standardised methodology for studying the alkaline stabilities of AAEMs. It is bad practice to rely on conductivity data alone (degradation species may well contribute towards the ionic conductivity values being measured – plus the precision of such measurements are often lower than for other techniques). IEC-related stability measurements are slightly more meaningful (although degradation products may also exhibit exchange capacities, depending on the titration method used). We recommend that detailed spectroscopic or chromatography/mass-spec data must be used in conjunction with other techniques (such as IEC) in order to fully probe the degradation of anion-exchange head-groups, when bound to a polymer matrix, in alkaline environments.In fact, the level of sophistication in the determination of IECs could be improved: a mixture of titration techniques can be used to estimate the amount of both tertiary amine (TA) and QA groups that are present.37 This would be especially relevant in monitoring the degradation of QA groups in alkali where the conversion of QA groups into TA would occur over time.21 It is now becoming standard practice in our laboratory to use a range of chloride ion precipitation titrations to separately measure both the total exchange capacity (ECtot: amount of QA + TA present in the membranes) as well as the QA-only IEC. The TA content can be gauged from ECTA = ECtot − IECQA. A paper describing a study of a fully validated and detailed methodology is under preparation (example data is presented in the ESI†); the validation involved the comparison of radiation-grafted anion-exchange membranes containing only QA groups (made using trimethylamine amination agent), only TA groups (made using dimethylamine), and both QA and TA groups (made using N,N,N′,N′-tetramethyldiaminomethane). A lack of sample prevents such experiments being conducted with the BMI-AAEM in this study: as the BMI-AAEMs are clearly not alkali stable (Fig. 16), there is little point in conducting these experiments. However, such supporting experiments will be vital in future studies on AAEMs containing high stability head-groups (when identified spectroscopically).
There is a further factor that should be considered when measuring the stability of OH−-form AAEMs in water (not aqueous alkaline solutions) or in atmospheres with controlled RH: it is critically important to ensure than all traces of CO2 are eliminated from the system if the stabilities of hydroxide-form AAEM are being monitored with time (at any temperature).26 If traces of CO2 are present (or CO2 is slowly but continuously leaking into the system), then the AAEMs will rapidly convert [either wholly or partially] to the carbonate and/or bicarbonate forms; this will lead to a dramatic over estimation of the stability of the head-groups being studied. The ease with which total CO2 exclusion can be achieved is still being debated. This is the principal reason why the authors object to the terms hydroxide exchange membrane fuel cell (HEMFC) and hydroxide exchange membranes (HEM). In real world applications, non-hydroxide alkaline anions (CO32− or HCO3−) will always be present to varying degrees; this is why the terms alkaline polymer electrolyte fuel cell (APEFC) and alkaline anion-exchange membrane (AAEM) are used in this study. The idea of in situ generation of the hydroxide form membrane in ex situ conductivity cells, recently mooted by Kimura and Yamazaki,6 is of high potential merit and should be investigated further.
Conclusions
The aim of this study was to produce a radiation-grafted alkaline anion-exchange membrane (AAEM) containing pendent benzylmethylimidazolium (BMI) head-groups with an identical ion-exchange capacity compared to a benzyltrimethylammonium (BTM)-type benchmark AAEM. This was achieved. The BMI-based AAEM did not exhibit any significant property advantages compared to the benchmark BTM-AAEM (e.g. no significant improvement in ionic conductivities). Detailed Raman spectroscopic studies on the chemical stability of the different functional groups suggest that the BMI-head-group is also less stable that the BTM-head-group in alkaline conditions and at a moderate temperature of 60 °C (in support of some earlier reports and contrary to others). For anion-exchange polymer electrolytes to be applicable to high performance alkaline polymer electrolyte fuel cells (APEFC), the head-group chemistry must be stable in the presence of alkaline counter anions at temperatures of at least 80 °C; this is to maximise the ionic conductivities of the polymer electrolytes and to impart the required tolerance to traces of CO2 (present in the air supplies at the cathode); APEFC tolerance to CO2 is believed to be enhanced at 80 °C or above.15Recommendation
Taking the findings presented here in combination with the prior rigorous spectroscopic work of Elabd and Ye,28c the authors are of the opinion that there appears to be no major advantage in using anion-exchange polymer electrolytes containing pendent imidazolium functional groups over the well known and commonly encountered quaternary ammonium-types in highly alkaline electrochemical systems. There may be a small exception to this where an additional methyl group is attached on the carbon atom located between the two imidazolium nitrogen atoms.28d We also acknowledge that polymer electrolytes containing (non-pendent) benzimidazolium groups that are a core part of the polymer main-chain [and/or with sterically hindered C-2 carbons] may also show alkali stability.38 However, more evidence that these [exception] cases do indeed have useful alkali stabilities is required. There may also be a role for pendent-imidazolium-type anion-exchange polymer electrolytes in electrochemical and bioelectrical systems operating in the presence of only weakly alkaline carbonate/bicarbonate anions7,39 or other non-alkaline (e.g. halide) anions or buffers, but this again warrants detailed further investigation: These further studies should include a fundamental electrochemical study of the effect of imidazolium moieties on the electrokinetics of the chosen catalyst in basic media of different pHs.16Considering all of the above, the authors therefore recommend that the search for alkali stable anion-exchange head-groups avoids pendent heterocyclic systems (such as imidazolium and pyridinium40 – the latter well known to be alkali unstable) and that research resources focus on other chemistries. The (admittedly bulky) phosphazenium,41 alkyloxy-quaternary-ammonium27,42 and singly quaternised DABCO22 functional groups appear to be worthy of further investigation.
Acknowledgements
The authors thank the UK's Engineering and Physical Sciences Research Council (EPSRC grant EP/H025340/1 and Dr John Varcoe's EPSRC Leadership Fellowship funded with grant EP/I004882/1). The University of Surrey is thanked for providing funds for Oliver Deavin's final year undergraduate project. Synergy Health (formally Isotron Ltd.) is thanked for allowing access to their electron-beam facility. Dr David Apperley and the EPSRC Solid State service at the University of Durham are thanked for obtaining the NMR spectra.Notes and references
- J. Pan, S. Lu, Y. Li, A. Huang, L. Zhuang and J. Li, Adv. Funct. Mater., 2010, 20, 312 CrossRef CAS; Y. Wu, C. Wu, J. R. Varcoe, S. D. Poynton, T. Xu and Y. Fu, J. Power Sources, 2010, 195, 3069 CrossRef; J. Pan, Y. Li, L. Zhuang and J. Lu, Chem. Commun., 2010, 46, 8597 RSC; K. Matsumoto, T. Fujigaya, H. Yanagi and N. Nakashima, Adv. Funct. Mater., 2011, 21, 1089 CrossRef; J. Ni, C. Zhao, G. Zhang, Y. Zhang, J. Wang, W. Ma, Z. Liu and H. Na, Chem. Commun., 2011, 47, 8943 RSC; L. An and T. S. Zhao, Energy Environ. Sci., 2011, 4, 2213 Search PubMed; G. Merle, M. Wessling and K. Nijmeijer, J. Membr. Sci., 2011, 377, 1 CrossRef; R. Zeng and J. R. Varcoe, Recent Pat. Chem. Eng., 2011, 4, 93 CrossRef; R. Zeng, J. Handsel, S. D. Poynton, A. J. Roberts, R. C. T. Slade, H. Herman, D. C. Apperley and J. R. Varcoe, Energy Environ. Sci., 2011, 4, 4925 Search PubMed; J. Pan, C. Chen, L. Zhuang and J. Lu, Acc. Chem. Res., 2012, 45, 473 CrossRef; N. Li, T. Yan, Z. Li, T. Thurn-Albrecht and W. H. Binder, Energy Environ. Sci., 2012, 5, 7888 Search PubMed; M. Mamlouk, J. A. Horsfall, C. Williams and K. Scott, Int. J. Hydrogen Energy, 2012, DOI:10.1016/j.ijhydene.2012.05.117, in press.
- J. R. Varcoe, R. C. T. Slade, G. L. Wright and Y. Chen, J. Phys. Chem. B, 2006, 110, 21041 CrossRef CAS; S. Lu, J. Pan, A. Huang, L. Zhuang and J. Lu, Proc. Natl. Acad. Sci. U. S. A., 2008, 105, 20611 CrossRef; S. D. Poynton, J. P. Kizewski, R. C. T. Slade and J. R. Varcoe, Solid State Ionics, 2010, 181, 219 CrossRef; T. Sakamoto, K. Asazawa, K. Yamada and H. Tanaka, Catal. Today, 2011, 164, 181 CrossRef; M. Mamlouk, S. M. S. Kumar, P. Gouerec and K. Scott, J. Power Sources, 2011, 196, 7594 CrossRef.
- A. Kucernak, F. Bidault and G. Smith, Electrochim. Acta, DOI:10.1016/j.electacta.2012.03.027, in press.
- M. R. Hibbs, C. H. Fujimoto and C. J. Cornelius, Macromolecules, 2009, 42, 8316 CrossRef CAS; N. J. Robertson, H. A. Kostalik IV, T. J. Clark, P. F. Mutolo, H. D. Abruña and G. W. Coates, J. Am. Chem. Soc., 2010, 132, 3400 CrossRef; H. A. Kostalik IV, T. J. Clark, N. J. Robertson, P. F. Mutolo, J. M. Longo, H. D. Abruña and G. W. Coates, Macromolecules, 2010, 43, 7147 CrossRef; B. P. Tripathi, M. Kumar and V. K. Shahi, J. Membr. Sci., 2010, 360, 90 CrossRef; M. Tanaka, M. Koike, K. Miyatake and M. Watanabe, Macromolecules, 2010, 43, 2657 CrossRef; J. H. Wang, S. H. Li and S. B. Zhang, Macromolecules, 2010, 43, 3890 CrossRef; M.-S. J. Jung, C. G. Arges and V. Ramani, J. Mater. Chem., 2011, 21, 6158 RSC; M. Tanaka, M. Koike, K. Miyatake and M. Watanabe, Polym. Chem., 2011, 2, 99 RSC.
- L. A. Adams, S. D. Poynton, C. Tamain, R. C. T. Slade and J. R. Varcoe, ChemSusChem, 2008, 1, 79 CrossRef CAS; J. Zhou, M. Ünlü and P. A. Kohl, Electrochem. Solid-State Lett., 2009, 12, B27 CrossRef; J. A. Vega, S. Smith, C. Chartier and W. E. Mustain, ECS Trans., 2010, 28, 103 CrossRef; Z. Siroma, S. Watanabe, K. Yasuda, K. Fukuta and H. Yanagi, J. Electrochem. Soc., 2011, 158, B682 CrossRef.
- T. Kimura and Y. Yamazaki, Electrochemistry, 2011, 79, 94 CrossRef CAS.
- C. M. Lang, K. Kim and P. A. Kohl, Electrochem. Solid-State Lett., 2006, 9, A545 CrossRef CAS; J. Zhou, M. Ünlü, J. A. Vega and P. A. Kohl, J. Power Sources, 2009, 190, 285 CrossRef; J. A. Vega and W. E. Mustain, Electrochim. Acta, 2010, 55, 1638 CrossRef; J. A. Vega, N. Spinner, M. Catanese and W. E. Mustain, J. Electrochem. Soc., 2012, 159, B19 CrossRef.
- J. A. Vega, C. Chartier and W. E. Mustain, J. Power Sources, 2010, 195, 7176 CrossRef CAS.
- W. Gellett, J. Schumacher, M. Kesmez, D. Le and S. D. Minteer, J. Electrochem. Soc., 2010, 157, B557 CrossRef CAS; Y. Zuo, S. Cheng and B. E. Logan, Environ. Sci. Technol., 2008, 42, 6967 CrossRef.
- B. Schwenzer, J. Zhang, S. Kim, L. Li, J. Liu and Z. Yang, ChemSusChem, 2011, 4, 1388 CrossRef CAS.
- Y. Leng, G. Chen, A. J. Mendoza, T. B. Tighe, M. A. Hickner and C.-Y. Wang, J. Am. Chem. Soc., 2012, 134, 9054 CrossRef CAS; L. Xiao, S. Zhang, J. Pan, C. Yang, M. He, L. Zhuang and J. Lu, Energy Environ. Sci., 2012, 5, 7869 Search PubMed; Y.-C. Cao, X. Wu and K. Scott, Int. J. Hydrogen Energy, 2012, 37, 9524 CrossRef.
- R. Zeng, S. D. Poynton, J. P. Kizewski, R. C. T. Slade and J. R. Varcoe, Electrochem. Commun., 2010, 12, 823 CrossRef CAS; R. Zeng, R. C. T. Slade and J. R. Varcoe, Electrochim. Acta, 2010, 56, 607 CrossRef.
- J. R. Varcoe, R. C. T. Slade and E. Lam How Yee, Chem. Commun., 2006, 1428 RSC.
- J. Wang, Z. Zhao, F. Gong, S. Li and S. Zhang, Macromolecules, 2009, 42, 8711 CrossRef CAS; S. Gu, R. Cai, T. Luo, Z. Chen, M. Sun, Y. Liu, G. He and Y. Yan, Angew. Chem., Int. Ed., 2009, 48, 6499 CrossRef; M. Piana, M. Boccia, A. Filpi, E. Flammia, H. A. Miller, M. Orsini, F. Salusti, S. Santiccioli, F. Ciardelli and A. Pucci, J. Power Sources, 2010, 195, 5875 CrossRef; M. Mamlouk, K. Scott, J. A. Horsfall and C. Williams, Int. J. Hydrogen Energy, 2011, 36, 7191 CrossRef.
- B. Pivovar, Alkaline Membrane Fuel Cell Workshop Final Report NREL/BK-5600-54297, National Renewable Energy Laboratory, Golden CO, USA, 2011, http://www.osti.gov/bridge Search PubMed.
- M. Ünlü, D. Abbott, N. Ramaswamy, X. Ren, S. Mukerjee and P. A. Kohl, J. Electrochem. Soc., 2011, 158, B1423 CrossRef.
- J. A. Vega, S. Smith and W. E. Mustain, J. Electrochem. Soc., 2011, 158, B349 CrossRef CAS.
- W. Sheng, H. A. Gasteiger and Y. Shao-Horn, J. Electrochem. Soc., 2010, 157, B1529 CrossRef CAS.
- J. R. Varcoe, Phys. Chem. Chem. Phys., 2007, 9, 1479 RSC.
- M. Mamlouk and K. Scott, J. Power Sources, 2012, 211, 140 CrossRef CAS.
- C. S. Macomber, J. M. Boncella, B. S. Pivovar and J. A. Rau, J. Therm. Anal. Calorim., 2008, 93, 225 CrossRef CAS; S. Chempath, B. R. Einsla, L. R. Pratt, C. S. Macomber, J. M. Boncella, J. A. Rau and B. S. Pivovar, J. Phys. Chem. C, 2008, 112, 3179 Search PubMed; S. Chempath, J. M. Boncella, L. R. Pratt, N. Henson and B. S. Pivovar, J. Phys. Chem. C, 2010, 114, 11977 Search PubMed; J. B. Edson, C. S. Macomber, B. S. Pivovar and J. M. Boncella, J. Membr. Sci., 2012, 399–400, 49–59 CrossRef; H. Long, K. Kim and B. S. Pivovar, J. Phys. Chem. C, 2012, 116, 9419 Search PubMed.
- X. Wang, M. Li, B. T. Golding, M. Sadeghi, Y. Cao, E. H. Yu and K. Scott, Int. J. Hydrogen Energy, 2011, 36, 10022 CrossRef CAS; B. Baur, H. Strathmann and F. Effenberger, Desalination, 1990, 79, 125 CrossRef.
- S. Gu, R. Cai and Y. Yan, Chem. Commun., 2011, 47, 2856 RSC.
- Y.-C. Cao, X. Wang, M. Mamlouk and K. Scott, J. Mater. Chem., 2011, 21, 12910 RSC.
- Q. Zhang, S. Li and S. Zhang, Chem. Commun., 2010, 46, 7495 RSC; X. Lin, L. Wu, Y. Liu, A. L. Ong, S. D. Poynton, J. R. Varcoe and T. Xu, J. Power Sources, 2012, 217, 373 CrossRef CAS.
- Y. Zha, M. L. Disabb-Miller, Z. D. Johnson, M. A. Hickner and G. N. Tew, J. Am. Chem. Soc., 2012, 134, 4493 CrossRef CAS.
- M. Tomoi, K. Yamaguchi, R. Ando, Y. Kantake, Y. Aosaki and H. Kubota, J. Appl. Polym. Sci., 1997, 64, 1161 CrossRef CAS.
- (a) X. Yan, G. He, S. Gu, X. Wu, L. Du and Y. Wang, Int. J. Hydrogen Energy, 2012, 37, 5216 CrossRef CAS; (b) B. Qiu, B. Lin, L. Qiu and F. Yan, J. Mater. Chem., 2012, 22, 1040 RSC; (c) Y. Ye and Y. A. Elabd, Macromolecules, 2011, 44, 8494 CrossRef CAS; (d) B. Lin, L. Qiu, B. Qiu, Y. Peng and F. Yan, Macromolecules, 2011, 44, 9642 CrossRef CAS; (e) F. Zhang, H. Zhang and C. Qu, J. Mater. Chem., 2011, 21, 12744 RSC; (f) W. Li, J. Fang, M. Lv, C. Chen, X. Chi, Y. Yang and Y. Zhang, J. Mater. Chem., 2011, 21, 11340 RSC; (g) B. Lin, L. Qiu, J. Lu and F. Yan, Chem. Mater., 2010, 22, 6718 CrossRef CAS; (h) M. Guo, J. Fang, H. Xu, W. Li, X. Lu, C. Lan and K. Li, J. Membr. Sci., 2010, 362, 97 CrossRef CAS; (i) J. Ran, L. Wu, J. R. Varcoe, A. L. Ong, S. D. Poynton and T. Xu, J. Membr. Sci., DOI:10.1016/j.memsci.2012.05.006, in press; (j) Q. Hu, Y. Shang, Y. Wang, M. Xu, W. Wang, X. Xie, S. Wang, H. Zhang, J. Wang and Z. Mao, Int. J. Hydrogen Energy, DOI:10.1016/j.ijhydene.2012.05.077, in press; (k) B. Qiu, B. Lin, Z. Si, L. Qiu, F. Chu, J. Zhao and F. Yan, J. Power Sources, 2012, 217, 329 CrossRef.
- J. R. Varcoe, R. C. T. Slade, E. Lam How Yee, S. D. Poynton, D. J. Driscoll and D. C. Apperley, Chem. Mater., 2007, 19, 2686 CrossRef CAS.
- H. Martens and T. Naes, Multivariate Calibration, Wiley 1991, ISBN:0471930474 Search PubMed.
- E. R. Talaty, S. Raja, V. J. Storhaug, A. Dölle and W. R. Carper, J. Phys. Chem. B, 2004, 108, 13177 CrossRef CAS.
- T. N. Danks, R. C. T. Slade and J. R. Varcoe, J. Mater. Chem., 2003, 13, 712 RSC.
- H. Sun, G. Zhang, Z. Liu, N. Zhang, L. Zhang, W. Ma, C. Zhao, D. Qi, G. Li and H. Na, Int. J. Hydrogen Energy, 2012, 37, 9873 CrossRef CAS.
- H. P. Brack, H. G. Bueher and G. G. Scherer, J. Polym. Sci., Part A: Polym. Chem., 1995, 33, 1545 Search PubMed.
- H. Yanagi and K. Fukuta, ECS Trans., 2008, 16, 257 CrossRef CAS; J. P. Kizewski, N. H. Mudri, R. Zeng, S. D. Poynton, R. C. T. Slade and J. R. Varcoe, ECS Trans., 2010, 33, 27 CrossRef.
- J. Yan and M. A. Hickner, Macromolecules, 2010, 43, 2349 CrossRef CAS.
- A. A. Zagorodni, D. L. Kotova and V. F. Selemenev, React. Funct. Polym., 2002, 53, 157 CrossRef CAS.
- O. D. Thomas, K. J. W. Soo, T. J. Peckham, M. P. Kulkarni and S. Holdcroft, J. Am. Chem. Soc., 2012, 134, 10753 CrossRef CAS.
- M. D. Eisaman, L. Alvarado, D. Larner, P. Wang, B. Garg and K. A. Littau, Energy Environ. Sci., 2011, 4, 1319 CAS.
- A. B. Huang, C. Y. Xia, C. B. Xiao and L. Zhuang, J. Appl. Polym. Sci., 2006, 100, 2248 CrossRef CAS; T. Sata, M. Tsujimoto, T. Yamaguchi and K. Matsusaki, J. Membr. Sci., 1996, 112, 161 CrossRef.
- R. Schwesinger, R. Link, P. Wenzl, S. Kossek and M. Keller, Chem.–Eur. J., 2006, 12, 429 CrossRef.
- Z. Zhang, L. Wu, J. Varcoe, C. Li, A. L. Ong, S. D. Poynton and T. Xu, Unpublished.
Footnote |
| † Electronic supplementary information (ESI) available: Additional details of the methodologies used, additional spectroscopic characterisation data for the membranes, and additional data in support of the small molecule FT-Raman stability tests. A zip file containing the raw spectra (in text format – intensity versus wavenumber) is available. See DOI: 10.1039/c2ee22466f |
| This journal is © The Royal Society of Chemistry 2012 |
