 Open Access Article
Tropospheric OH and HO2 radicals: field measurements and model comparisons†
Daniel
Stone
,
Lisa K.
Whalley
and
Dwayne E.
Heard
*
School of Chemistry, University of Leeds, Leeds, LS2 9JT, UK. E-mail: d.e.heard@leeds.ac.uk
First published on 21st August 2012
Abstract
The hydroxyl radical, OH, initiates the removal of the majority of trace gases in the atmosphere, and together with the closely coupled species, the hydroperoxy radical, HO2, is intimately involved in the oxidation chemistry of the atmosphere. This critical review discusses field measurements of local concentrations of OH and HO2 radicals in the troposphere, and in particular the comparisons that have been made with numerical model calculations containing a detailed chemical mechanism. The level of agreement between field measurements of OH and HO2 concentrations and model calculations for a given location provides an indication of the degree of understanding of the underlying oxidation chemistry. We review the measurement-model comparisons for a range of different environments sampled from the ground and from aircraft, including the marine boundary layer, continental low-NOx regions influenced by biogenic emissions, the polluted urban boundary layer, and polar regions. Although good agreement is found for some environments, there are significant discrepancies which remain unexplained, a notable example being unpolluted, forested regions. OH and HO2 radicals are difficult species to measure in the troposphere, and we also review changes in detection methodology, quality assurance procedures such as instrument intercomparisons, and potential interferences.
 Daniel Stone | Daniel Stone is a post-doctoral researcher in the School of Chemistry, University of Leeds. He obtained his PhD from University College London in 2006 in the field of peroxy radical reaction kinetics, and before joining the atmospheric chemistry group in Leeds he conducted post-doctoral research at the National Centre for Electron Paramagnetic Resonance Spectroscopy at the University of Manchester. His research uses numerical models to simulate atmospheric composition at local and global scales and to interpret field observations of OH and HO2 radicals, and he has been involved in ground-based and aircraft measurements of OH, HO2 and OH reactivity. |
 Lisa K. Whalley | Lisa Whalley is a National Centre for Atmospheric Science (NCAS) supported research fellow at the University of Leeds. Having completed her PhD which focused on the development of airborne gas chromatographs for measurements of short-chain alkanes and peroxyacetyl nitrate, she began postdoctoral research using the Master Chemical Mechanism looking at the evolution of North American plumes over the Atlantic and Europe. She joined Professor Heard’s group in 2005, with responsibility for the development and operation of the FAGE instrument for ground-based measurements of OH, HO2, OH reactivity and IO radicals and has participated in 11 field campaigns to date. |
 Dwayne E. Heard | Dwayne Heard has worked at the University of Leeds since 1994 where he is Professor of Atmospheric Chemistry. Prior to Leeds he was a lecturer at Macquarie University, Australia, a postdoctoral fellow at SRI International, Menlo Park, and he did both his postgraduate and undergraduate degrees at Oxford University. His research interests include laser-based measurements of short-lived radicals in the atmosphere from surface- and aircraft-based platforms, and comparison with model calculations, and the study of the reaction kinetics and photochemistry of important molecules in the atmosphere. His group has participated in over 25 field campaigns worldwide since 1996. |
1. Introduction
The hydroxyl radical, OH, is the dominant daytime oxidant in the troposphere, removing the majority of trace gases emitted into the atmosphere, including greenhouse gases and substances harmful to health, and initiates the formation of a wide range of secondary species, for example ozone and secondary organic aerosol. The reaction of HO2 and RO2 radicals with NO initiates the only tropospheric in situ source of ozone. OH and HO2 are ideal target molecules to test the accuracy of chemical mechanisms in a variety of environments. The short chemical lifetimes, due to their high reactivity, means that their budgets (and hence concentrations) are only controlled by local in situ chemistry, and not by transport processes. Zero-dimensional models, which consider a box in which the sample is well mixed, can be used to describe the chemistry of OH and HO2 under specific conditions without having to incorporate transport into or out of the box.There have now been a considerable number of field campaigns in which measured concentrations of OH and HO2 radicals have been compared with the results of model simulations which are highly constrained to the co-observed field data for longer-lived species and photolysis rates. In order to adequately describe the photo-oxidative degradation of a wide range of volatile organic compounds, models can be extremely complex, with mechanisms often containing many thousands of reactions and chemical species. An example is the Master Chemical Mechanism (MCM), a near-explicit chemical mechanism describing the detailed gas phase tropospheric degradation of methane and 143 primary emitted non-methane volatile organic compounds (VOCs), which include the major emitted anthropogenic species as listed in the UK National Atmospheric Emissions Inventory (e.g. Saunders et al.1). The current version (MCMv3.2) contains ca. 6700 species and 17![[thin space (1/6-em)]](https://www.rsc.org/images/entities/char_2009.gif) 000 reactions.2 The advantage of a detailed model such as the MCM is that it explicitly treats the oxidation of many VOCs, but a disadvantage is that the kinetics and product branching ratios of most of the reactions in the mechanism have not been adequately studied, and a series of rules and structure activity relationships are needed to provide the data needed to output radical concentrations. In addition, observations of VOCs in the field are almost always not sufficiently comprehensive to exploit the full mechanism. An alternative is the use of lumped mechanisms containing a smaller number of reactions, which have also been used widely to compare with field measurements. An advantage of a lumped mechanism is that it is based on observed results from chamber studies, whereas a disadvantage is that it can only adequately describe the oxidation of a limited range of VOC mixtures.
000 reactions.2 The advantage of a detailed model such as the MCM is that it explicitly treats the oxidation of many VOCs, but a disadvantage is that the kinetics and product branching ratios of most of the reactions in the mechanism have not been adequately studied, and a series of rules and structure activity relationships are needed to provide the data needed to output radical concentrations. In addition, observations of VOCs in the field are almost always not sufficiently comprehensive to exploit the full mechanism. An alternative is the use of lumped mechanisms containing a smaller number of reactions, which have also been used widely to compare with field measurements. An advantage of a lumped mechanism is that it is based on observed results from chamber studies, whereas a disadvantage is that it can only adequately describe the oxidation of a limited range of VOC mixtures.
The tropospheric chemistry of OH and HO2 is summarised in Fig. 1. A major pathway for the formation of OH is via the reactions:
| O3 + hν (λ < 340 nm) → O(1D) + O2 | (R1) |
| O(1D) + H2O → 2OH | (R2) |
| OH + CO (+O2) → HO2 + CO2 | (R3) |
| HO2 + O3 → OH + 2O2 | (R4) |
| OH + RH + O2 → RO2 + H2O | (R5) |
| CH3O2 + CH3O2 → 2CH3O + other products | (R6) |
| CH3O + O2 → HO2 + HCHO | (R7) |
| HO2 + HO2 → H2O2 + O2 | (R8) |
| HO2 + CH3O2 → CH3O2H + O2 | (R9) |
| HO2 + NO → OH + NO2 | (R10) |
| RO2 + NO → RO + NO2 | (R11) |
| RO + O2 → R′CHO + HO2 | (R12) |
| NO2 + hν (λ < 420 nm) → O(3P) + NO | (R13) |
| O(3P) + O2 + M → O3 + M | (R14) |
| HO2 + XO → HOX + O2 | (R15) |
| HOX + hν → OH + X | (R16) |
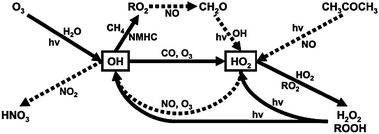 | ||
| Fig. 1 Simplified HOx production and loss scheme in the remote troposphere. Pathways amplified by high NOx concentrations are indicated by dashed lines, solid lines indicate processes which dominate under background conditions. (Reproduced from ref. 48, Copyright (2006) American Geophysical Union. Reproduced by permission of American Geophysical Union. Further reproduction or electronic distribution is not permitted.) | ||
The rate of primary production of OH from reactions (R1) and (R2) is given by:
| P(OH) = 2f[O3] × j(O1D) | (E1) |
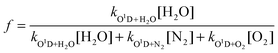 | (E2) |
 | (E3) |
 | (E4) |
For some remote environments, the reaction of O(1D) with water vapour has been shown to dominate the production of OH, giving:
 | (E5) |
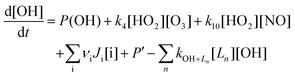
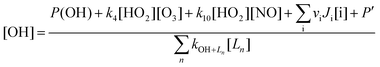
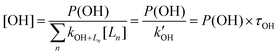
 is the OH reactivity (inverse of the lifetime), the latter a quantity that is now routinely measured in the field.8–13 For a constant lifetime, a plot of [OH] against P(OH) should be linear with slope τOH, an example of which is shown in Fig. 2. More generally, the OH concentration can be parameterised in terms of j(O1D) (or P(OH)) using:
| [OH] = (a × j(O1D)b) + c | (E6) |
 | ||
| Fig. 2 Correlation of observed OH concentrations with j(O1D) at the Meteorological Observatory Hohenpeissenberg between April 1999 and December 2003. Left: 5 minute averaged data. Right: Monthly averages (Reproduced from ref. 95, Copyright (2006), with permission from Nature Publishing Group.) | ||
 | ||
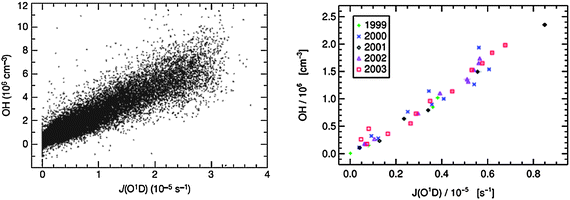
| Fig. 3 Correlation of 4 minute averaged HO2 with j(O1D) at the Cape Verde Atmospheric Observatory during three seasons of 2009; SOS1 (Feb.–Mar.), SOS2 (June), SOS3 (Sept.). (Reproduced from ref. 15, Copyright (2012), with permission from Copernicus Publications.) | ||
Good agreement between measured and modelled [OH] may occur fortuitously if the rate of production from missing OH sources counterbalances the rate of destruction from missing OH sinks on the RHS of eqn (E4). In such cases, field measurements have not provided an adequate test of the level of understanding of the underlying chemistry. Not surprisingly, the advent of new techniques and updated instrumentation has meant that more and more species are being measured, with halogen oxides and oxygenated volatile organic compounds being two striking examples. Unsurprisingly, there are several examples in the literature where erroneous conclusions were drawn from the level of agreement between measurements and models for OH because of key missing measurements which were not recognized at the time. These errors often only become evident when measurements are repeated at the same location with a more comprehensive set of model-constraining measurements.
More recently, measurements of the OH reactivity,  , have enabled a deeper understanding of the OH budget, as comparison with a model calculation allows direct examination of the degree of missing sinks in the model. OH reactivity measurements are now fairly routine, with several instruments worldwide based on three techniques used for the direct measurement of
  in both urban8,9 and forested environments,10–12,16–18 where significant missing sinks for OH have been reported. For example, in Toyko ∼50% of the OH sinks were not measured,9 whereas in the Amazon rainforest up to 70% of the measured reactivity could not be accounted for.16 A detailed model can be used to calculate the additional OH reactivity from (unmeasured) secondary products which are generated from the photo-oxidation of the measured primary VOCs. In one study, at Weybourne on the North Norfolk coast, this increased the OH reactivity by ∼10%, with most of the increase coming from unmeasured carbonyls.13 Although such an approach provides some clues as to the identity of the missing sinks, and helps to close the OH reactivity gap, it is only a model result and the identity of missing OH sinks is not confirmed directly. The atmosphere contains thousands of trace level VOCs, and as carbon number increases, it becomes ever more challenging to measure and identify these. Comprehensive two-dimensional chromatography (GC × GC) measurements with flame-ionisation detection (FID) provided compelling evidence in an urban environment that a significant fraction (∼40%) of OH sinks in the form of reactive carbon is not routinely measured by conventional equipment normally deployed during field intensives.19 This material is often multifunctional or contains more than 6 carbon atoms. Very recently, Kato et al.20 were able to quantify the OH reactivity of unidentified VOCs in Tokyo using an OH reactor connected to a gas chromatograph, and comparing how the peak areas changed for unidentified species in the chromatogram compared to identified species for which the rate coefficient for reaction with OH was known.
When OH reactivity and concentrations measurements are combined, eqn (E4) enables “measurement” of the total rate of OH production, with no assumptions other than that of the steady-state. This is a powerful tool, as comparisons can now be made with model calculations of the production rate of OH from co-measured species. Often this approach has shown that there are both missing sinks and missing sources, the balance of which controls the agreement of the model with [OH]. Recent examples are the identification of large missing sources of OH in regions influenced by high levels of biogenic VOCs, where the model, constrained by measurements of  and OH source terms, underpredicted [OH] by large factors.21,22 The description of instrumentation describing methods to measure OH reactivity is beyond the scope of this review, but further examples of the use of
  measurements will be given later in the review.
In this review, we examine local field measurements of OH and HO2 radicals, with a focus on comparisons that have been made with model calculations, and the level of agreement found. We concentrate on comparison with box model calculations of OH and HO2 which are highly constrained with co-measurements, and which contain a detailed chemical mechanism, rather than comparison with multi-dimensional models of OH which calculate regional and global distributions. Also, globally averaged OH concentrations, obtained indirectly through measurements of proxies such as methyl chloroform, are not considered. We acknowledge that measurements of concentration ratios of parent/daughter molecules provide an independent measurement of OH concentrations using a chemical clock-analysis, but in this review we focus on direct in situ measurements of OH and HO2 and comparisons with models.
Heard and Pilling23 comprehensively reviewed measurement techniques used for tropospheric OH and HO2 radicals, field campaigns using these techniques up until June 2003, and for selected campaigns the interpretation of these field measurements through comparison with model calculations.23 There has not been a comprehensive review of tropospheric OH and HO2 measurements since, although overviews of behaviour in certain environments have been made.24–26 In 2005 a workshop was held at Leeds under the auspices of ACCENT (Atmospheric Composition Change The European Network of Excellence) to discuss free-radicals in the troposphere,27 a significant component of which was concerned with OH and HO2, and two more recent ACCENT overviews of atmospheric composition change and its measurement have been published.25,26 Also, there are significant sections within a more recent book28 and review29 which have described methods for atmospheric detection of OH and HO2.
The review is organised as follows. In Section 2 the techniques used to measure OH and HO2 radicals in the field are briefly summarised. Unlike in Heard and Pilling,23 the intention is not to include an up to date description of the instrumentation currently used to measure OH and HO2. No new methods have emerged, indeed some methods have disappeared. Although closely related to HO2, we do not review methods to measure the sum of peroxy radicals, [HO2] + [ΣiRO2,i], nor describe field measurements and model comparisons for this quantity. Section 2 also describes updates on quality assurance procedures, for example calibration and instrument intercomparisons. Section 3 discusses potential interferences for OH and HO2 measurements which could lead to measurement biases and therefore errors in the interpretation of any differences observed with model calculations. Large discrepancies between measurements and models in low NOx, forested environments has indicated the need to consider possible instrumental artefacts caused by interfering species.30,31 Field campaigns and model comparisons are then reviewed for campaigns undertaken in the marine boundary layer (Section 4), low NOx, forested environments (Section 5) polluted environments (Section 6), and polar regions (Section 7), both from ground and airborne platforms. Each of Sections 4–7 contains its own summary, and in Section 8 there is an overall summary, and suggestions for future work.
Although the review is focussed upon comparison with models, no attempt is made to systematically compare the performance of different models. Mechanisms commonly in use for the interpretation and understanding of field measurements of OH and HO2 range from near-explicit mechanisms, such as the Master Chemical Mechanism (MCM),2,32–35 which contains ∼6700 species in approximately 17000 reactions (MCMv3.2), to reduced or lumped mechanisms such as the Regional Atmospheric Chemistry Mechanism (RACM),36 which contains 117 species in 375 reactions (v2). A perfectly valid question is: “Using the same input data of constrained measurements, does the calculated output of OH and HO2 radical concentrations differ in a significant manner from one model to another?” Unfortunately, unlike chemistry–climate models, for which the predictions are compared for the same emissions scenario (for example CCMVAL37) this question is rarely answered with respect to box models for OH or HO2, although there have been comparisons between the mechanisms commonly used in modelling studies.38 Another, related question is whether the conclusions of a given field study are still valid if new field measurements, or kinetic parameters, not previously available, were included to constrain the model? It is not easy to get funding for this type of activity, which looks at historical data sets with new, updated models, and which provides a check of the robustness of the previous conclusions. One example serves to illustrate this point. In the marine boundary layer, for example at Mace Head and on some Japanese Islands, earlier field measurements of HO2 were significantly overpredicted by models, which appeared to miss a significant sink.39–41 The main suggestion was to include reactive loss onto aerosols in the model with uptake coefficients that were large, approaching unity in some cases, in order to bring the model calculated values down sufficiently. At the time, experimental laboratory measurements of the uptake coefficients of HO2 radicals onto the surface of sub-micron aerosols, under relevant conditions (for example at low enough [HO2] that the self-reaction in the gas phase did not completely dominate), were not well enough defined to support this hypothesis or not. Recent measurements in the marine boundary layer using differential optical absorption spectroscopy (DOAS)42,43 and LIF44,45 have revealed the presence of significant concentrations of BrO and IO radicals, which if included in the model, bring the calculated [HO2] closer to the measurements, without requiring a large uptake coefficient. This finding is consistent with recent measurements of HO2 uptake coefficients which are much smaller.46,47 Another question regarding model input is whether the averaging time of a measurement used to constrain the model determines the OH concentration calculated by a model. Calculations have shown significant differences in calculated HOx concentrations for aircraft campaigns,48 depending on the averaging period of [NOx] that was used owing to the non-linear relationship between HOx and NOx. At high temporal resolution, NOx showed considerable variability along the flight track, with spikes at very high concentration.
2. Measurement of tropospheric OH and HO2 radicals: instrumentation, calibration, intercomparisons and interferences
The techniques of laser-induced fluorescence (LIF) spectroscopy at low-pressure, known as FAGE (Fluorescence Assay by Gas Expansion), and CIMS (Chemical Ionisation Mass Spectrometry, sometimes referred to as ion assisted mass spectrometry) remain the workhorses for the measurement of tropospheric OH radicals. FAGE detects OH directly, whereas in the CIMS method OH is first converted to H2SO4 which is then detected by mass spectrometry. HO2 is not detected directly by either technique, rather it is converted first to OH through the addition of NO to the ambient sampling inlet. For CIMS, the conversion chemistry takes place at atmospheric pressure, and so it is more difficult to prevent the simultaneous conversion of RO2 to OH, and typically [HO2] + [ΣiRO2,i] is measured, although through judicious control of the reagent gas flows, it is possible to measure HO2 separately.49,50 Differential Optical Absorption Spectroscopy (DOAS) has in the past successfully been used for field measurements of OH radicals, and although four independent instruments had been developed since the first use of DOAS in the 1980s,51–58 only the Forschungszentrum Julich instrument remains in service, but is only used within the SAPHIR (Simulation of Atmospheric PHotochemistry In a large Reaction Chamber) chamber,59,60 and not in the field. The absence of a DOAS instrument for OH measurements in the field is lamentable, as the method does not require calibration, only knowledge of fundamental molecular constants and the path length, and DOAS acts as a primary standard. However, as discussed in Section 2.3 below, the DOAS instrument is used within the SAPHIR chamber during intercomparisons, and continues to provide a critical standard to compare with other methods. The Matrix Isolation Electron Spin Resonance (MIESR) technique,61–63 which formerly provided the only direct method for the field measurement of HO2 in the troposphere, is no longer operated, and during its last measurements, was also located at the SAPHIR chamber.642.1. Instrumentation used to measure tropospheric OH and HO2 radicals in the field
Field measurements of tropospheric OH and HO2 radicals are extremely challenging, owing to their very low concentrations (OH ∼ 106 molecule cm−3; HO2 ∼ 108 molecule cm−3), high reactivity and subsequent short lifetime (τ(OH) ∼ 0.01–1 s; τ(HO2) ∼ 5–100 s), and their rapid loss rate onto surfaces of inlets. The FAGE and CIMS techniques, and their historical development, have been described in considerable detail before (for representative references see Heard and Pilling23 and Heard65), and have enjoyed sustained success for field measurement of local OH and HO2.In the FAGE technique, OH radicals are measured by 308 nm laser-induced fluorescence (LIF) spectroscopy at low pressure and HO2 is first converted to OH by the addition of NO prior to FAGE detection of the OH formed. Simultaneous measurements are possible via two independent detection cells, which depending on the design are either in series with a single sampling pinhole and the OH fluorescence cell closer to the sampling nozzle, or in parallel with two independent sampling pinholes, and allowing a different pressure in each cell. Delayed gated photon counting is used to detect fluorescence from OH and to discriminate from the more intense scattered light. Two types of high pulse-repetition frequency (prf) laser system are currently used in the field, either a Nd:YAG pumped dye-laser, which is frequency doubled to generate 308 nm, or an all solid state Nd:YAG pumped titanium sapphire laser, which is frequency tripled to generate 308 nm. High prf copper vapour lasers are no longer used in the field as a pump laser, although the EUPHORE chamber in Valencia is still equipped with a copper vapour laser pumped dye laser system.66,67 A typical detection limit for the FAGE technique is (2–5) × 105 and (5–10) × 105 molecule cm−3 for OH and HO2, respectively, depending on the individual instrument, averaging period and reported signal-to-noise ratio, with a typical (1σ) accuracy of ∼20–30%.23 Field measurements using FAGE of OH, HO2 and/or OH reactivity are currently being made by groups at the University of Leeds,12,68–70 Pennsylvania State University,71,72 Forschungszentrum Julich,73–75 the Max Planck Institute for Chemistry at Mainz,76 University of Indiana,77,78 Frontier Research Centre for Global Change,79–81 Tokyo Metropolitan University82,83 and Lille,84 and other groups have instruments in development. FAGE instruments for measurement of OH and HO2 radicals close to ambient concentrations are also operated at the EUPHORE,67,85 SAPHIR59,60,64 and HIRAC86,87 chambers.
In a new development, Dlugi et al.88 recently reported the first flux measurements of OH and HO2 using FAGE, above the canopy of a forest. Given the short lifetime for OH, its flux is not directly determined by its transport, rather it is driven by compositional changes induced by small eddy transport of biogenic VOCs. Another recent innovation is the development of the ROxLIF method, which is an extension of FAGE enabling HO2 and the sum of organic peroxy radicals to be measured separately,89 and with good sensitivity (∼0.1 pptv detection limit in ∼1 minute). HO2 and the sum of RO2 has also been measured separately using a CIMS detection method to measure OH via H2SO4 formation.50,90 Although upon addition of NO, conversion of RO2 to RO is rapid (OH in the case of HO2), in a normal FAGE fluorescence cell, where the pressure is typically between 0.6–4 Torr, the rate of the reaction:
| RO + O2 → R′CHO + HO2 | (R17) |
In the CIMS (or ion assisted mass spectrometry) technique, OH is converted quantitatively to H234SO4 by the following reactions:
| OH + 34SO2 + M → H34SO3 + M | (R18) |
| H34SO3 + O2 → 34SO3 + HO2 | (R19) |
| 34SO3 + H2O + M → H234SO4 + M | (R20) |
| NO3−·HNO3 + H234SO4 → H34SO4−·HNO3 + HNO3 | (R21) |
2.2. Quality assurance: instrument calibration
There remains only one method used in the field for the calibration of FAGE and CIMS instruments at concentrations close to those found in the troposphere. This method relies on the photolysis of water vapour at 184.9 nm using a mercury lamp, which in the presence of air generates equal concentrations of OH and HO2, given by:| [OH] = [HO2] = [H2O]σH2O,184.9nmϕOHF184.9nmt | (E7) |
One assumption made in this method is that the hydrogen atom co-product of OH following 184.9 nm photolysis of water vapour is rapidly relaxed by collisions (it is formed with considerable translational energy) and reacts exclusively with O2 (the calibrations are usually done in air) in the presence of the third body to form HO2 radicals. Alternative, exothermic fates of the initially excited H atoms are reaction with water vapour or O2 to form OH. If this occurred to any extent, then the concentration of OH and HO2 would not be equal following photolysis, which is a key assumption in the calibration. In one experiment Fuchs et al.91 added sufficient CO to quickly convert any OH produced from the photolysis of water vapour ((R3) above), and any OH produced from subsequent reactions of H atoms, into HO2 radicals. The measured LIF signal from HO2 represents the sum of OH and HO2 radicals generated, and this calibration method has an HO2 yield of two, independent of whether OH is made by any reactions of hot H atoms or not. In a second experiment CD4 was added as a scavenger to quickly remove any OH from the calibration gas:
| OH + CD4 + O2 → CD3O2 + HDO | (R22) |
All groups active in field measurements of OH and HO2 continue to rely on the vacuum ultraviolet photolysis of water vapour to calibrate their instruments, and although there is currently no evidence that there is a bias or other problem with this method, it is a concern that reliance for all absolute concentrations is given to a single method. Intercomparisons with the DOAS method, which does not rely on a calibration (only needing knowledge of spectroscopic constants which are well established in the laboratory, and the path length), either in the field103 or in chambers,59,60 provides confidence in the calibration method (more details of recent work is given in Section 3.2 below). Indirect calibration has been achieved using the decay of a hydrocarbon for which the rate coefficient kOH+HC is well established in the literature, with [HC] measured using GC-FID as function of time to give:
 | (E8) |
The calibration of instruments as a function of ambient pressure, which varies during the operation of aircraft measurements, is difficult to achieve. Some groups have developed an in flight calibration system for OH,76,107 whereas others rely on a transfer standard in flight (for example Raman scattered light from N272), and an absolute calibration is performed on the ground pre- and post-campaign using the 185 nm water vapour photolysis technique at atmospheric pressure, but using sampling pinholes of different diameters to reproduce the necessary pressure within the FAGE fluorescence cell.69,72 The assumption is made that OH losses through pinholes of different diameters is the same, and that the sensitivity of the instrument depends only on the pressure within the fluorescence cell and not on the ratio of external to internal pressures. It is difficult to test this assumption using the HC decay method above, as most chambers equipped with OH instruments are made or Teflon or similar material and hence cannot be evacuated. The Leeds HIRAC (Highly Instrumented Reactor for Atmospheric Chemistry) chamber86 is constructed of stainless steel, and has been used to generate OH radicals close to ambient concentrations at total pressures between 220–760 Torr. In preliminary experiments, OH concentrations determined using the decay of a hydrocarbon (eqn (E8)) at different total pressures agreed well with concentrations measured by a FAGE instrument previously calibrated by the water vapour photolysis method at atmospheric pressure but using a range of sampling pinholes of different diameters to reproduce the necessary pressure within the fluorescence cell.87 Another method of generating OH at ambient concentrations at atmospheric pressure is via the reaction of ozone with alkenes with a known yield of OH.87 This method is not currently used in the field but has been compared with FAGE-measured OH in a chamber.87
For HO2, observing the rate of HO2 decay from the second order self-reaction, and knowledge of the rate coefficient and any wall loss, kloss enables [HO2] to be determined from solution of the following differential equation:
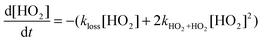 | (E9) |
2.3. Quality assurance: intercomparisons
Confidence in a field measurement is increased if the same result can be obtained with two or more instruments that utilise independent methodologies whilst sampling at the same location. Intercomparisons have been crucial for the development of techniques for the atmospheric detection of the OH radical, on account of the early problems with its atmospheric detection using LIF spectroscopy, when signals were almost entirely due to laser-generated artefacts.23 Intercomparisons between different field instruments measuring OH and/or HO2 radicals are still uncommon, but represent one of the best quality control mechanisms to probe any differences in instrument behaviour, calibration and susceptibility towards interferences. Intercomparisons up to 2003, for example the ground-based TOHPE (1993) and POPCORN (1994) field campaigns, and the aircraft-based PEM Tropics B (1999) and TRACE-P (2001) campaigns, were reviewed by Heard and Pilling.23The SAPHIR chamber in Julich is a highly-instrumented chamber equipped with the only operating long-path DOAS instrument with the capability of measuring atmospheric levels of OH. As DOAS requires no calibration, merely knowledge of the absorption cross-sections at the relevant temperature and pressure and the path length, it provides an absolute standard for OH. The HOxComp campaign, performed in 2005,64,108 provided both an out of chamber (ambient) and an in chamber formal-blind intercomparison for both OH and HO2. One DOAS (in SAPHIR chamber only), 3 FAGE and 1 CIMS instruments from Germany and Japan were involved, and followed on from a successful previous OH intercomparison at SAPHIR involving just the Julich group.59 For OH, the agreement is in general very good over a range of different levels of humidity, O3, NO2, and radiation (including under dark conditions) with gradients of the correlation plots ranging from 1.01–1.13. A CIMS instrument also participated in the ambient phase of the intercomparison, together with 3 FAGE instruments, and correlation gradients of 1.06–1.69 were observed, which were sometimes outside the combined uncertainty limits. Fig. 4 shows examples of ambient and chamber-based correlation plots of OH recorded during HOxComp. A discussion of the agreement with models during HOxComp is reviewed in Section 6.2 below.
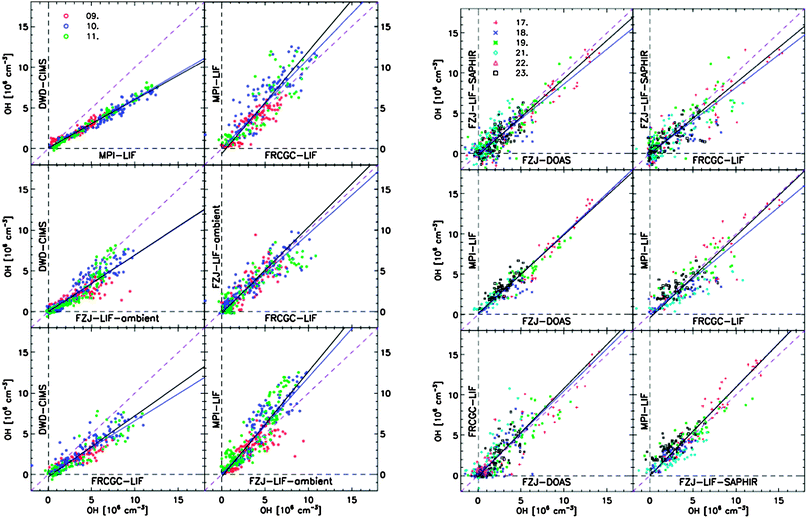 | ||
| Fig. 4 Linear regressions to ambient (Left) and chamber (Right) OH concentrations (averaged to 300 s) with best-fit slopes represented by solid black and blue (forced through the origin) lines. Dashed line represents a slope of one. (Reproduced from ref. 60, Copyright (2009), with permission from Copernicus Publications.) | ||
Three FAGE instruments employing NO induced HO2 → OH conversion participated in an HO2 intercomparison during HOxComp, and here the agreement between instruments was more variable, with correlation slopes between 0.69 to 1.26 in the chamber and sometimes higher for ambient.64 The agreement in the chamber was a function of the particular experiment, with better correlations when grouped by water vapour. There is an unknown factor related to water vapour which appears to give a bias for some instruments.64Fig. 5 shows examples of ambient and chamber-based correlation plots of HO2 recorded during HOxComp. An intercomparison between ROxLIF and the matrix isolation electron spin resonance (MIESR) technique for both HO2 and the sum of organic RO2 gave good agreement, with correlation slopes of 0.98 and 1.02, respectively.91 An older field intercomparison between a PerCIMS and FAGE instrument for HO2 also gave agreement within 40%.109
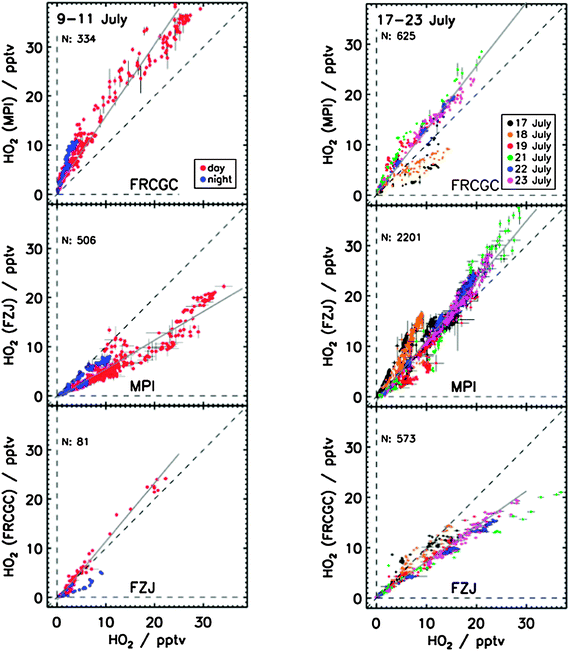 | ||
| Fig. 5 Correlation of HO2 mixing ratios in ambient (Left) and SAPHIR chamber (Right) experiments (averaged to 1 min). The solid lines show the results of the linear fits (daytime only for the ambient data), whilst the dashed line represents a slope of one. (Reproduced from ref. 64, Copyright (2010), with permission from Copernicus Publications.) | ||
3. Potential interferences in OH and HO2 measurements
In the early days of LIF detection of tropospheric OH, measurements were performed at atmospheric pressure using an off-resonant scheme, with OH excited at 282 nm to the vibrationally excited A2Σ+, v′ = 1 level, and fluorescence collected at longer wavelengths (305–311 nm). Although this excitation scheme offered significant advantages to the on-resonant scheme, it was plagued with a large interference (swamping ambient OH signals) from the photolysis of ozone at 282 nm with subsequent production of OH from the reaction of O(1D) atoms with water vapour.23 Following several developments, current LIF instruments use low pressures (FAGE) and on-resonant 308 nm excitation, and are much less subject to this interference. Earlier laboratory work reported in Ren et al.,110 and confirmed by others, showed no significant interferences for a limited range of species during the detection of both OH and HO2. In low NOx, forested environments, recent measurements of OH and HO2, and comparisons with model calculations, as described in Section 5 below, have shown significant model underpredictions and raised questions about our understanding of the chemistry in this environment. There are intense efforts to try to understand the deficiency in our understanding, but a solution that is consistent with all the available data has not been found. An alternative explanation to the reported model underpredictions in these environments is the presence of a systematic bias in the OH and HO2 measurements, all of which have been taken with FAGE instruments. We describe below some recent work which suggests there may be interferences for both OH and HO2 for FAGE instruments operating under certain conditions in these types of environments.3.1. HO2 interferences using FAGE
Until recently it was assumed that higher peroxy radicals (RO2) did not act as an HO2 interference in FAGE because although these species also react with NO to form an alkoxy radical (RO) at 1 Torr, the subsequent reaction RO + O2 to give HO2 is too slow. However, recent studies30,111 have revealed that alkene-derived RO2 radicals, longer chain alkane-derived RO2 (>C3) and also RO2 from aromatic species can be converted to HO2 in the presence of NO in a FAGE detection cell. Actually, this is not a surprise, as the yields of HO2 from these reactions, if permitted to proceed to completion, are well known and included in the MCM.2 The interference will only be significant for field reported concentrations of HO2 if the experimental configuration of the FAGE instrument being used is conducive to any conversion of RO2 into HO2 in the presence of NO. The percentage conversion of RO2 to HO2 will be influenced by a number of experimental variables which vary considerably between different field instruments. These include the fluorescence cell pressure, the residence time of the sampled air in the fluorescence cell prior to laser excitation of OH (related to the pumping speed and geometry of the cell), the concentration of NO added to convert HO2, details of the supersonic expansion which will determine the degree of mixing of NO into the ambient jet, the proximity of the walls to the sampled flow, and the volume from which fluorescence is imaged on the detector (factors determining this include whether a single or multi-pass cell is used). Fuchs et al.30 demonstrated that by changing the inlet configuration of the FAGE cell (diameter of the sampling pinhole which changed the sample flow rate and hence the conversion reaction time), the interference changed considerably. For example, for RO2 derived from ethene, the relative detection sensitivity compared with HO2 was 0.95 for an inlet orifice diameter of 0.4 mm (2.7 ms conversion time), changing to 0.17 for a 0.2 mm sampling orifice (0.18 ms conversion time). Similar changes were observed for other alkene-related RO2 species, e.g. for isoprene RO2. Furthermore, the degree of interference could be reduced using a lower concentration of NO in the cell,30 as predicted using the MCM. Work-in-progress in other laboratories is giving similar results.111 Equipped with knowledge of this interference for HO2 and the controlling parameters, it will be possible for FAGE groups to design the configuration and geometry of their sampling systems and fluorescence cells to minimise interferences from RO2.It is possible to provide a correction and account for the additional HO2 concentration that derives from RO2 radicals, using the following expression:112
| [HO2*] = [HO2] + Σi(αRO2,i × [RO2]i) | (E10) |
3.2. OH interferences using FAGE
Early experiments performed in the laboratory by Ren et al.110 reported negligible interferences for the detection of OH for a range of species, including H2O2, SO2, HONO, HCHO and a range of VOCs with different functional groups (alkanes, alkenes, alcohols, including isoprene). A small OH interference scaling with ozone and water vapour was observed, as reported by some other groups (possibly heterogeneous in origin) but which can be corrected for. The usual method to determine the background signal in a FAGE instrument is to exploit the narrow spectral profile of a single rotational transition of OH, and move the laser wavelength away from the OH line and measure the sum of solar, cell-induced and Mie scattered light. However, in the recent BEARPEX (Biosphere Effects on Aerosols and Photochemistry Experiment) study in a California forest using a FAGE instrument31 an alternative method to determine the background, which does not involve changing the laser wavelength, was used. C3F6 was injected into the sampled ambient air stream to remove ambient OH before it enters the instrument. Any remaining signal is the background, although a complication was that the addition of C3F6 just outside the sampling inlet also removed some of the additional OH generated inside the cell. The background using this method was considerably higher than using the spectral method,31 and showed that the additional background was due to OH radicals. It was postulated that OH was generated within the instrument from oxidation of an unidentified biogenic VOC. Evidence was provided to rule out laser-generation of OH within the cell. Allowing for this increased background gave measured OH concentrations that were ∼40–50% of those determined using the spectral background method, and which agreed better with the calculations of a constrained box model.31The field site was within a Ponderosa pine plantation, and a key question is whether this type of interference has been seen previously by this and other FAGE instruments operating in other forested environments. For HO2, the degree of interference was shown to be dependent upon instrument design,30 and the same may be true for any potential OH interferences. A recent experiment utilising the SAPHIR chamber has compared OH concentrations measured by DOAS and FAGE under conditions of low NOx and in which significant concentrations of isoprene, methyl vinyl ketone (MVK), methacrolein (MACR) and aromatic compounds were added and photochemically oxidised.113 Conditions were chosen to replicate those in the PRIDE-PRD campaign in China where significantly higher OH concentrations were measured than model calculations.22 Over the entire set of experiments over 20 days, the linear regression of OH concentrations measured by FAGE compared to DOAS gave a slope of 1.02 ± 0.01 and an intercept of (1.0 ± 0.3) × 105 molecule cm−3. However, FAGE measurements were approximately 30–40% larger than those by DOAS after MVK and toluene had been added, although this discrepancy has large associated uncertainties and requires further laboratory investigation. These results support the validity of this FAGE measurement of OH in the presence of these biogenic VOCs under the specific conditions of these experiments.
3.3. Interferences for CIMS instruments
CIMS is a less direct method for the detection of OH owing to several chemical conversion steps. Reactions competing with the reaction of SO3 with H2O vapour (R19), influences of H2O vapour on the ion molecule chemistry involving NO3−/HNO3/H2SO4 and potential wall losses of radicals have all been experimentally studied.114 Excess propane is periodically added at the inlet (at the same injection point where SO2 is added) in order to rapidly remove ambient OH (on a timescale that is much shorter than removal by SO2) and enables a background signal to be determined. Also, the chemistry which generates H2SO4 from OH generates HO2 in reaction (R19), and this together with any HO2 present in the ambient sample (typically HO2 is 10–100 times more abundant than OH), could be recycled to OH, for example by reaction with NO or O3 and lead to a positive bias for OH.94,115 Any such OH produced by recycling from HO2 (or indeed from any other mechanism) is prevented from reacting with SO2 (and hence being detected) through removal by the addition of excess propane downstream of the injection position for SO2 (sufficiently downstream so that all ambient OH reacts with SO2 before it encounters propane). However, any species which can oxidise SO2 to SO3, but which is not removed by reaction with propane, will be detected as H2SO4, and will cause a positive bias to the OH measurements. Recently, Welz et al.116 showed that the simplest Criegee intermediate, CH2OO, reacts quickly with SO2, and hence this is one candidate to give such an interference.A negative bias in the measured OH concentration could result from species present in ambient air reacting with OH once the air has been sampled by the CIMS inlet but before the SO2 injection point, as these species will not be present in the calibration gas. As the transit time is short compared with the atmospheric lifetime of OH, only a small fraction of the OH would be lost in this way, although this assumption may not be true if the OH reactivity is very high.
4. Studies in the marine boundary layer
4.1. Ground based field campaigns
The marine boundary layer (MBL) represents a significant proportion of the atmospheric boundary layer, and is largely characterised by clean air with low concentrations of reactive NMHCs and VOCs and little or no influence from anthropogenic activities. Investigation of the marine boundary layer therefore provides an opportunity to examine the chemistry of the ‘natural’ atmosphere. Field measurements made in the MBL cover those made at coastal sites, which constitute the majority of MBL studies, and those made over the open ocean (ship and aircraft measurements) and on the ground in remote regions relatively isolated from coastal interferences.We present here an overview of measurements of OH and HO2 in marine regions, concentrating on those for which model comparisons have been made. A summary of these measurements and model comparisons at ground level is given in Table 1.
| Campaign | Year | Dates | Location | Platform | Technique | OH measured | HO2 measured | Comments | Ref. |
|---|---|---|---|---|---|---|---|---|---|
| WAOSE95 | 1995 | June | Weybourne, UK, 53° N, 1° E | Ground | DOAS | 4–6 × 10⁶ molecule cm−3 at noon | — | Model agreement within 50% but not systematic, and with r2 = 0.0002 | 117–119 |
| ALBATROSS | 1996 | October–November | North and South Atlantic, 68° N–50° S | Ship | DOAS | Maximum of 7 × 10⁶ molecule cm−3 | — | Overestimated OH by 16% | 121 |
| EASE96 | 1996 | July–August | Mace Head, Ireland, 53° N, 10° W | Ground | LIF | Mean 3.3 × 10⁶ molecule cm−3 | 1.1–2.6 × 10⁸ molecule cm−3 | OH overestimated by ∼40%; tendency for overestimation of HO2 | 124, 125, 319 |
| EASE97 | 1997 | April–May | Mace Head, Ireland, 53 °N, 10 °W | Ground | LIF | Mean 2.11 × 10⁶ molecule cm−3 | Mean 0.71 × 10⁸ molecule cm−3 | OH mean modelled to observed ratio of 2.4 around noon (1100–1500 hours); mean noontime ratio of 3.6 for HO2, with a ratio of 4.5 in polluted air | 39, 123 |
| OKIPEX | 1998 | July–August | Oki Dogo Island, Japan, 36° N, 133° E | Ground | LIF | Below the instrumental limit of detection (0.8 pptv) | Maximum of 9 pptv in the early afternoon | HO2 overestimated by 44% on average | 40, 80 |
| ORION99 | 1999 | August | Cape Hedo, Okinawa Island, Japan, 27° N, 128° E | Ground | LIF | Mean noontime ∼ 4 × 10⁶ molecule cm−3 | Mean noontime 17 pptv; nighttime 0.5–5.5 pptv | HO2 underpredicted by ∼20% during the day; nighttime underestimation by a factor of 4 | 41, 80, 138, 139 |
| PARFORCE | 1999 | June | Mace Head, Ireland, 53° N, 10° W | Ground | CIMS | Mean 1 × 10⁶ molecule cm−3 | — | OH overestimated | 129 |
| SOAPEX | 1999 | January–February | Cape Grim, Tasmania, 41° S, 142° E | Ground | LIF | 3.5 × 10⁶ molecule cm−3 average maximum | 2 × 10⁸ molecule cm−3 average maximum | OH overestimated by 10–20%; HO2 overestimated by ∼40% | 132, 133 |
| RISOTTO | 2000 | June | Rishiri Island, Japan, 45° N, 141° E | Ground | LIF | ∼10 pptv at midday; mean nighttime concentration of 4.2 pptv | OH overestimated by ∼36%; HO2 overestimated by ∼70%, requiring 25 pptv IO to reconcile model with observations | 6, 80, 140 | |
| MINOS | 2001 | August | Crete, 35° N, 26° E | Ground | CIMS | Mean (4.5 ± 1.1) × 106 molecule cm−3 | — | Similar dependence of modelled and observed OH on j(O1D) | 136, 137 |
| NAMBLEX | 2002 | July–September | Mace Head, Ireland, 53° N, 10° W | Ground | LIF | 3–8 × 10⁶ molecule cm−3 at noon | 0.9–2.1 × 10⁸ molecule cm−3 at noon; 2–3 × 10⁷ molecule cm−3 at night | Modelled OH within 25% of observations; HO2 overestimated by a factor of up to 2 | 3–5, 152, 153 |
| RISFEX | 2003 | September | Rishiri Island, Japan, 45° N, 141° E | Ground | LIF | Maximum 2.7 × 10⁶ molecule cm−3 | Daytime maximum of 5.9 pptv | 7, 141 | |
| RHaMBLe | 2007 | May–June | Cape Verde, Atlantic Ocean, 17° N, 25° W | Ground | LIF | Midday maximum of 9 × 10⁶ molecule cm−3 | Midday maximum of 6 × 10⁸ molecule cm−3 | Model reproduced OH and HO2 on inclusion of halogen chemistry and aerosol uptake for HO2 | 70, 156 |
| OOMPH | 2007 | March | Atlantic Ocean, 28–57° S, 46° W–34° E | Ship | LIF | Peak value of 6 × 10⁶ molecule cm−3 | Peak value of 15 pptv | Steady state calculations in good agreement with observations | 320 |
| DOMINO | 2008 | November–December | El Arenosillo, southern Spain, 37° N, 7° W | Ground | LIF | Maximum ∼0.16 pptv in continental air; ∼0.10 pptv in air masses originating over the ocean | Maximum ∼6 pptv in continental air; factor of two lower in air masses originating over the ocean | Significant interferences reported in OH (potentially up to 60% between 1000 and 1500 hours) | 158, 159 |
| SOS | 2009 | February–March; June; September | Cape Verde, Atlantic Ocean, 17° N, 25° W | Ground | LIF | Midday maximum of 9 × 10⁶ molecule cm−3 | Midday maximum of 4 × 10⁸ molecule cm−3, ∼107 molecule cm−3 at night | Concentrations in summer (June, September) almost double those observed in winter (Feb, March) | 15, 157 |
Among the earliest measurements of OH made in the marine boundary layer were those made during the WAOSE95 (Weybourne Atmospheric Observatory Summer Experiment 1995) project in June 1995 at the Weybourne Atmospheric Observatory situated 100 m from the North Norfolk coast in the UK.117–119 The campaign aimed to conduct the first full study of the diurnal oxidising capacity of the troposphere by measuring OH, RO2 and NO3 radicals, and represented the first field measurements of OH in the UK, and at the time one of only few in the MBL.117,118
Observations of OH were made using a laser multipass optical absorption spectrometer (MOAS) over an eight day period, with average observed noontime OH concentrations of 4–7 × 10⁶ molecule cm−3 with a detection limit of 3–5 × 10⁵ molecule cm−3. However, the maximum OH concentrations (6 × 10⁶ molecule cm−3 to 1 × 10⁷ molecule cm−3) were observed in the afternoon, indicating the importance of production processes other than ozone photolysis.118
Grenfell et al. (1999)119 used a photochemical box model and steady state calculations to make comparisons with the OH measurements made during WAOSE95. The box model, constrained to observations, contained 95 VOCs in 900 thermal reactions and 31 photolysis reactions. Agreement within 50% of the measured OH was reported for much of the campaign, with no systematic overestimation by the model, although discrepancies up to a factor of 3 were occasionally apparent and the overall r2 value between modelled and observed concentrations was only 0.0002.119
Major sources of OH were found to be O(1D) + H2O, HO2 + NO and photolysis of HONO, while the major sinks were NO2, CO, CH4 and NMHCs, with the NMHCs the largest cumulative sink. Discrepancies between the model and the observations were attributed to a lack of information regarding CO and fast-reacting NMHCs on two days, resulting in the use of typical campaign values in the model, and on high molecular mass NMHCs throughout the campaign.118,119 In addition, the model overestimated HONO during the day, and underestimated it at night, which may have impacted the simulations for OH.119 Unstable meteorological conditions on three days of the campaign, causing rapid changes in cloud cover and windfield, may have had the result that photochemical equilibrium was not truly achieved.119
While PERCA (PERoxy radical Chemical Amplifier) measurements of RO2 were made during the campaign,119,120 no separate measurement of HO2 was made, precluding a more complete model comparison. Grenfell et al. (1999)119 concluded that more information was required regarding high mass NMHCs and that a diurnal HO2 measurement would prove instructive.
Measurements of OH were also made during the ALBATROSS (air chemistry and lidar studies of tropospheric and stratospheric species) ship campaign in the Atlantic Ocean during October and November 1996 using the DOAS technique, with a linear fit of OH measurements to j(O1D) displaying a correlation coefficient of r = 0.75.121 A box model containing a simple chemistry scheme containing only 27 reactions and using measured concentrations of NO, HCHO, H2O2, CH3OOH, CO, O3 and CH4 to initialise the model, with no other NMHCs or VOCs, was able to reproduce the OH observations in this clean environment with only a 16% overestimation (r = 0.72).121
The use of LIF-FAGE to measure OH and HO2 radicals enabled the observation of the diurnal profiles of OH and HO2 in the marine boundary layer during the Eastern Atlantic Summer Experiments (EASE96, July–August 1996, and EASE97, April–May 1997) in Mace Head, Ireland.68,122,123 Modelling of OH and HO2 during both EASE96124,125 and EASE97126 was conducted using an observationally constrained box model based on the MCM with an additional description of DMS chemistry.127,128
For EASE96, model calculations for OH tended to overestimate the observations by approximately 40%, although it was noted that this was within the combined uncertainties of the measurements (±75%, 2σ) and model (±31%, 2σ). For HO2, the model reproduced the observations well on one day, but not on another, with a general tendency towards overestimation. Increased loss of HO2 to aerosol, investigated in a sensitivity study in which the aerosol uptake coefficient for HO2 (γHO2) was set to its maximum theoretical value (γHO2 = 1), could not explain the difference between the observed and modelled HO2.124 It should be noted that no halogen chemistry was included in the model owing to the lack of measurements of IO, BrO or I2, whereas subsequent studies at Mace Head demonstrated a significant perturbation to HO2 concentrations.4
Greater overlap between HOx observations and supporting measurements during EASE97 permitted a more detailed modelling study than that possible for EASE96.124,126 The modelled concentrations for OH during EASE97 exceeded the observations for almost all data points, with a mean modelled to observed OH ratio of 2.4 between 1100 and 1500 hours. Similarly, model overpredictions were also found for OH observations made by a CIMS instrument at Mace Head during the PARFORCE campaign in June 1999, and were most significant at noon and at low tide and during new particle formation events.129
For HO2 during EASE97, the agreement was generally worse than for OH, with a mean modelled to observed ratio of 3.6 between 1100 and 1500 hours, and reaching a ratio of 4.5 for polluted air masses originating from the mainland UK. An increase in the HO2 aerosol uptake coefficient to its maximum value gave a decrease of only 37% in the modelled HO2. Agreement for the sum of peroxy radicals (HO2 + ΣRO2), measured by the PERCA technique,130,131 was much better than for OH or HO2, with a mean modelled to observed ratio of 0.9.126
Based on back trajectory calculations, the air masses encountered at Mace Head during EASE97 could be split into three categories – European continental air, polar air and UK air. For air masses of European origin it was found that a greater fraction of OH production resulted from ozone photolysis compared to polar or UK air, with photolysis of HCHO more important for UK air than for the other air masses, and represented over a third of the total radical production rate for UK air masses. Loss of HOx in polar air masses was dominated by radical–radical reactions, the reaction between OH and NO2 was the major radical sink in air of UK origin. European continental air masses showed significant radical losses resulting from both radical–radical reactions and OH + NO2.126
Conditions more indicative of the open ocean, and therefore free from anthropogenic emissions, were observed during the second Southern Ocean Photochemistry Experiment (SOAPEX-2) in 1999 at the Cape Grim Baseline Air Pollution Station in northwest Tasmania.132,133 Measurements of OH and HO2 were made using LIF-FAGE132 over a 4 week period during the austral summer, in conjunction with a number of supporting measurements. Air masses at the measurement site originated from the Australian continent, Tasmania and Southern Ocean/Antarctic regions, with the Southern Ocean/Antarctic air characterised by NO mixing ratios less than 3 pptv and considered to be ‘baseline’ air.132,133
High correlations (r = 0.95) between the OH concentration and rate of OH production from ozone photolysis were found for baseline air, with a simple steady state expression for OH, based on production from ozone and loss through reaction with CO and methane, giving an overestimation of OH of only 20%.132 OH concentrations were also calculated for baseline conditions in a more detailed modelling study using a chemistry scheme based on the MCM and constrained to VOC measurements.133 This study gave a 10 to 20% overestimate for OH, and indicated that 95% of the OH loss could be attributed to CO and methane. A simpler model using only MCM chemistry for CO and methane degradation differed from that using MCM chemistry for the 17 other VOCs by only 5 to 10%.133
While the major source of OH was found to be ozone photolysis, photolysis of formaldehyde represented a significant source of HO2, contributing 30% of the total rate of HO2 production.133 However, measured formaldehyde concentrations could not be accounted for by methane oxidation chemistry, and modelled concentrations of HO2 tended to overestimate the observations by approximately 40% using the full chemistry scheme, although at dawn and dusk HO2 observations were a factor of two higher than the model.133 Once again, reaction with BrO and IO was not considered in the model, although upto ∼1 pptv of IO was measured by DOAS close to the site.134
Radical loss reactions were almost exclusively HO2 + HO2 and HO2 + CH3O2, although the modelled HO2 was found to be highly sensitive to aerosol uptake and significant improvements could be made to the daytime overestimate by increasing the aerosol uptake coefficient or the aerosol surface area133 and by improved treatment of aerosol uptake processes.135 Since the NO concentrations were so low, increasing the HO2 loss to aerosol had a negligible effect on the modelled OH.133
The dominance of CO and CH4 in controlling OH concentrations in the MBL was also observed during the MINOS (Mediterranean INtensive Oxidant Study) campaign on the northeastern coast of Crete in August 2001.136,137 During the campaign, OH concentrations were measured by a CIMS instrument, and reached a maximum of 2 × 10⁷ molecule cm−3 (some of the highest concentrations ever reported in the troposphere), with a campaign mean of (4.5 ± 1.1) × 106 molecule cm−3.136 A box model based on CO and CH4 chemistry was used to interpret the measurements by comparing the dependence of the observed and modelled OH on j(O1D), with similar results found for the measurements and the model.136
A series of experiments have also been conducted at remote coastal sites around Japan, with measurements made on Oki Dogo Island in July/August 1998,40,80 Okinawa Island in July/August 1999,41,80,138,139 and Rishiri Island in June 20006,140 and September 2003.7,141 Although the experiments were conducted at similar times of year, the latitudinal range of the measurements resulted in variations in photolysis rates and VOC emissions, enabling investigation of HOx chemistry under different conditions.
Measurements of OH and HO2 were made by LIF-FAGE.40,79 Mixing ratios of OH at Oki Island in summer 1998, during the OKIPEX campaign, were below the instrumental limit of detection of ∼4 × 10⁶ molecule cm−3 for a 1 min integration time.40,79 On average, HO2 reached a maximum mixing ratio of 9 pptv in the early afternoon throughout the campaign.40 The measurement site was situated 65 km from mainland Japan, with limited influence of anthropogenic activities apart from local fishing, although pine and low deciduous forests were within 50 m of the site, resulting in high midday isoprene concentrations. NO2 mixing ratios during the campaign typically peaked at 0800 h at ∼2.5 ppbv, decreasing to below 500 pptv at midday, while NO mixing ratios typically peaked at around 700 pptv at 0900 hours and were less than 100 pptv at midday. Compared to the Weybourne and Mace Head measurement campaigns, water vapour concentrations were on average a factor of 2 higher at Oki Island owing to higher temperatures.40
Model calculations of HO2 were made using a box model based on the Regional Atmospheric Chemistry Mechanism (RACM), comprising 77 species and 237 reactions.36,40,80 For the majority of the campaign, the model overestimated the HO2 observations by an average of 44%, with a slight underprediction on one afternoon and good agreement between the model and observations on one day. The underprediction could be rectified by an additional HO2 source from ozonolysis of monoterpenes, but no monoterpene measurements were available for the campaign and it is unclear how this would impact the overestimation of HO2 observed at other times.
The model overestimate for HO2 displayed some diurnal variation, with the greatest discrepancies observed around midday. A reduction in the rate of primary HOx production following ozone photolysis was considered as a possible source of the overestimate, but a reduction in j(O1D) by a factor of 1.5 led to a reduction in the modelled concentration of HO2 at midday by only 20%. Missing loss processes for both OH and HO2 were considered by Kanaya et al.,40 but additional loss processes acting on OH required more than 10 ppbv of an unknown hydrocarbon in order to reproduce the observed HO2 concentrations and the authors concluded that additional loss processes acting directly on HO2 would be the more likely cause of the model discrepancy. Later studies demonstrated the importance of IO as a sink for HO2 at a similar site.6
The extent of the discrepancy was observed to show some correlation with water vapour and glyoxal, with correlation coefficients of r = 0.46 and r = 0.73 respectively.40 The authors40 postulated a possible acceleration of HO2 reaction rates as a result of HO2 complexation with water vapour, as is known to occur for the HO2 self-reaction (e.g.ref. 142–144), and questioned the role of water vapour in the loss of HO2 to aerosols. Reactions between HO2 and carbonyl compounds, such as glyoxal and formaldehyde, were also considered as possible sources of the model overestimation. The authors40 recommended further laboratory investigation into HO2 + carbonyl kinetics, HO2 uptake coefficients on tropospheric aerosols and the role of water vapour in HO2 chemistry. Measurements of aerosols and carbonyl compounds were also recommended in future field campaigns.
In contrast to the work in Oki Island, observations of HO2 at Cape Hedo on Okinawa Island in 1999 as part of the ORION99 (Observations at a Remote Island of Okinawa 1999) campaign were typically underpredicted by approximately 20% using steady state and RACM models without including any heterogeneous chemistry.41,138 The model underestimations were generally more apparent in the morning, potentially resulting from a model underestimation of HONO, and hence its photolysis to produce HOx.138 Differences between the steady state and RACM models for ORION99 were attributed to the effects of oxygenated species on HO2 which were included in the RACM model but not in the steady state calculations.41
Similarly to the Oki Island experiments, rapid variations in OH during ORION99 could not be investigated owing to high detection limits, but hourly averaged measurements showed a mean daytime maximum of around 4 × 10⁶ molecule cm−3.138 Model calculations for OH were typically lower than observations, but were within the range of the observational uncertainty.41
Production of OH in the RACM model during the day was dominated by O(1D) + H2O and HO2 + NO in approximately equal amounts, with HO2 + NO being more dominant in the early morning and late afternoon. The major loss process for OH was its reaction with isoprene, followed by reactions with isoprene oxidation products and CO. HO2 production followed the reaction of peroxy radicals with NO, with additional contributions from formaldehyde photolysis and reactions of OH with CO and formaldehyde. Loss of HO2 was dominated by its reaction with NO, with reactions of HO2 with RO2, HO2 and O3 also playing a role.41
Significant concentrations of HO2 were also observed at night during ORION99, ranging between 0.5 and 5.5 pptv, with a trend for decreasing concentrations as the night progressed.41 Although concentrations of alkenes were below detection limits, and so could not be responsible for HO2 production following their ozonolysis, significant concentrations of monoterpenes were observed. Model calculations of HO2 were slightly lower than observations on one night, but were lower by a factor of up to 4 on another night. DMS chemistry considered to contribute to the missing radical source in the model, but could not explain the full extent of the discrepancy.41
Kanaya et al.41 discussed the difference in model results between Oki Island in 199840 to those on Okinawa Island in 1999.41,138 Similar mixing ratios of water vapour and isoprene were observed during the two campaigns, and so the differences could not be attributed to chemistry involving HO2·H2O complexes or chemistry of isoprene and its oxidation products (including glyoxal). The possibility of relatively high monoterpene emissions from the pine forests on Oki Island compared to Okinawa Island was cited as a potential source of the differences between the two sites, but no monoterpene measurements were made on Oki Island and no definitive conclusions could be made.41
Mixing ratios of NOx during ORION99 were typically 200–400 pptv in the morning and 100–200 pptv in the afternoon, but did reach 3000 pptv at times. Peak NO mixing ratios on Oki Island were typically 700 pptv, and observed at around 0900 hours, and the differences in NOx levels may offer some explanation as to the different model results. Moreover, there were significant differences in the concentrations of halogen species measured during the two campaigns. At Oki Island high concentrations of Cl2* (=Cl2 + HOCl) and Br2* (=Br2 + HOBr) were observed by a tandem diffusion scrubber/ion chromatography system, whereas concentrations during ORION99 remained below the instrument's limit of detection.79 As stated by Kanaya et al.,41 measurements of IO radicals at Mace Head in Ireland145,146 were predicted to influence HO2 concentrations through reactions (R15), (R16) and (R23), and it may be that the model discrepancies found for the experiments on Oki Island result from neglect of halogen chemistry in the model.41
| HO2 + XO → HOX + O2 | (R15) |
| HOX + hν → OH + X | (R16) |
| X + O3 → XO + O2 | (R23) |
The effects of iodine chemistry on HO2 were investigated using a modified RACM chemistry scheme.6 In order to reproduce the midday observations of HO2 the model required 25 pptv of IO, although this was reduced to 12 pptv of IO if the aerosol uptake coefficient for HOI (γHOI) was increased from γHOI = 0 to γHOI = 0.5. The model success was also observed to display some dependence on the total NOx concentration, with greater model success at higher NOx concentrations.6
In contrast to the daytime measurements during RISOTTO, the nighttime measurements of HO2 were underpredicted by the model.140 Mean mixing ratios of 4.2 pptv HO2 were observed at night, with temporal variations exhibiting a positive correlation with the sum of the concentrations of α-pinene, β-pinene, camphene and limonene monoterpenes.140 Model calculations indicated that ozonolysis of monoterpenes represented the main nighttime radical source, but could still only reproduce the HO2 observations to within 58%. Several explanations were put forward to explain the difference between the modelled and observed concentrations. The first was centred on possible misrepresentation of RO2 chemistry in the model, and recommendations were made for further laboratory work regarding the kinetics of RO2 + NO reactions, particularly for large RO2 radicals such as those derived from monoterpenes. The second explanation discussed the potential for a systematic interference in the measured HO2 signal from RO2 radicals, and sensitivity calculations in which 5% of the modelled total RO2 concentration was added to the modelled HO2 concentration could rectify the model discrepancy for two out of the three nights on which measurements were made. In light of the more recent work by Fuchs et al.,30 in which interferences in FAGE HO2 measurements from several alkene-derived RO2 radicals are reported, the potential for interferences from monoterpene-derived RO2 radicals should most certainly not be ruled out.
The third possible explanation related to the decreased model success at high NO2 concentrations, and it was suggested on the basis of work by Harrison et al.147 that reactions of NO2 with conjugated dienes might lead to radical production, or that the chemistry of HO2NO2 was not well represented in the model. The final possible explanation considered the contributions of ozonolysis of unmeasured species containing double bonds to HO2 production.
Further experiments on Rishiri Island in September 2003 also revealed positive correlations of HOx with monoterpenes at night, and even stronger correlations between HO2 and the product of [O3], [monoterpene] and ϕradical, the total radical (OH, HO2 and RO2) yield from monoterpene ozonolysis.7 Model calculations were conducted for three nights during the campaign, with an overestimate of HO2 on two nights and an underestimate on another. The median modelled to observed ratio for HO2 for all three nights was 1.29, dropping to 0.49 on the one night on which observations were underestimated. OH concentrations were typically underestimated, with a median modelled to observed ratio of 0.56.
The model calculations indicated that monoterpene ozonolysis was the dominant nighttime radical source, and that OH loss was dominated by reactions with CO, CH4 and monoterpenes. Loss of HO2 was found to be controlled by O3, NO, HO2 and RO2, with NO thought to be present as a result of local soil emissions. Radical losses were controlled by peroxy radical cross-reactions.
Daytime measurements of OH and HO2 during the 2003 campaign on Rishiri Island, with daytime maxima of 2.7 × 10⁶ molecule cm−3 for OH and 5.9 pptv for HO2, were significantly overestimated by modelling using the RACM. For the 2003 campaign the model overestimated OH by an average of 35% and HO2 by an average of 89%,7 compared to an underestimation of OH by 36% and an overestimation of HO2 by 70% during the 2000 campaign, although the OH measurements made in 2000 were subject to significantly larger uncertainties owing to a higher detection limit.6
The overestimation of HO2 was shown to be worse at low NO concentrations for both the 2000 and 2003 datasets, with a similar diurnal variation in the rate of the additional loss process required to rectify the modelled HO2 concentrations.7 Halogen chemistry, heterogeneous loss of HO2 to aerosol surfaces and the possibility of increased rates of HO2 + RO2 reactions were considered as potential sources of the model discrepancy.
Reactions of HO2 with RO2 were found to be the dominant radical loss mechanism, but HO2 loss was dominated by reaction with NO. An increase in the rates of HO2 + RO2 reactions by a factor of 5 was required to replicate the observations during the day, but led to a significant underestimation of the measurements of HO2 at night.7 Uptake of HO2 onto aerosol particles could not fully explain the model discrepancies, with an uptake coefficient of unity required to reproduce the observations – a value much greater than reported by recent laboratory studies on atmospheric particles (e.g. Taketani et al.,46,47 Thornton and Abbatt,148 Thornton et al.,149 Macintyre and Evans150). In order to replicate the observed HO2 concentrations model calculations required 25 pptv of IO radicals, but measurements of organoiodides were unable to support such high IO mixing ratios, with similar results found for BrO.7 Therefore, unless significant inorganic sources of IO and BrO were present, the inclusion of halogen chemistry in the model could not fully explain the HO2 observations. No single hypothesis was found which could fully explain the observed concentrations.7 It should be noted that IO concentrations at the levels required have been observed using the in situ LIF technique at other coastal locations with significant seaweed beds that are exposed at low tide,44,45 and by cavity ringdown spectroscopy.151
Identifying the role of halogen chemistry in the marine boundary layer, and its impact on HOx, was one of the main aims of the NAMBLEX (North Atlantic Marine Boundary Layer Experiment) campaign which took place from 23rd July to 4th September 2002 in Mace Head, Ireland.3–5,152,153 A comprehensive suite of chemical species and meteorological parameters were measured during NAMBLEX, with measurements of those species required to constrain zero-dimensional box models used to investigate HOx chemistry co-located at the shore site so that differences in air mass composition could not be a valid reason to explain poor agreement between observed and modelled radical concentrations.152
Measurements of BrO, IO, OIO and I2 were made by DOAS154 and OIO and I2 by broadband cavity ringdown spectroscopy (BBCRDS),155 and NAMBLEX represents the first real-time in situ measurements of I2 in the atmosphere, and BrO in the marine boundary layer. Maximum IO mixing ratios of 4 pptv were recorded over a week from the 15th to the 21st of August, and BrO was measured over six days with a maximum mixing ratio of 6.5 pptv and a mean of 2.3 pptv.154
OH and HO2 were measured by the Leeds FAGE group, with local solar noon concentrations of (3–8) × 106 molecule cm−3 for OH and (0.9–2.1) × 108 molecule cm−3 (3.5–8.2 pptv) for HO2.4 Significant concentrations of HO2 were also observed at night, in the range (2–3) × 107 molecule cm−3.4 OH concentrations at night remained below the instrumental limit of detection (6 × 10⁴ molecule cm−3).
Steady state calculations for OH gave a diurnally averaged calculated to observed ratio of 1.04 ± 0.36, and the ratio displayed a distinct diurnal variation, being less than 1 in the early morning and late afternoon and greater than 1 around noon.4 Equivalent steady state calculations for HO2 gave a mean calculated to observed ratio of 3.22 ± 0.69, which could be reduced to 1.87 ± 0.61 by including loss of HO2 to IO and aerosol surfaces, and reduced further still by increasing the IO concentration to account for possible non-uniform distribution of iodine species in the DOAS light path.4
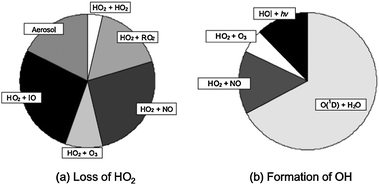
Bloss et al.3 used measurements made during NAMBLEX to investigate the impact of IO on HOx by calculating the rate of loss of HO2 to HO2, CH3O2, NO, O3, IO and aerosol (using γHO2 = 0.2), and the rate of OH production from photolysis of ozone and HOI, and reactions of HO2 with O3 and NO. Fig. 6 shows the results from these calculations, indicating that the reaction between HO2 and the spatially averaged DOAS IO measurements could represent 40% of the total HO2 removal rate, and that HOI photolysis could comprise up to 15% of the total OH production at midday.3
 | ||
| Fig. 6 Processes contributing to (a) removal of HO2 and (b) production of OH during the NAMBLEX campaign in Mace Head, showing the impact of iodine species. (Reproduced from ref. 3, Copyright (2005) American Geophysical Union. Reproduced by permission of American Geophysical Union. Further reproduction or electronic distribution is not permitted.) | ||
A full modelling analysis using the MCM (v3.1) in a box model framework was conducted by Sommariva et al.,5,153 concentrating on periods characterised by ‘clean’ conditions (<30 pptv NO and 60–80 pptv NO2). Model calculations were conducted with varying levels of chemical complexity, to investigate the impacts of a range of VOCs, oxygenated VOCs (oVOCs), peroxides, halogen chemistry and heterogeneous uptake on the simulated concentrations of OH and HO2.5
Fig. 7 shows the observed and modelled OH concentrations during NAMBLEX.5 Modelled concentrations of OH were generally within 25% of the measured concentrations. Similarities between the ‘clean’ base model run, constrained to a limited number of VOCs, and the ‘full’ base model run, constrained to a wider range of VOCs, were attributed to the dominance of CO, CH4 and H2 in the OH loss processes. The largest discrepancy between the ‘clean’ and ‘full’ base models was observed during a period characterised by high isoprene concentrations. Inclusion of oxygenated species represented a net sink for OH, despite their photolysis leading to OH production. In general, inclusion of oVOCs led to improvements in the model simulations for OH, indicating the importance of these species in understanding the radical budgets.
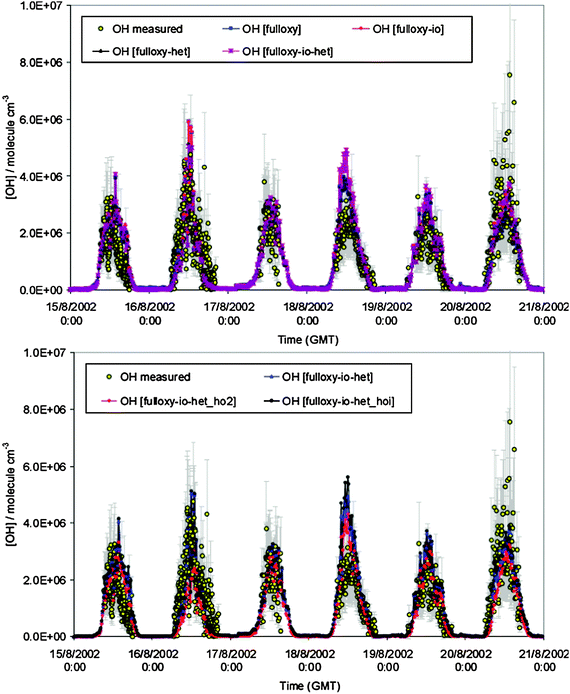 | ||
| Fig. 7 Observed and modelled OH concentrations during the NAMBLEX campaign in Mace Head in 2002 using varying levels of model complexity (fulloxy = inclusion of oxygenate measurement constraints; io = inclusion of halogen measurement constraints; het = inclusion of heterogeneous aerosol loss process). (Reproduced from ref. 5, Copyright (2006), with permission from Copernicus Publications.) | ||
While modelled concentrations of HO2 were also similar for the ‘clean’ and ‘full’ base model runs, the modelled concentrations were significantly higher than the observations, with an overestimation on some days by at least a factor of 2. As noted by Sommariva et al.,5 model overestimation of HO2 observations is a common feature of studies in the marine boundary layer, suggesting that an important part of the chemistry in these regions is either missing or poorly implemented. The simultaneous measurement of halogen oxides and HO2 during NAMBLEX was a significant advance and enabled investigation of the impacts of IO and BrO on the modelled HO2 concentrations. Observations of IO and BrO were made by the DOAS technique, and, owing to the different spectral windows required to observe the two species, only one of the two could be measured at any one time. Inclusion of halogen oxide chemistry and heterogeneous chemistry generally had little impact on the modelled OH concentrations, with a maximum increase of 15% in OH owing to photolysis of HOI if DOAS measured IO levels154 were used. Modelled HO2 concentrations were decreased by up to 30%, insufficient to fully explain the model discrepancy, and were highly dependent on aerosol uptake coefficients for HO2, HOI and HOBr. Using the theoretical maximum value of γHO2 = 1 generally gave good agreement with the measured HO2 concentrations, and led to a model underestimate of up to 50% on one day. However, such high values of γHO2 are not consistent with laboratory data, and are highly unlikely.
While the observed mixing ratios of IO and BrO were insufficient to explain the model discrepancy for HO2 during NAMBLEX, and were much lower than the 25 pptv of IO required by Kanaya et al.6 to improve their model simulations for the Rishiri Island campaign, it should be noted that the DOAS technique measures an average concentration over the long path length of the light beam. More recent work at Mace Head, comparing IO measurements made by DOAS with in situ point measurements using LIF, has shown that significant inhomogeneities exist in IO concentrations in intertidal regions.45 Commane et al.45 showed similarities in the temporal trends of IO measurements by DOAS and LIF, but reported point measurements of up to 50 pptv, and generally 6–10 times greater than the spatially averaged observations made by the DOAS instrument. Consideration of such factors may make a significant difference in the assessment of in situ point measurements of OH and HO2, particularly if the halogen source region is heterogeneous in nature.
Sommariva et al.153 also investigated the nighttime radical chemistry during NAMBLEX, attempting to explain the (2–3) × 107 molecule cm−3 HO2 observed at night during the campaign. The model was able to reproduce the HO2 observations to within the combined uncertainties of the model and measurements (30–40%), and showed the dominant radical sources at night to be reactions of ozone with light alkenes. The model calculations indicated that alkene ozonolysis chemistry resulted in a slow but steady source of nighttime radicals, and that cycling between OH and HO2 was maintained by low concentrations of NO. In addition, loss of radicals was limited by their slow removal through RO2 + RO2 reactions, leading to only small decreases in the total radical concentrations overnight.
The NAMBLEX campaign was followed by a series of field measurements at the Cape Verde Atmospheric Observatory in the tropical North Atlantic in May and June 2007 in the RHaMBLe (Reactive Halogens in the Marine Boundary Layer) campaign and the Seasonal Oxidant Study (SOS) throughout 2009 to investigate the roles of halogen species in the tropical marine boundary layer.156,157
Observations of IO and BrO were made by the DOAS technique, and measurements made between November 2006 and June 2007 at the observatory displayed diurnal cycles dependent on solar radiation, with mean daytime maxima of 1.4 ± 0.8 pptv IO and 2.5 ± 1.1 pptv BrO.42,43 The presence of the halogen monoxides at such levels was shown to result in extensive destruction of boundary layer ozone in the region.43
The impact of halogen monoxides on OH and HO2 budgets during RHaMBLe was assessed by Whalley et al.70 Maximum midday concentrations of 9 × 10⁶ molecule cm−3 OH and 6 × 10⁸ molecule cm−3 (∼25 pptv) HO2 were observed during the campaign, and a box model with MCM chemistry extended to include halogen chemistry and heterogeneous loss processes was used to interpret the observations.70 Towards the start of the campaign, when HCHO mixing ratios were significantly higher than the mean value used to constrain the model (2 ppbv compared to the mean of 328 pptv), the model underpredicted HO2 by 39%. For the remainder of the campaign, the model was able to reproduce the daytime OH and HO2 observations to within the measurement uncertainty of 20% when halogen chemistry and heterogeneous losses for HO2 were considered.70 Nighttime measurements of HO2, made on two nights during the RHaMBLe campaign, were significantly underpredicted by the model, with nighttime HOx production from alkene ozonolysis reactions, particularly of propene (72%) and isoprene and its oxidation products (25%). Radical production following reactions of NO3 with alkenes was not thought to be important during the campaign.70
Production of OH during the day occurred primarily as a result of O3 photolysis (76% of the total at noon), with photolysis of HOBr and HOI combined contributing an additional 13% to the instantaneous OH production. Loss of OH was dominated by its reactions with CO (28%) and acetaldehyde (25%), with HO2 production principally achieved through OH + CO (41%) and CH3O + O2 (16%). At the concentrations of BrO and IO observed during 2007,42,43 the reactions of BrO and IO were found to constitute approximately 19% of the instantaneous sink for HO2, while aerosol uptake (using γHO2 = 0.1) and surface deposition comprised a further 23% of the noontime HO2 loss.70 It was estimated that the OH concentrations were 9% higher overall owing to the presence of halogens, leading to a 9% decrease in the local methane lifetime.70
In 2009, seasonal measurements of OH and HO2 were made at the Cape Verde Atmospheric Observatory during the Seasonal Oxidant Study.15,157 The observed concentrations were found to be higher in the summer months (June and September), with maximum daytime concentrations of 9 × 10⁶ molecule cm−3 OH and 4 × 10⁸ molecule cm−3 HO2, similar to those observed at the site in 2007,70 and almost double the concentrations observed in winter (late February, early March).15
Analysis of the OH and HO2 variance throughout the 2009 campaign indicated that approximately 70% of the total variance could be explained by diurnal behaviour, with the remaining 30% being due to changes in air mass.15
In contrast to the predominant marine influence at the Cape Verde site, the DOMINO (Diel Oxidant Mechanisms in relation to Nitrogen Oxides) campaign on the Atlantic coast of southern Spain in 2008 was characterised by air masses from urban and industrial regions as well as those with marine origins.158 Although significant interferences in OH, and potentially HO2, were reported, observations of OH, HO2 and OH reactivity were greater in air masses originating from continental regions than marine regions, with observations of HO2 in air masses originating from continental regions typically twice those in air masses originating from the ocean.158 Modelling of the boundary layer dynamics during DOMINO, coupled to chemical reaction schemes including MOZART (Model for Ozone And Related chemical Tracers) and a reduced chemical scheme, underpredicted OH using the MOZART scheme and gave a reasonable OH simulation with the reduced scheme, although the potential intereferences in OH were not accounted for.159
4.2. Aircraft campaigns
Our understanding of atmospheric chemistry has been greatly enhanced by aircraft measurements of composition. The ability to investigate regional scale composition, and to study differences in composition as a function of altitude and age of airmass, and between marine and continental regions is a significant advantage of aircraft studies. In this section we concentrate on aircraft campaigns in marine regions (Table 2), but also discuss briefly some measurements over continental regions, as both are often sampled within the same flight or campaign. Continental aircraft studies are also discussed in the appropriate sections below.| Campaign | Year | Dates | Location | Platform | Technique | OH measured | HO2 measured | Comments | Ref. |
|---|---|---|---|---|---|---|---|---|---|
| SUCCESS | 1996 | April–May | Western continental USA | Aircraft | LIF | Midday 0.1–0.5 pptv | Midday 3–15 pptv | Model calculations reproduced observations at times but were lower by a factor of up to 4 at other times | 48, 161, 163, 321 |
| PEM-Tropics A | 1996 | August–October | Tropical Pacific Ocean | Aircraft | CIMS | 6–8 × 10⁶ molecule cm−3 in the MBL | — | Model slightly lower than observations | 164, 172–174 |
| SONEX | 1997 | October | North Atlantic | Aircraft | LIF | ∼0.1 pptv | ∼4 pptv | Model generally reproduced observations, but with underestimates at low NO and overestimates at high NO | 48, 160, 162, 163, 322 |
| PEM-Tropics B | 1999 | March–April | Tropical Pacific Ocean | Aircraft | LIF and CIMS | Median ∼0.1 pptv below 2 km in altitude | Median ∼9–15 pptv below 2 km in altitude | OH median modelled to observed ratio of 0.9, with underprediction at high altitudes and overprediction at low altitudes; HO2 median modelled to observed ratio of 1.03, with overprediction at high and low altitudes | 48, 71, 107, 164, 165, 169–174 |
| TRACE-P | 2001 | March–April | Western Pacific Ocean | Aircraft | LIF and CIMS | ∼0.1 pptv | ∼8 pptv | OH median modelled to observed ratio of 1.07 for CIMS and 1.41 for LIF, overprediction worse at high altitudes; HO2 median modelled to observed ratio of 1.23 | 48, 175–178, 181, 323 |
| INTEX-A (see also Table 3 for regions influenced by biogenic emissions) | 2004 | July–August | North America and western Atlantic Ocean | Aircraft | LIF | Median OH ∼0.25 pptv up to 6 km in altitude, rising to 0.86 pptv at 12 km in altitude | Median surface HO2 of 30 pptv, decreasing with altitude to 8 pptv at 12 km in altitude | OH observed to modelled ratio of 0.95 above the boundary layer; HO2 observed to modelled ratio of 1.2 at altitudes less than 8 km, rising to 3 at 11 km in altitude and correlating with high NOx | 182 |
| INTEX-B | 2006 | March–May | Pacific Ocean | Aircraft | LIF | ∼2 × 10⁶ molecule cm−3 near the surface | ∼3 × 10⁸ molecule cm−3 near the surface | OH overpredicted; HO2 generally well reproduced | 183, 184, 254 |
Several studies using the NASA P3B and DC8 aircraft have been directed towards investigation of HOx chemistry over the USA, and of the impact of pollution from Asia on composition over the USA. The SUCCESS (Subsonic aircraft: Contrails and Clouds Effect Special Study) mission in 1996 made aircraft measurements of OH and HO2 throughout the troposphere and lower stratosphere over the USA onboard the NASA DC8 aircraft with the ATHOS-FAGE instrument.160 The campaign was largely concerned with the effects of clouds and contrails on HOx radicals, and reported midday values of OH in the range 0.1–0.5 pptv and HO2 in the range 3–15 pptv.160 Steady state box model calculations were able to reproduce the observations at times, but at other times the observations were more than a factor of 4 greater than the modelled concentrations, possibly as a result of unmeasured HOx sources transported from Asia.160
Results from box model calculations investigating HOx chemistry between 8 and 12.5 km in altitude indicated that the most significant discrepancies between the model and the observations were found to occur in the outflow of a convective storm, and could be explained by the convective injection of peroxides and formaldehyde from the boundary layer into the upper troposphere.161 The results from SUCCESS indicate that local convection was a major source of HOx (and NOx) to the upper troposphere over the central USA, and that high HOx concentrations in the upper troposphere stimulate ozone production and increase the sensitivity of ozone to NOx emissions.161
Impacts of aircraft NOx emissions on chemistry in the free troposphere and lower stratosphere were investigated in the SONEX (Subsonic assessment, Ozone and Nitrogen oxide Experiment) campaign in 1997, during which measurements were made onboard the NASA DC8 aircraft in and out of the North Atlantic aircraft corridor.160 Diurnal steady state box model calculations were generally able to reproduce the observed HOx concentrations, but did display a tendency for underestimation at low NO concentrations and sunrise and overestimation at higher NO and inside cirrus clouds.160–162 Heterogeneous conversion of NO2 to HONO on aerosols during the night, followed by photolysis of HONO, could partially explain the discrepancy at sunrise, as could uncertainties in the kinetics of HO2NO2 production and loss, while heterogeneous loss of HO2 to aerosols and ice crystals improved the simulations inside cirrus clouds.160–162 Model discrepancies at high NOx concentrations were attributed to the possibility of unmeasured HOx precursors, potentially resulting from recent convective events.160–162
Jaegle et al.163 used the SUCCESS and SONEX data, together with data from the STRAT (Stratospheric TRacers of Atmospheric Transport) campaign (not discussed here owing to its focus on stratospheric chemistry) to provide a framework for understanding HOx chemistry in the upper troposphere. This analysis showed that primary production of HOx in the upper troposphere is dominated by O(1D) + H2O at mixing ratios of H2O above 100 ppmv, with photolysis of acetone and possibly other convected HOx precursors dominating under drier conditions. Methane oxidation was shown to amplify the primary HOx sources in the upper troposphere by a factor of 1.1 to 1.9.163
Results from the NASA Pacific Exploratory Missions (PEM) over the South Pacific in spring 1996 (PEM-Tropics A) and autumn 1999 (PEM-Tropics B) also indicated that species such as H2O2, CH3OOH, CH3O2 and HCHO represent important sources of HOx in the upper troposphere, and that inclusion of constraints on these species in model simulations leads to increased HOx concentrations.164 Below altitudes of 11 km, inclusion of acetone and CH3OOH led to the greatest increase in modelled HOx concentrations, while H2O2 was found to be more important at altitudes between 11 and 12 km.164
Model calculations for altitudes between 8 and 12 km during the PEM-Tropics B campaign were able to capture 80% of the variance in the observed HO2 concentrations, with a median simulated to observed ratio of 1.1, but only 38% of the variance in the observed OH, with a median simulated to observed ratio of 0.86.165 This work showed that the primary sources of HOx were O(1D) + H2O and photolysis of acetone, with the contribution from acetone becoming more significant under drier conditions. However, it should be noted that subsequent measurements of the temperature dependence of acetone photolysis quantum yields166 indicate that the contribution of acetone photolysis to HOx production in the upper troposphere is lower than suggested by model calculations based on room temperature measurements of acetone photolysis quantum yields.167,168
Photolysis of convected CH3OOH has been shown to be important over the Southern Pacific Convergence Zone (SPCZ), representing between 22 and 64% of the total primary source in this region.165 In addition, analysis of data from a single flight during the PEM-Tropics B campaign has also highlighted the importance of convected CH3OOH in the upper troposphere.169 The flight in question followed a back-and-forth pattern at a constant altitude of 10 km for 4 hours, sampling both the background atmosphere and an aged convective outflow. Compared to the background concentrations, HO2 and CH3OOH were 50% and 350% higher in the convective outflow. Box model calculations indicated that CH3OOH photolysis was responsible for the elevated HO2 concentrations, and the model was able to reproduce the HO2 observations when constrained to CH3OOH. No increase in OH concentration was observed in the convective outflow, attributed to the reaction between OH and CH3OOH.169 Sensitivity analysis of the model indicated that the rate coefficient used in the model for reaction between HO2 and CH3O2 may be a factor of 3 too low at the low temperatures of the upper troposphere, and that this reaction may represent the single most important loss pathway for HOx in the upper troposphere.169
Investigation of the full dataset for the PEM-Tropics B campaign for the DC8 aircraft, on which OH and HO2 were measured by the ATHOS-FAGE instrument, revealed that box model calculations were generally able to reproduce the observations, with mean modelled to observed ratios of 0.86 for OH and 1.03 for HO2.71 However, the model calculations had a tendency to underpredict OH at higher altitudes and overpredict at lower altitudes,71,170 and to overpredict HO2 at the extremes of altitude, with no obvious geographical bias.71
Production of OH at altitudes below 7 km was dominated by O(1D) + H2O.71 As discussed above, OH production from photolysis peroxides became more important at higher altitudes, with peroxides contributing as much as 20% of the total production even at low altitudes and reaching 80% in some regions at high altitudes.71 Such large contributions from peroxides result from the partitioning of HOx towards HO2 at the low NOx concentrations encountered during the campaign.71 NO concentrations typically increased with altitude and loss of HO2 was dominated by peroxide formation and conversion to OH by NO, while loss of OH was dominated by reaction with CO, CH4, HCHO, acetone, ethane, propane and peroxides.71
OH measurements were also made onboard the NASA P3B aircraft by CIMS during PEM-Tropics B.171 An intercomparison between the two datasets involving normalisation of the measurements with box models run for each aircraft's flight-track reported agreement within approximately 10% and did not find any clear measurement discrepancies, although the P3B data was generally higher at lower altitudes and the DC8 was generally higher at higher altitudes.107,172 The largest discrepancy between the model and the OH P3B observations was found at the highest altitude, and although the model displayed a tendency to overestimate the observed concentrations the modelled concentrations were well within the uncertainties of the measurements or model inputs.171
The P3B flights provided measurements of OH in the vicinity of Tahiti (17°–22° S) and Christmas Island (0°–3° N), where average midday boundary layer concentrations of 7–8 × 10⁶ molecule cm−3 and 6–7 × 10⁶ molecule cm−3 were observed respectively.171 Measurements of OH were also made near Christmas Island by the CIMS instrument onboard the P3B aircraft during the PEM-Tropics A campaign.173
In the PEM-Tropics A work, an air mass was sampled in a Lagrangian mode over the course of a day and model calculations were conducted using both a time dependent box model, used to simulate the large scale diurnal variations of O3, H2O2, CH3OOH, HCHO and OH, and a photostationary state model, constrained to long-lived species at the specific times and sampling locations during the flight.173 The two model approaches were in good agreement with each other (regression analysis giving a slope of 1.18 and r2 = 0.91), and were only slightly lower than the observations.173 The dominant process responsible for HOx production was O(1D) + H2O (80%), with photolysis of H2O2 and CH3OOH each contributing an additional 10%. Removal of HOx radicals was dominated by CH4 chemistry (53%), followed by production of H2O2 from HO2 + HO2 (39%) and OH + HO2 (8%).173
Seasonal differences in HOx chemistry between the PEM-Tropics A (spring 1996) and PEM-Tropics B (autumn 1999) campaigns were investigated by Olson et al.174 using the DC8 data to constrain a photochemical box model. Although OH and HO2 were not measured during PEM-Tropics A, comparison between modelled and observed concentrations for the PEM-Tropics B data revealed similar results to those described above, with median modelled to observed ratios of 0.91 for OH and 1.03 for HO2, displaying a tendency for overprediction of HO2 at low and high altitudes.174
The predicted concentrations of OH and HO2 for each campaign showed that the HOx concentrations were expected to be higher during spring 1996 (PEM-Tropics A) than autumn 1999 (PEM-Tropics B).174 While much of these differences reflect seasonal dependence of the primary production of OH from O(1D) + H2O, in regions such as the middle troposphere in the tropics where high NOx concentrations were observed during PEM-Tropics A, there is an additional contribution to OH production from HOx recycling involving NO.174
The combined dataset for the PEM-Tropics campaigns also enabled construction of a geographical grid describing OH distributions as a function of latitude and altitude.172 A scaling algorithm was used to convert the OH observations to an equivalent high-noon value, enabling more robust comparisons to be made between different locations.172 On average the box model calculations agreed with the observed OH concentrations to within a factor of 1.5, but model results were systematically lower than the observations at higher altitudes with similar results obtained to those described previously.172 A three-dimensional model analysis was also conducted, with good agreement reported between the 3D model and the box model, and hence between the 3D model and the observations.172
Aircraft experiments involving both the NASA DC8 and P3B aircraft were also conducted over the Pacific Ocean during the TRACE-P (TRansport and Chemical Evolution over the Pacific) campaign in spring 2001.175–177 Measurements of OH and HO2 were made using the ATHOS-FAGE instrument onboard the DC8 aircraft, with measurements on the P3B aircraft made by CIMS for OH and a PerCIMS for the sum of peroxy radicals (HO2 + ΣRO2).175–177 Comparisons between the two OH measurements during periods when the two aircraft were within 1 km or less of each other revealed a correlation between the measurements with a slope of 1.58 (P3B-CIMS vs. DC8-FAGE) and r2 = 0.88, and owing to the short lifetime of OH and strong dependence on local conditions the differences between the measurements could well reflect real differences in composition.175 Similarly, comparisons between the HO2 and HO2 + ΣRO2 measurements showed good agreement during some periods but not at others, but do not necessarily indicate instrumental problems.177
A box model focused on the P3B OH data gave a slope of 0.85 in a regression analysis of the measured OH against the modelled OH, indicating a trend towards overprediction by the model.176 However, at sea level the model had a tendency to underestimate OH, with an average measured to modelled ratio of ∼1.5. At an altitude of approximately 0.8 km, a measured to modelled ratio of 1 was observed, with higher altitudes (>2 km) having a ratio around 0.8 and dominating the overall trend.176
A subsequent study presenting an analysis of the P3B and DC8 data within an identical box model framework, thus allowing for more direct comparisons between the two datasets, gave a median modelled to observed ratio of 1.07 for the P3B OH data and 1.41 for the DC8 OH data.178 The modelled to measured ratios for OH displayed a clear trend with altitude,178 with similar results for the P3B data to those reported previously.176 The model overprediction of the DC8 data was observed to increase from 7% at altitudes below 1 km to 60% in the middle troposphere and reaching 80% at higher altitudes.178
During analysis of the TRACE-P dataset it was noted176 that the average modelled to measured ratios of OH for the TRACE-P and PEM-Tropics experiments over the Pacific Ocean were generally lower than the values obtained over more continental regions such as Mace Head,124 Greece179 and forested regions of the US.180 It was proposed that air masses over continental regions would contain a greater number of unmeasured VOCs, contributing to OH loss but not included in the model studies, which would be oxidised during the time required for the air masses to reach the regions of continental outflow investigated during the Pacific Ocean experiments.176
The median modelled to observed ratios for the TRACE-P DC8 HO2 data was 1.23, and although there was in general no clear trend with altitude, elevated ratios at lower to middle altitudes were found to correlate with in-cloud data, indicating the need for heterogeneous loss processes in the model, and the median ratio for stratospheric HO2 was significantly lower at 0.63 than that for the remainder of the dataset (1.24).178 In addition, a subset of HO2 data coincident with observations of high NO concentrations (>135 pptv) in the upper troposphere had a median modelled to observed ratio of 0.97, while the overprediction for OH was greater for this subset of data, suggesting uncertainties in the rate of HOx recycling by NO.178
Three-dimensional simulations of OH and HO2 during TRACE-P were able to capture the main features in the observations, but, similarly to the box model simulations, overpredicted both OH and HO2 by factors of 1.56 and 1.24, respectively.181 The overprediction of OH was observed to be greatest at low observed NO as a result of a model overestimation of NO, and it was found that the model was more successful at reproducing the OH and HO2 observations in polluted environments than in the clean marine boundary layer.181
Olson et al.48 reported a box model re-evaluation of HOx data from the SUCCESS, SONEX, PEM-Tropics B and TRACE-P campaigns, focusing on the previously described discrepancies between models and observations. In this work, Olson et al.48 showed that much of the model discrepancies for HO2 found at high NOx concentrations in the SUCCESS campaign could be attributed to the use of data averaged over timescales too long to truly reflect the response of HOx to highly variable conditions of NOx.
Model discrepancies for the SONEX campaign at high NOx were also rectified to an extent by Olson et al.,48 as shown in Fig. 8, but were found to be largely a result of incomplete descriptions of HOx sources and sinks and uncertainties in kinetic and photochemical parameters rather than the timescale for averaging of constraints. The initial modelling studies for SONEX162 were constrained to a limited set of non-methane hydrocarbons (ethane, propane, C4 alkanes and acetone), while Olson et al.48 included observations of C5 and higher alkanes, C2H4, higher alkenes, aromatics, peroxides (H2O2 and CH3OOH), CH3OH, PAN and HNO3 and used updated descriptions for the kinetics and photochemistry. The changes in modelled HO2 were greatest for the points with the highest NOx concentrations, owing to a combination of improvements in measurements of the rate coefficient for the reaction between OH and NO2 and photolysis data for HO2NO2 and acetone, particularly of the temperature dependent acetone photolysis quantum yields which suggest a reduced role for acetone photolysis in the upper troposphere than indicated by earlier modelling studies. Inclusion of alkene and aromatic chemistry in the model calculations also led to improvements in modelled HOx concentrations at high NOx since enhanced concentrations of alkenes and aromatics were in general coincident with high NOx.48
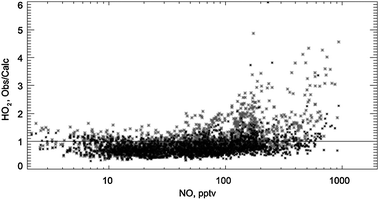 | ||
| Fig. 8 Observed/calculated HO2 as a function of NO during the SONEX campaign (reproduced from ref. 48, Copyright (2006) American Geophysical Union. Reproduced by permission of American Geophysical Union. Further reproduction or electronic distribution is not permitted.). The grey symbols show the initial model results reported by Faloona et al. (2000).162 The black symbols show the reanalysis by Olson et al. (2006)48 using a more comprehensive set of model constraints and updated descriptions of kinetic and photochemical parameters. | ||
Olson et al.48 noted that increasing NOx concentrations affect HOx chemistry by three mechanisms. First, increased NOx leads to increased importance of RO2 + NO and thus of recycling of HOx through VOC chemistry; secondly through partitioning of HOx towards OH; and thirdly through increased significance of HOx loss through OH + NO2.
Model discrepancies at high solar zenith angles could not be explained due to incomplete understanding of nighttime HOx sources, and problems with HO2 simulations in-cloud for TRACE-P could not be resolved, partly owing to the difficulties associated with evaluating the role of cloud liquid water volume as well as that of particulate matter.48 An aircraft campaign over West Africa in 2006 also reported the impact of clouds on HO2 measurements, with large decreases in HO2 observed as the aircraft flew through clouds, correlating with measurements of liquid water content, indicating heterogeneous chemistry and uptake of HO2 into cloud droplets.69
Following the extensive studies over the Pacific Ocean, the INTEX-A (INtercontinental Chemical Transport Experiment A) campaign was conducted over North America and the Western Atlantic Ocean on the NASA DC8 aircraft in summer 2004.182 A number of different types of air mass were sampled during this campaign, including those influenced by anthropogenic pollution, biomass burning, convection and the stratosphere, providing a wide range of conditions under which to test our understanding of HOx chemistry.182
Measurements of OH and HO2 during INTEX-A were made by the ATHOS-FAGE instrument at altitudes ranging from several hundred metres to almost 12 km. Median mixing ratios of OH were found to be relatively constant at ∼0.25 pptv up to altitudes of 6 km, and then increasing with altitude to a maximum of 0.86 pptv at 12 km.182 Mixing ratios of HO2 were observed to decrease with increasing altitude, from a maximum median of ∼30 pptv near the surface to a minimum median of ∼8 pptv at 12 km. Similar altitude profiles for OH and HO2 were observed during the PEM-Tropics B and TRACE-P campaigns.182
Observations of OH above the boundary layer were generally within 0.95 of box model calculations based on a diurnal steady state assumption, with a model underprediction in the boundary layer coinciding with continental measurements influenced by high isoprene concentrations.182 The model discrepancy in this region will be discussed in Section 5.
Observations of HO2 were generally within 1.2 of the modelled concentrations at altitudes less than 8 km, but the model displayed a significant underprediction of HO2 at higher altitudes. The observed to modelled ratio increased from ∼1.2 at an altitude of 8 km to a value of ∼3 at 11 km, correlating with high NOx concentrations,182 as shown in Fig. 9. Both HO2 and NO concentrations were significantly higher during INTEX-A than either PEM-Tropics B or TRACE-P, with NOx concentrations during INTEX-A on average four to five times those observed during TRACE-P and over an order of magnitude greater than those observed during the PEM-Tropics B campaign.182 Moreover, the differences in NOx concentrations were greatest at altitudes greater than 8 km, where the largest discrepancy for HO2 was observed.182
 | ||
| Fig. 9 Dependence of OH and HO2 mixing ratios and model success (obs/mod) on NO for INTEX-A (circles), TRACE-P (stars) and PEM-Tropics B (triangles). Lines show the median values. The grey dots indicats the INTEX-A 1-min measurements. (Reproduced from ref. 182, Copyright (2008) American Geophysical Union. Reproduced by permission of American Geophysical Union. Further reproduction or electronic distribution is not permitted.) | ||
Budget calculations for HOx indicated that O(1D) + H2O was the primary HOx source at altitudes below 7 km, with HCHO photolysis the dominant source above 7 km in altitude.182 Losses of HOx were dominated by HO2 + RO2 reactions below 8 km, with OH + NO2 increasing in importance at higher altitudes. It was suggested that the model underprediction for HO2 at high altitudes, in what was thought to be convected air owing to the high concentrations of NO, may have resulted from the presence of additional unknown HOx sources.182
The second phase of the INTEX experiments (INTEX-B) was conducted in spring 2006, with a focus on the Pacific Ocean and outflow of pollution from Mexico and Asia.183 The INTEX-B mission reported the first airborne measurements of OH reactivity, made onboard the NASA DC8 aircraft alongside measurements of OH and HO2 by ATHOS-FAGE during the second half of the campaign investigating Asian outflow of pollution.184 At altitudes below 2 km, a diurnal steady state model for HOx and OH reactivity indicates the presence of missing OH sinks, where the model underpredicted OH reactivity and overpredicted OH.184 The model discrepancy for OH and OH reactivity at low altitudes coincided with a model underestimate of HCHO, leading to the suggestion that the missing OH sink may produce HCHO as an oxidation product.184 Observations of HO2 were well reproduced by the model, and sensitivity studies showed low sensitivity of HO2 to improvements in the model success for OH, HCHO and OH reactivity.184
In a laboratory study, small yields of HNO3 from the reaction of HO2 with NO have been measured, and found to be pressure and temperature dependent,311–314 with an impact on OH and HO2 concentrations throughout the troposphere, but mostly in the upper troposphere. Spectroscopic measurements in a jet of the OH·O2 complex, which determined an upper limit on the binding energy of ∼25 kJ mol−1, suggested that a significant fraction of atmospheric OH may be converted to HO3 in colder parts of the atmosphere,315 but more recent kinetics measurements of the reaction of OH with O2 to form the complex showed that the binding energy was considerably lower.316 The complex between HO2 and water vapour is estimated to have a binding energy of ∼31 kJ mol−1, and measurements of the equilibrium constant of this complex suggests that at sea-level ∼10% of HO2 may be in the form of this complex.317
4.3. Summary of studies in the marine boundary layer
Some of the earliest studies of atmospheric HOx chemistry were performed in the MBL, but the early field campaigns were often hindered by a lack of supporting measurements (for example of OH sinks) and inadequate chemical complexity in the models used, often resulting in model overpredictions of OH and HO2. More comprehensive measurement suites of VOCs and oVOCs, particularly aldehydes, which even in a remote, clean environment can provide significant OH reactivity, led to improved model simulations for OH and HO2, while simultaneous measurements of halogen oxide species enabled recognition of the importance of IO and BrO in controlling the interconversion of OH and HO2, and hence HOx concentrations in marine regions. However, the majority of halogen oxide measurements have been made by DOAS instruments, and the suitability of the spatially averaged concentrations measured by the DOAS technique for modelling in situ FAGE measurements of OH and HO2 has been questioned in some coastal environments by the development of in situ methods for IO measurements which show that significant inhomogeneities in emissions and concentrations can exist.Concentrations of HO2 are often overpredicted in model simulations in the marine boundary layer, particularly at night. The correct treatment of heterogeneous chemistry in models is a significant source of uncertainty, and the use of appropriate uptake coefficients (γHO2) to represent HO2 loss to aerosols in atmospheric models is essential to accurate model simulations. Early studies used γHO2 which were unrealistically high compared with more recent measurements, but further laboratory studies of the uptake of HO2 on aerosols are required to provide uptake coefficients for use within models.
Aircraft studies have provided opportunities to investigate the distribution of trace gases throughout the entire troposphere, enhancing our understanding of the chemistry and dynamics of the atmosphere from the boundary layer to high altitudes, and from continental to remote marine locations. In this section we have generally concentrated on aircraft campaigns in marine regions, with aircraft campaigns over continental regions considered in more detail in the relevant sections below. In comparing data from aircraft studies over oceans to those over continental regions, however, it has been found that model calculations are in better agreement with observations over oceans than over continental regions, a result attributed to the more diverse mix of VOCs over continental regions that cannot be fully measured or characterised, and whose oxidation chemistry is not adequately described in models.
With adequate measurement of OH sinks, as well as halogen species, model simulations in remote marine regions have typically been able to reproduce observations of OH and HO2 to within the combined uncertainty of the model and the measurement technique, although there is still considerable uncertainty regarding the details of nighttime radical chemistry in this environment. Studies at high altitudes have identified the importance of carbonyl compounds and peroxides as HOx sources in the upper troposphere, although laboratory measurements of smaller acetone photolysis quantum yields at low temperatures have indicated that acetone photolysis may not be as important for HOx production in the upper troposphere as expected on the basis of earlier modelling studies which used temperature independent quantum yields. Model discrepancies for HO2 observed at high NOx concentrations have been partly explained by the use of inappropriate averaging times for rapidly changing concentrations, with shorter and more appropriate time averaging resulting in improved model simulations.
5. Studies in environments influenced by biogenic emissions
Isoprene is produced by the biosphere and is the dominant biogenic VOC emitted into the atmosphere (∼500 Tg C year−1).185 A good representation of the oxidation chemistry of isoprene within a model, which is primarily driven by initial reaction with OH, leading to its chemical processing and ultimate removal is central to our ability to understand the composition of the atmosphere in biogenically influenced regions. A summary of field campaigns in environments influenced by biogenic emissions is given in Table 3.| Campaign | Year | Dates | Location | Platform | Technique | OH measured | HO2 measured | Comments | Ref. |
|---|---|---|---|---|---|---|---|---|---|
| Fritz peak | 1991 | Summer | Fritz peak observatory, Colorado, USA, 40° N, 105° W | Ground | CIMS, LP-DOAS, FAGE (for HO2) | 0.1–0.2 pptv range | — | Model OH overprediction unless >2 ppbv isoprene included. (NO generally below 100 pptv) | 186, 324 |
| TOHPE | 1993 | August–October | Fritz peak observatory, Colorado, USA, 40° N, 105° W | Ground | CIMS | 2 × 10⁶ molecule cm−3 (mean) | ∼1.2 × 10⁸ molecule cm−3 (case studies) | Model overpredicts OH by 50% and HO2 up to a factor of 4 under low NOx (50 pptv) conditions | 188, 190, 325 |
| AEROBIC | 1997 | July–August | Indigenious forest, North West Greece, 40° N, 21° E | Ground | FAGE | 4–12 × 106 molecule cm−3 (noon) | 0.4–9 × 10⁸ molecule cm−3 (noon) | Model underprediction of OH by ∼50%. Modelled HO2 was typically higher than observations. But observations showed high variability | 192, 199 |
| PROPHET-98 | 1998 | August | Deciduous forest, North Michigan, USA, 46° N, 85° W | Ground | FAGE | 0.1–0.2 pptv (noon) | 10–25 pptv (noon) | OH observations ∼2.7 times greater than modelled; HO2 observations and model in good agreement | 180, 201 |
| PROPHET-2000 | 2000 | July–August | Deciduous forest, North Michigan, USA, 46° N, 85° W | Ground | FAGE | HOx similar to that measured during PROPHET-98 | HOx similar to that measured during PROPHET-98 | HOx similar to that measured during PROPHET-98 OH reactivity measured | 11 |
| PROPHET-2001 | 2001 | July–August | Deciduous forest, North Michigan, USA, 46° N, 85° W | Ground | FAGE | No published work | |||
| PMTACS-NY | 2002 | June–August | Whiteface mountain, New York, 41° N, 74° W | Ground | FAGE | 2.6 × 10⁶ molecule cm−3 (noon) | 20 pptv (noon) | Semi-polluted – reasonable agreement between model and measurements – only low isoprene concentrations | 202 |
| ECHO | 2003 | July | Julich, Germany, 51° N, 6° E | Ground flux measurements | FAGE eddy covariance | Not reported | Not reported | Downward OH fluxes and upward HO2 | 88 |
| INTEX-A (see also Table 2 for marine environments) | 2004 | July–August | North America and western Atlantic Ocean | Aircraft | FAGE | ∼0.25 pptv (median near surface) | ∼30 pptv (median near surface) | Observed to modelled ratio up to 5 at high isoprene (>2 ppbv). Good model agreement for HO2 near surface | 182 |
| HOxComp | 2005 | July | Julich, Germany, 51° N, 6° E | Ground | FAGE, CIMS | 5–15 × 106 molecule cm−3 (noon) | ∼2–10 × 108 molecule cm−3 (noon) | Good agreement between model and observations for OH under high isoprene low NOx (fresh isoprene emissions) | 203, 275 |
| GABRIEL | 2005 | October | Suriname, South America | Aircraft | FAGE | 0.25 pptv (mean over forest) | ∼50–55 pptv (mean over forest) | Observed to modelled ratio of 12.2 for OH and 4.1 for HO2 | 76, 193, 194, 196 |
| PRIDE-PRD | 2006 | July | Rural, Southern China, 25° N, 113° E | Ground | FAGE | ∼1.5 × 10⁷ molecule cm−3 (noon) | ∼1.5 × 10⁸ molecule cm−3 (noon) | Observed OH ∼ factor of 3–5 times greater than model. At NO levels <1 ppbv | 73, 74, 112 |
| AMMA | 2006 | July–August | Niger, West Africa | Aircraft | FAGE | Potentially unstable measurements | Mid-level NOx, isoprene influenced | 69, 200 | |
| BEARPEX-2007 | 2007 | August–October | Blodgett forest, California, 39° N, 120° W | Ground | FAGE | ∼7 × 10⁶ molecule cm−3 (noon) | ∼28 × 108 molecule cm−3 (noon) | Model underpredicts OH by a factor of 6 and HO2 by 25% at noon | 225 |
| OP3 | 2008 | April and July | Sabah, Borneo, 5° N, 118° E | Ground and Aircraft | FAGE | 2.5 × 10⁶ molecule cm−3 (noon) | ∼2 × 10⁸ molecule cm−3 (noon) | Factor of 10 underprediction in OH when model constrained to OH reactivity. HO2 overpredicted at ground level | 195, 197, 198, 326 |
| BEARPEX-2009 | 2009 | June–July | Blodgett forest, California, 39° N, 120° W | Ground | FAGE | 4 × 10⁶ molecule cm−3 (noon) (wave) 1.5 × 10⁶ molecule cm−3 (noon) (chem) | ∼22 pptv (noon) | Reasonable agreement between modelled and measured using chemical removal to determine OH background. HO2 overpredicted by ∼30% | 31 |
| HUMPPA–COPEC | 2010 | July–August | 62° N, 24° E | Ground | LIF (OH & HO2), CIMS (OH) | 232 |
The first hydroxyl radical measurements made in a biogenically influenced environment took place at Fritz Peak in Colarado in 1991186 in a predominantly logdepole pine forest. The campaign involved an informal OH measurement intercomparison between the National Oceanic and Atmospheric Administration (NOAA) LP-DOAS and the Georgia Tech. CIMS instruments. In general, good agreement was observed between the two measurement techniques, with occasional differences arising most likely associated with differences in the spatial coverage of the LP-DOAS measurements relative to the in situ CIMS measurements. In contrast to this good agreement, model calculations constrained to CO and CH4 only, consistently overestimated OH concentrations considerably (by up to a factor of 4). Inclusion of anthropogenic hydrocarbons that were estimated by scaling to observed NOx levels only led to small reductions in OH. Model calculations determined that 2 ppbv isoprene (acting as an efficient OH sink) if present (there were no measurements of isoprene) would be sufficient to reconcile the modelled OH with observations (assuming isoprene does not act as an OH source).
With the potential impact of biogenic VOCs demonstrated at Fritz Peak, a second campaign, the Tropospheric OH Photochemistry Experiment, TOHPE, took place at Fritz Peak and a neighbouring site at Idaho Hill from early August to early October of 1993 (Mount and Williams187 and papers therein). A much more extensive suite of natural hydrocarbon species were made during this project to allow for a meaningful comparison between radical observations and photochemical theory. In addition to the two previous OH measurements made using a LP-DOAS and CIMS, radical measurements were also performed by a LIF (at low pressure, FAGE) instrument (OH, HO2) and PERCA (sum of HO2 + RO2). Under clean conditions (NO < 500 pptv), a zero dimensional photochemical model overpredicted the OH observations by 51% on average despite being constrained to the measured biogenic VOCs which included isoprene, m-butenol, α- and β-pinene.188 It should be noted that the observed isoprene concentrations were considerably lower (ranging between 100–300 pptv) than levels required to reconcile the modelled OH with the observations during the 1991 study. A lumped model linking hydrocarbons by functional group and OH reactivity was employed for the study; degradation mechanisms for the biogenic hydrocarbons were included in model calculations, although a number of assumptions regarding product yields, owing to lack of available data were made. McKeen et al.188 suggested that undetected VOCs may have still been contributing as a significant OH sink or there may have been significant loss of HOx or RO2 to aerosol surfaces or to the ground. A one-dimensional modelling study, applicable for flat terrain with similar photochemical conditions, suggests that up to 25% of the OH loss could be caused by either surface deposition or emission of an efficient OH scavenger at the ground.189 However, the measured aerosol surface areas during the campaign were found to be too low to significantly affect radical concentrations.190 Under the low NOx conditions, HO2 observations were a factor of 6–8 times lower than model expectations and it was suggested that an unknown RO2 radical efficient at reducing HO2 but inefficient at forming HO2via reaction with NO could account for this discrepancy.188 Any reduction in the modelled HO2 concentration would reduce the modelled to measured OH discrepancy also. Observations of oxygenated VOCs such as acetaldehyde also suggest that the model mechanisms could be incomplete with modelled acetaldehyde being a factor of 4 lower than observations under clean conditions; a large missing acetaldehyde source could modify the predicted OH concentrations considerably although the impact of this was not determined explicitly during the study. In contrast, the formaldehyde observations191 were represented well by the model, particularly under clean conditions.188
In stark contrast to the Fritz Peak and Idaho Hill studies, model comparisons of OH at many other forested sites significantly underpredict observations.180,192–198 Such model failure was first observed during the AEROsols formation from BIogenic organic Carbon AEROBIC97 field project which took place in a forested region in North-western Greece.192,199 The project was characterised by high concentrations of isoprene (of the order of several ppbv) and monoterpenes (daytime levels ranging between 0.5–1 ppbv); this is in contrast to the modest isoprene concentrations observed during TOHPE, and may go some way to explaining the differences between the model results during the two studies. One focus of the AEROBIC study was improved representation of the oxidation mechanisms of isoprene and monoterpenes within the MCM model33,34 employed. Detailed degradation mechanisms for isoprene and α-pinene were integrated into the model, whilst other monoterpenes that were observed were included within the model by initial reaction with OH, O3 or NO3 according to their specific rate coefficients and the subsequent degradation was modelled using the α-pinene mechanism. This more detailed modelling approach, compared to the more lumped model used previously, may also have contributed to the differences reported in modelled to measured ratios of OH during TOHPE and AEROBIC. One key finding during AEROBIC was that the modelled OH underprediction worsened as NO concentrations decreased; a feature that has been reported since in a number of other low NOx, biogenically-influenced environments also.74,180,200
Similar findings have been reported during the Program for Research on Oxidants: Photochemistry, Emissions and Transport (PROPHET) 1998 field campaign that took place in a hardwood forest in North Michigan that consisted largely of aspen, beech, birch, oak and maple.180 Using a zero-dimensional box model based upon the RACM36 with the addition of a detailed isoprene oxidation scheme, considerable model underprediction (a factor of 2.66 on average) for OH was found. For HO2, the model reproduced the observations reasonably well, overpredicting the HO2 measured by less than 15% on average.
As observed during AEROBIC, the modelled to measured agreement for OH in PROPHET tended to be worse at the lowest NO concentrations and was particularly poor (underprediction by a factor of 6 or more) at NO < 100 pptv. In contrast, for HO2, the model displayed the greatest success at low NO. As a result, the predicted HO2/OH ratio was much higher than that measured. The disagreement between model and observations for OH may indicate a missing OH source in the model. Significant OH concentrations were observed during the nighttime201 and may indicate that a non-photolytic source of OH, for example from the ozonolysis of reactive terpenes not measured at the site, were contributing to the OH budget. In support of this, measurements of total OH reactivity at the same site during PROPHET2000 indicated that a significant fraction of OH reactivity was not measured explicitly and displayed a temperature dependence similar to that of a reactive terpene.11 Inclusion of a median daytime value of 18 pptv of an undetected terpene with a temporal profile following that of Δ3-carene, reactivity with respect to O3 of α-humulene and an OH yield of one allowed the nighttime OH profile to be replicated by the model; at these levels the OH reactivity budget determined during PROPHET 2000 could also be closed. However, the mean of all OH observations, taking into account the daytime data also, were still greater than modelled by a factor of 1.5, and the previously good model to measured HO2 agreement was reduced, with the model now overpredicting the observations by ∼30%. Mechanisms for the degradation of BVOCs are very complex and the kinetic parameters used within the model employed derived largely from smog chamber studies where NO concentrations were typically 3–5 times higher than observed during PROPHET (excepting the initial isoprene oxidation step). The authors suggested that the cycling of HO2 to OH may not be described correctly within the model under low NO, high isoprene conditions. Increasing the NO concentrations by a factor of 3 allowed the model to reproduce OH observed to within 10% and HO2 to within 25%. Although not discussed by the authors, a factor of 3 increase in NO within the model would undoubtedly perturb O3 production rates. Hofzumahaus et al.74 demonstrated that an additional cycling step of RO2 to HO2 and HO2 to OH under the low NOx conditions experienced during the Program of Regional Integrated Experiments of Pearl River Delta (PRIDE-PRD) campaign improved the modelled radical concentrations but concluded that the conversion chemistry was unlikely to involve NO or any other species that produced O3 as this would lead to a net production of O3 of ∼60 ppbv h−1 compared to the modest 2 ppbv h−1 that was observed at the site.
The PROPHET and AEROBIC projects demonstrate that under high isoprene, low NOx conditions (NO < 100 pptv) models fail to reproduce the elevated OH concentrations observed. Radical measurements performed on board the NASA DC8 aircraft during the Intercontinental Chemical Transport Experiment-A (INTEX-A)182 involving flights over North America and the western Atlantic Ocean demonstrated a strong relationship between the extent of model failure and isoprene concentration. As shown in Fig. 10, the observed to modelled ratio increased from 1–1.5 as isoprene increased from 10–500 pptv and reached 5 as isoprene levels increased to greater than 1 ppbv. A similar trend was observed during flights over tropical forests in Suriname during the Guyanas Atmosphere–Biosphere exchange and Radicals Intensive Experiment with the Learjet (GABRIEL) campaign,196 which is also shown in Fig. 10.
![(Left) The observed-to-modelled OH ratio as a function of isoprene with open circles showing data taken at <1 km altitude and SZA < 60° during INTEX-A and filled triangles showing data from PROPHET-2000 (ground-based). (Middle) The median observed OH (circles) and modelled OH (triangles) during INTEX-A as a function of isoprene. (Right) Observed to modelled ratio of [OH] during the GABRIEL campaign over the Suriname rainforest as a function of isoprene concentration, for two different models. (Reproduced from ref. 182, Copyright (2008) American Geophysical Union, reproduced by permission of American Geophysical Union (further reproduction or electronic distribution is not permitted) and ref. 196, Copyright (2010), with permission from Copernicus Publications.)](/image/article/2012/CS/c2cs35140d/c2cs35140d-f10.gif) | ||
| Fig. 10 (Left) The observed-to-modelled OH ratio as a function of isoprene with open circles showing data taken at <1 km altitude and SZA < 60° during INTEX-A and filled triangles showing data from PROPHET-2000 (ground-based). (Middle) The median observed OH (circles) and modelled OH (triangles) during INTEX-A as a function of isoprene. (Right) Observed to modelled ratio of [OH] during the GABRIEL campaign over the Suriname rainforest as a function of isoprene concentration, for two different models. (Reproduced from ref. 182, Copyright (2008) American Geophysical Union, reproduced by permission of American Geophysical Union (further reproduction or electronic distribution is not permitted) and ref. 196, Copyright (2010), with permission from Copernicus Publications.) | ||
There is some evidence that model failure in biogenically influenced regions may be limited to extremely low NOx conditions. Under moderately polluted regimes (NO ∼0.1–1 ppbv), the modelled to measured OH discrepancy has been found to be greatly improved.202 During the PM2.5 Technology Assessment and Characteristics Study-New York (PMTACS-NY) Whiteface Mountain campaign that took place within a deciduous forest canopy, observations of OH, HO2 and OH reactivity were in reasonable agreement with box model predictions based on RACM202 with median modelled to measured ratios of 0.82 and 1.21 for OH and HO2 (daytime) respectively. Isoprene was found to contribute to only a small fraction of the total OH reactivity at Whiteface Mountain (isoprene typically less than 1 ppbv), in contrast to the PROPHET site, suggesting significant differences in biogenic emissions and may indicate that the missing source of OH may be directly related to isoprene under low NO conditions. As shown in Fig. 11, Hofzumahaus et al.74 noted during PRIDE-PRD that box model calculations based on the RACM and constrained with a total OH reactivity measurement were able to replicate morning observations of OH, when NO concentrations were greater than 1 ppbv, but when NO concentrations dropped (to below 200 pptv) in the afternoon the measured OH was significantly larger than predictions. This site, although not forested, was significantly influenced by substantial isoprene emissions. Stone et al.200 did not observe any dependence of model success for HO2 on isoprene levels during aircraft measurements over West Africa as part of the African Monsoon Multidisciplinary Analyses (AMMA) project. NO levels ranged from 5–300 pptv, which was sufficient to efficiently recycle isoprene derived RO2 radicals to HOx by reaction with NO within the model. Only modest levels of radical recycling were required to reproduce radical measurements during the ambient observational period of the HOxComp field campaign made in a mixed deciduous forest in a rural area close to Jülich in Germany.203 During the campaign isoprene levels ranged from 0.3–2 ppbv and NO concentrations fell as low as 0.1 ppbv. OH and HO2 were detected by four different instruments204 and base model simulations were able to reproduce radical concentrations reasonably well (RACM model to measured ratio of 0.83–1.33 and 0.72–0.97 for OH and HO2 respectively203). An increasing underestimation of OH using a zero-dimensional model based on the MCMv3.2 was observed as NO concentrations decreased, reaching 65% at NO < 0.2 ppbv.203 This missing OH source is in qualitative agreement with the earlier studies discussed above but is quantitatively much lower. The isoprene and NO mixing ratios observed during HOxComp are comparable to those encountered during PRIDE-PRD, where modelled OH underpredicted observations by a factor of 8. Kanaya et al.203 suggest that this apparent discrepancy between HOxComp and PRIDE-PRD may result from the Jülich site experiencing fresh isoprene emissions rather than photochemically aged air in which second or third generation products of VOC oxidation would be present. However, the total OH reactivity (which was well represented in the models) was higher during PRIDE-PRD (∼20 s−1) compared to HOxComp (∼8 s−1), implying that PRIDE-PRD took place under a more NOx-limited regime.
 | ||
| Fig. 11 Comparison of measured (red line) and modelled diurnal profiles of OH and HO2 during the Pearl River Delta Campaign (PRIDE-PRD), China. The blue solid line represents the base case RACM model results and the dashed line the results from the extended RACM model with enhanced HO2 and RO2 recycling. (Reproduced from ref. 22, Copyright (2009), with permission from American Association for the Advancement of Science.) | ||
In recent years, measurements of radicals in and above tropical rainforests have become available.76,197,198 Within these regions, NO concentrations are extremely low, (mean NO ∼ 20 pptv), and emissions of highly reactive biogenic VOCs are large. Global modelling studies205,206 predict that OH concentrations will be severely depleted in tropical forested regions owing to the high BVOC emissions and, as a consequence, isoprene levels build up in the modelled boundary layer (to unrealistic values) and the lifetime of methane in these areas is extended considerably. To circumvent this problem, and to give agreement with measured concentrations of isoprene, isoprene emissions are typically reduced by factors of two or more within global models.207 However, such reductions are at odds with the most up to date global emissions inventories208 indicating that the oxidative capacity and, hence, the rate of processing and ultimate rate of removal of isoprene, is likely sustained in rainforests, despite high biogenic emissions; similar to findings from mid-latitude forests, as discussed above.
During the Guyanas Atmosphere–Biosphere exchange and Radicals Intensive Experiment with the Learjet (GABRIEL) campaign, OH and HO2 observations were made over the Amazonian rainforest.76,193 Model simulations were carried out using both the European Centre for Medium-Range Weather Forecasts-Hamburg/Module Earth Submodel System (ECHAM5/MESSy) global chemistry–climate model193,194 and the Module Efficiently Calculating the Chemistry of the Atmosphere (MECCA) box model,193,196 using chemistry derived from the MCM.33,34 Significant underestimates in the observed HOx concentrations were apparent, with mean observed to modelled ratios of 12.2 ± 3.5 and 4.1 ± 1.4 for OH and HO2 respectively;196 similar to the model to measured discrepancies observed during INTEX-A under high isoprene loadings.
Similarly large discrepancies were observed between models constrained by the MCM and observations of OH during ground198 and airborne197 measurements made in the Sabah region of the Borneo rainforest during the Oxidant and Particle Photochemical Processes (OP3) project.209 With the additional constraint of a measurement of total OH reactivity, the magnitude of the missing OH source at the ground (4 m) was determined to be approximately a factor of 10 greater than the sum of the known OH sources used to constrain the model, as shown in Fig. 12; whilst flights over isoprene influenced regions above the Borneo rainforest determined a mean observed to modelled ratio of ∼5 for OH. In contrast to the large model underestimates of HO2 reported during the GABRIEL and INTEX-A projects, airborne HO2 was reasonably well represented by models containing standard chemistry with a mean observed to modelled ratio of 1.18; the model was found to slightly overestimate HO2 observations at the ground site. Similar trends were observed during the PRIDE-PRD project74 with the standard model reproducing the HO2 observations well for the entire day whilst OH was significantly underpredicted under low NO conditions. One possible explanation for the differences in the model to observed HO2 ratios reported during GABRIEL and INTEX-A compared to the ratios reported from PRIDE-PRD and OP3 may in part be caused by instrumental differences or interferences that have recently been identified and discussed in Section 3.1. Fuchs et al.30 demonstrated that LIF instruments that rely on chemical titration of HO2 to OH with NO for HO2 detection can suffer positive bias (to varying degrees) by partial chemical conversion of certain RO2 radicals to OH. Alkene-derived RO2 species, formed by OH addition rather than H-atom abstraction, have the potential to interfere with the HO2 measurement, owing to fast decomposition of the RO radical that forms in the presence of NO in the FAGE detection cell, ultimately generating OH. Under the operating conditions employed during the OP3 campaign the ground-based FAGE system was relatively insensitive to this interference.210 The high pumping capacity and fast gas throughput of the fluorescence cell, coupled with incomplete mixing of NO into the ambient air stream for HO2 titration effectively minimised the interference from the ambient RO2 radicals present. Experiments revealed that decomposition of ethene-derived RO2 radicals contributed a 12% HO2 yield. Model simulations suggest, as an upper limit, 10% of the HO2 signal observed during OP3 may be attributed to RO2 radicals. For the aircraft measurements during OP3, model simulations show that, on average, 23% of the measured HO2 may be due to an interference from RO2 radicals. Fuchs et al.30 found that RO2 species formed from alkene and aromatic precursors were detected as OH with relative sensitivities greater than 80% with respect to that for HO2 in their FAGE system, corresponding to an estimated interference of 30% during PRIDE-PRD, whilst a relative sensitivity of 60% was determined for the Penn State instrument used during INTEX-A.31 These findings highlight that the level of the interference is highly dependent upon cell designs and set-ups. Accounting for this artefact signal would help to reduce the large underprediction of HO2 reported during GABRIEL and INTEX-A; the magnitude of the reduction would ultimately depend upon the RO2 loading in each environment as well as the relative sensitivity of each instrument to these species.
![Diurnal profile of measured OH concentrations during the OP-3 campaign in Borneo (black line) together with model calculations constrained by the measured OH reactivity and various source terms (Scenarios 1–5). Unless a significant OH recycling term during the oxidation of isoprene is included, the measured/modelled ratio of [OH] is high. (Reproduced from ref. 198, Copyright (2011), with permission from Copernicus Publications.)](/image/article/2012/CS/c2cs35140d/c2cs35140d-f12.gif) | ||
| Fig. 12 Diurnal profile of measured OH concentrations during the OP-3 campaign in Borneo (black line) together with model calculations constrained by the measured OH reactivity and various source terms (Scenarios 1–5). Unless a significant OH recycling term during the oxidation of isoprene is included, the measured/modelled ratio of [OH] is high. (Reproduced from ref. 198, Copyright (2011), with permission from Copernicus Publications.) | ||
5.1. Novel OH sources under BVOC rich, NOx poor conditions
The growing dataset supporting a large unknown OH source in VOC rich NOx poor environments has, in recent years, sparked considerable interest in the atmospheric community, and has led to a range of novel mechanisms being identified that could provide a significant source of OH under biogenically influenced conditions and potentially resolve the discrepancies between models and observations that have been discussed above.Lelieveld et al.193 propose that the missing OH in the model for GABRIEL may derive from potential OH producing channels in HO2 + RO2 reactions. Production of OH in certain HO2 + RO2 reactions has been observed directly by Dillon and Crowley,211 and has been inferred by product studies.212–216 Inclusion of OH production in reactions of HO2 with peroxy radicals derived from isoprene (ISOPO2) in the MECCA box model provided a marked improvement in model success for OH and HO2.193,196 However, high branching ratios for OH producing channels (200 to 400%) were required in the model, and generation of OH in reactions of HO2 with RO2 radicals has thus far only been observed for RO2 radicals containing acyl, -carbonyl, -hydroxy or -alkoxy functionalities.211–216 The observed branching ratio for OH production from RO2 radicals structurally similar to ISOPO2 has been given an upper limit of 6%.211 Hofzumahaus et al.74 found that the inclusion of an additional OH production channel from HO2 + RO2 reactions within the RACM model constrained by total OH reactivity was not able to reproduce OH observations during PRIDE-PRD. Instead an unidentified species able to convert RO2 to HO2 and HO2 to OH independently of NO and without producing O3 was necessary to replicate diurnal cycles of OH and HO2 as shown in Fig. 13. Similarly, ground observations of OH and HO2 made during OP3 could be reproduced if 0.74 ppbv NO equivalent of an unknown species able to convert HO2 to OH at the same rate of NO was included in model calculations.198
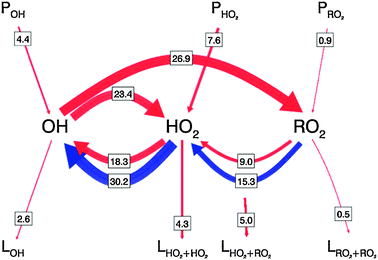 | ||
| Fig. 13 Schematic of the chemistry of tropospheric OH radicals during PRIDE-PRD as proposed by Hofzumahaus et al. (2009).22 The arrows represent chemical processes which generate (P), remove (L) or interconvert radicals with the width of the arrows scaled to reactions rates (ppbv h−1) at 12:00 LT, given by the numbers in the boxes. The red arrows represent known reaction pathways and the blue arrows the additional recycling processes required to maintain the high levels of OH observed. (Reproduced from ref. 22, Copyright (2009), with permission from American Association for the Advancement of Science.) | ||
In chamber studies Paulot et al.217 demonstrated that the reaction of OH with isoprene–hydroxy-hydroperoxides (ISOPOOH), produced in the reaction of isoprene derived peroxy radicals (ISOPO2) with HO2, can lead to the formation of epoxide species with regeneration of OH under low NOx conditions. Density functional theory (DFT) calculations have predicted the unimolecular decomposition of β-ISOPO2 radicals (the dominant ISOPO2 isomers), resulting in production of OH, formaldehyde and (depending on the isomer) MVK or MACR.218 However, the rates of decomposition are expected to be slow, and may not be sufficient to compete effectively with the bimolecular reactions of ISOPO2 radicals with HO2 and NO in all but the most remote environments.218 Theoretical investigation of the OH-initiated oxidation of isoprene using ab initio quantum calculations by the Leuven group has also led to the proposal of HOx radical production following unimolecular processes in ISOPO2 radicals.219–221Fig. 14 shows the calculated pathways for the OH-initiated oxidation of isoprene, which is referred to as the “Peeters' mechanism” or “Leuven Isoprene Mechanism” (LIM).
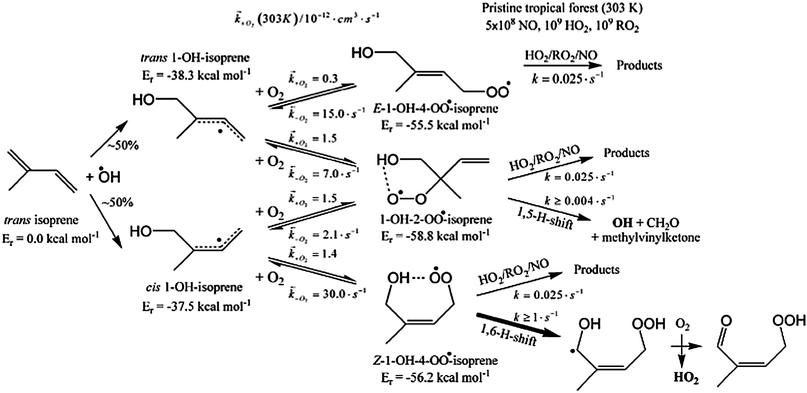 | ||
| Fig. 14 Outline of the initial steps in the Leuven Isoprene Mechanism, also known as the Peeters' mechanism, with their predicted rates, following 1-OH addition to isoprene. (Reproduced from ref. 219, Copyright (2009), with permission from the PCCP Owner Societies.) | ||
Under low NOx conditions, the fastest pathways occur through unimolecular 1,6-H shifts in two of the isomeric ISOPO2 radicals, producing HO2 and unsaturated hydroperoxy-aldehydes (HPALDs). The HPALD products have recently been demonstrated to photolyse with an OH yield of ∼1,31,222 owing to the combination of the −OOH hydroperoxide moiety and an O![[double bond, length as m-dash]](https://www.rsc.org/images/entities/char_e001.gif) C–CC chromophore, thereby increasing the yield of both OH and HO2.219 Subsequent chemistry of the organic fragments of HPALD photolysis, resulting in rapid production of photolabile peroxy-acid–aldehydes (PACALDs), is also expected to increase the OH and HO2 yields further.219–221 A number of modelling studies have assessed the potential impact of these modified isoprene mechanisms.197,223–226 A global modelling study by Stavrakou et al.223 using the Intermediate Model of Global Evolution of Species – version 2 (IMAGESv2) global chemistry transport model has shown that the Peeters' mechanism is able to reproduce average boundary layer concentrations of OH and HO2 observed during GABRIEL and INTEX-A aircraft campaigns to within 30%. Implementation of the Peeters' mechanism in this model increased the modelled OH concentrations by a factor of up to 4 over densely vegetated areas, and increased the HO2 concentrations by a factor between 2.5 and 3.223 The epoxide scheme,217 however, gave increases in OH concentration by a factor of only 0.25 in the same model framework223 and could not replicate the observations. Hofzumahaus et al.74 rejected additional HOx initiation pathways, as inclusion in model calculations caused an overestimation in previously well replicated HO2 concentrations; a finding also supported by model-measurement comparisons conducted as part of the OP3 project.197,198 It is worth noting that the RO2 interference discussed above in Section 3.1 was not known about at that time and was not considered by Stavrakou et al.223 The conclusion of an improved modelled to measured agreement for HO2 measured during INTEX-A and GABRIEL when the Peeters' mechanism is incorporated may need to be reevaluated if there were an interference experienced during these campaigns.
C–CC chromophore, thereby increasing the yield of both OH and HO2.219 Subsequent chemistry of the organic fragments of HPALD photolysis, resulting in rapid production of photolabile peroxy-acid–aldehydes (PACALDs), is also expected to increase the OH and HO2 yields further.219–221 A number of modelling studies have assessed the potential impact of these modified isoprene mechanisms.197,223–226 A global modelling study by Stavrakou et al.223 using the Intermediate Model of Global Evolution of Species – version 2 (IMAGESv2) global chemistry transport model has shown that the Peeters' mechanism is able to reproduce average boundary layer concentrations of OH and HO2 observed during GABRIEL and INTEX-A aircraft campaigns to within 30%. Implementation of the Peeters' mechanism in this model increased the modelled OH concentrations by a factor of up to 4 over densely vegetated areas, and increased the HO2 concentrations by a factor between 2.5 and 3.223 The epoxide scheme,217 however, gave increases in OH concentration by a factor of only 0.25 in the same model framework223 and could not replicate the observations. Hofzumahaus et al.74 rejected additional HOx initiation pathways, as inclusion in model calculations caused an overestimation in previously well replicated HO2 concentrations; a finding also supported by model-measurement comparisons conducted as part of the OP3 project.197,198 It is worth noting that the RO2 interference discussed above in Section 3.1 was not known about at that time and was not considered by Stavrakou et al.223 The conclusion of an improved modelled to measured agreement for HO2 measured during INTEX-A and GABRIEL when the Peeters' mechanism is incorporated may need to be reevaluated if there were an interference experienced during these campaigns.
Recent chamber studies under low NOx conditions227 provide experimental evidence that HPALDs do form during OH-initiated isoprene oxidation, supporting the Peeters' mechanism, but the observed rate of formation was approximately 50 times slower than calculated by the Leuven group. Similarly, Karl et al.228 found that to reconcile the Peeters' mechanism with the observed OVOC ratios (specifically methacrolein (MACR), methyl vinyl ketone (MVK) and hydroxyacetone) during the Amazonian Aerosol Characterization Experiment (AMAZE) campaign would require the 1,6-shift decomposition rate and the reverse reaction rates of the Z-1-OH-4-OO* and Z-4-OH-1-OO* peroxy radicals to be reduced. Such an adjustment would lead to a corresponding reduction in the overall HOx yield from the Peeters' mechanism, with an approximate yield of 0.1 HO2 and 0.12 OH radicals, thus significantly reducing the overall potential of the mechanism to regenerate HOx.
Pugh et al.,195 using the Cambridge tropospheric trajectory model of chemistry and transport (CiTTyCAT) to assess the chemistry during OP3, suggest that a 50% reduction in the rate coefficient for reaction with OH and isoprene (caused by incomplete mixing of isoprene rich air parcels near the surface) was able to resolve the model underestimation of OH whilst maintaining agreement with measured isoprene and isoprene oxidation products. Experimental evidence suggests, however, that the degree of segregation is unlikely to be greater than 15%.229 A similar explanation of segregation was suggested by Butler et al.194 to reconcile the model with both OH and isoprene measurements during GABRIEL. In a recent innovative study, Dlugi et al.88 reported the first flux measurements of OH and HO2 using FAGE, measured at a height of 37 m, 7 m above the canopy of a mixed deciduous forest in Julich using the eddy covariance method. Fluxes of isoprene, the sum of MVK and MACR and the sum of monoterpenes were also measured using a proton transfer mass spectrometer (PTR-MS). The measurements, made during the ECHO (Emission and CHemical transformation of biogenic volatile Organic compounds) intensive field study in July 2003, showed an upward flux for HO2 out of the canopy, and a downward flux for OH. This suggests a significant local chemical sink of OH and conversion to HO2 above the canopy. For OH the measured flux is balanced by chemical production and loss, with direct transport playing no role, whereas for HO2, with a longer chemical lifetime (20 s in this study), the radical balance is significantly influenced by both chemistry and transport.88 The segregation of OH and BVOCs was also calculated for the measurements, and the effective rate constant for OH reacting with isoprene was 15% lower than the normal value due to inhomogeneous mixing of the reactants, close to that reported by Pugh et al.229
5.2. A possible OH interference in low NOx regions influenced by biogenic emissions
It would therefore not seem possible to simultaneously reconcile all field observations of OH and HO2, isoprene and isoprene oxidation products using suggestions that have been put forward relating to the OH initiated oxidation chemistry of isoprene. As discussed in Section 3.2, an alternative explanation is that the measurements made in these environments are subject to an artefact giving a positive bias. The OH observations discussed above have primarily been detected using LIF. Mao et al.31 have demonstrated that the measured OH concentration in a low NOx high BVOC environment is different depending on the method used to determine the background signal. In the first method, the background signal is determined by shifting the laser wavelength from an OH absorption line to an offline wavelength and subsequent subtraction of this background gives the OH concentration (OH-wave). In the second method, the background is determined with the laser wavelength fixed on an OH absorption line and C3F6 is periodically added to the FAGE detection cell to chemically scrub the ambient OH to determine the background signal for subsequent subtraction to give the OH concentration (OH-chem). During the Biosphere Effects on Aerosols and Photochemistry Experiment (BEARPEX)-09, the OH-chem signal agreed well with model estimates of OH derived using a RACM model constrained with standard isoprene chemistry, with no novel OH recycling mechanism required but OH-wave was significantly higher than OH-chem and the model calculations. Mao et al.31 suggest that the difference between OH-wave and OH-chem may be caused by a BVOC oxidation product rapidly forming OH within the FAGE detection cell. In support of this, the discrepancy between OH-wave and OH-chem displayed a marked temperature dependence with agreement between the two methods observed at 295 K whilst OH-wave became more than twice that of OH-chem at temperatures over 300 K. During BEARPEX-2007, modelled to measured agreement for key BVOC oxidation products such as glyoxyal230 and acyl peroxy nitrates231 improved considerably when the model was constrained to a scaled OH-wave (determined from the ratio of OH-wave to OH-chem measured during BEARPEX-09) providing indirect evidence of an OH interference using this FAGE instrument under high BVOC loadings. Owing to differences in instrumental design, for example flow geometry, pumping capacity, cell pressure, laser frequency and optical paths it is unlikely that other FAGE instruments will suffer the same level of interference. A similar FAGE instrument was compared with a CIMS instrument during the HUMPPA–COPEC (Hyytiala United Measurement of Photochemistry and Particles–Comprehensive Organic Particle and Environmental Chemistry) campaign in a boreal forest in Finland in 2010, with initial reports suggesting the observations of OH by LIF to be a factor of 10 greater than those observed by CIMS.232 Mao et al.31 suggested that interferences may also differ among different forested environments. If, for example, the interfering species is a product of ozonolysis, then, owing to the low O3 levels typically found in tropical forests (∼10 ppbv) compared to levels typically observed in Blodgett forest (mean O3 of 54 ppbv during BEARPEX-09), the artefact OH signal may be expected to be much reduced in the tropical forest. There is support for the elevated levels of OH observed during OP3198 from co-observations of formaldehyde and glyoxal made using DOAS during OP3, which could only be reproduced during model simulations if the model was constrained to the OH that was observed.2335.3. Summary of model measurement comparisons in regions influenced by high biogenic emissions
Observations of hydroxyl and hydroperoxy radicals in environments containing high levels of biogenic emissions and comparison with detailed chemical box models have revealed major gaps in our understanding of the oxidation processes occurring in these regions. In fact, some of the largest discrepancies between measured and modelled OH have occurred in recent studies in these environment. The earliest measurement studies highlighted the importance of constraining models with a complete inventory of OH sinks and demonstrate that large model overpredictions of OH can occur if there are major omissions. In regions influenced by a diverse range of VOC such as forests, a measurement of the total OH reactivity can be extremely useful in testing the completeness of a model.Isoprene levels were modest during the Fritz Peak/Idaho Hill studies. In the more recent studies in a range of forested environments, a clear trend between models and observations has emerged particularly in isoprene rich, NOx poor environments with models consistently underpredicting the OH concentrations observed by a considerable amount, sometimes by a factor of 10. Evidence supporting this finding is limited to studies undertaken under extremely low NOx conditions, which suggests that the mechanisms for VOC oxidation are less well understood when reactions between peroxy radicals and NO do not dominate.
The ability of models to reproduce HO2 in these regions is more variable with a number of model comparisons underpredicting HO2, whilst others reproduce concentrations and diurnal profiles well despite similar VOC and NOx loadings. Some of this discrepancy may be resolved by taking into account the recently discovered RO2 interference that will impact HO2 measurements made using FAGE instruments to varying degrees depending upon the instrumental set-up and ambient RO2 loadings. HO2 sinks may also be poorly represented within models and could vary between the different measurement sites, and better constraints of these may also help to resolve the differences observed.
Very recently, OH artefact signals have been identified in one FAGE system, and believed to be limited to measurements undertaken under VOC rich conditions at higher temperatures, although the species causing the interference are yet to be identified. The extent of any potential interference suffered by other FAGE systems will likely depend upon individual instrumental design. Indirect evidence from the measurement and modelling of isoprene oxidation products can be used to support or otherwise refute the elevated OH levels observed during these forested campaigns.
Recent laboratory, chamber and theoretical studies have helped to better constrain the isoprene oxidation mechanism. To date, however, not one mechanism can satisfactorily reconcile all OH and HO2 observations that have been made in these environments influenced by large emissions of biogenic VOCs.
A process not considered routinely in the models described above is the excitation of weak absorption features, for example vibrational overtone transitions in organic peroxides,307 which are hypothesised to promote photolysis to form HOx. However, constraints on the rate of certain key processes that have been suggested, for example the photolysis and OH reactivity of HPALDs, are beginning to emerge from intense activity both in the laboratory and in instrumented chamber studies.
6. Studies in polluted environments
6.1. Urban conurbations
While marine and forested regions cover a significant proportion of the globe, atmospheric composition and air quality in urban regions have the greatest direct impact on human health, as more than 50% of the world's population now reside in urban conurbations.234 Despite this, there have been relatively few field experiments to investigate HOx chemistry in urban areas, largely as a result of problems associated with supporting measurements of the large numbers of VOCs present in such environments. Measurements of OH reactivity can help in such circumstances, enabling quantification of the total sink for OH, which includes reaction of OH with species, either directly emitted or secondary oxidation products, that are not measured directly.Table 4 provides a summary of measurements and model comparisons for OH and HO2 in polluted urban environments. Earlier measurements in urban areas have been reviewed by Heard and Pilling23 and by Kanaya et al.81
| Campaign | Year | Dates | Location | Platform | Technique | OH measured | HO2 measured | Comments | Ref. |
|---|---|---|---|---|---|---|---|---|---|
| LAFRE | 1993 | September | Claremont, Los Angeles, USA, 34° N, 117° W | Ground | LIF | Midday 5.5 × 10⁶ molecule cm−3 | Midday 2 × 10⁸ molecule cm−3 | OH overpredicted by up to 50%; HO2 overpredicted | 250 |
| SOS | 1999 | June–July | Nashville, Tennessee, USA, 36° N, 88° W | Ground | LIF | 0.8 pptv at noon | 80 pptv at noon | OH observed to modelled ratio of 1.33; HO2 observed to modelled ratio of 1.56 | 8, 235, 327 |
| PUMA-1 | 1999 | June | Birmingham, UK, 53° N, 2° W | Ground | LIF | 3 × 10⁶ molecule cm−3 at midday | 1.5–10 × 108 molecule cm−3 at midday | OH observed to modelled ratio of 0.58; HO2 observed to modelled ratio of 0.49 | 236–239 |
| PUMA-2 | 2000 | January–February | Birmingham, UK, 53° N, 2° W | Ground | LIF | 1.5 × 10⁶ molecule cm−3 at midday | 1–5 × 10⁸ molecule cm−3 at midday | OH observed to modelled ratio of 0.50; HO2 observed to modelled ratio of 0.56 | 236–239 |
| TEXAQS | 2000 | August–September | Houston, Texas, USA, 29° N, 95° W | Ground | LIF | Midday maximum ∼0.8 pptv | Midday maximum ∼30 pptv | — | 258 |
| PMTACS-1 | 2001 | June–August | New York, USA, 41° N, 74° W | Ground | LIF | 5–20 × 106 molecule cm−3 | 0.6–6 × 10⁸ molecule cm−3 | OH observed to modelled ratio of 1.1; HO2 observed to modelled ratio of 1.24 | 241, 242, 244, 258 |
| MCMA | 2003 | April | Mexico City, Mexico, 19° N, 100° W | Ground | LIF | Median midday 7 × 10⁶ molecule cm−3 | Median midday 40 pptv | RACM model reproduced OH and HO2 within combined uncertainties, with a tendency for overprediction of OH at noon; MCM model gave good agreement for OH, apart from in the early morning, and a significant underprediction of HO2, particularly at high NO | 249, 255, 256, 258 |
| TORCH | 2003 | July–August | Writtle, Essex, UK, 51° N, 0° E | Ground | LIF | 1.2–7.5 × 10⁶ molecule cm−3, with mean 2.6 × 10⁵ molecule cm−3 at night | 0.16–3.3 × 10⁸ molecule cm−3, with 2.9 × 10⁷ molecule cm−3 at night | Daytime OH and HO2 overpredicted by 24% and 7%, respectively; nighttime OH and HO2 underpredicted by 41% and 16%, respectively | 13, 246–248 |
| IMPACT IV | 2004 | January–February | Tokyo, Japan, 35° N, 139° E | Ground | LIF | 1.5 × 10⁶ molecule cm−3 at midday | 1.1 pptv at midday | OH well reproduced by model calculations; HO2 underpredicted | 81, 328 |
| PMTACS-2 | 2004 | January–February | New York, USA, 41° N, 74° W | Ground | LIF | 1.4 × 10⁶ molecule cm−3 | 2 × 10⁷ molecule cm−3 | OH observed to modelled ratio of 0.98; HO2 observed to modelled ratio of 6, with the greatest values at high NO | 243, 244 |
| IMPACT L | 2004 | July–August | Tokyo, Japan, 35° N, 139° E | Ground | LIF | 6 × 10⁶ molecule cm−3 at midday | 5.7 pptv at midday | OH well reproduced by model calculations; HO2 overpredicted | 81, 328 |
| MILAGRO | 2006 | March | Mexico City, Mexico, 19° N, 100° W | Ground | LIF | 4.6 × 10⁶ molecule cm−3 | 1.9 × 10⁸ molecule cm−3 | OH overpredicted by a factor of 1.7 at midday, well reproduced after 1430 hours; HO2 underpredicted in the morning, well reproduced after 1130 hours | 78, 251–254, 257 |
| Houston | 2006 | August–September | Houston, Texas, USA, 29° N, 95° W | Ground | LIF | Midday maximum ∼ 0.6 pptv | Midday maximum ∼ 50 pptv | Observations of OH and HO2 generally greater than modelled concentrations | 258, 259 |
Observations of OH and HO2 by LIF-FAGE were combined with determination of OH reactivity during the Southern Oxidant Study (SOS) in the polluted metropolitan environment of Nashville in 1999, representing the first direct measurements of OH reactivity in the atmosphere.8,235 The reactivity measurements indicated that 30% of the total OH reactivity in Nashville resulted from VOCs that are not routinely measured during intensive field studies or by the US Environment Protection Agency (EPA) Photochemical Assessment Monitoring Stations,8 and enabled analysis of the HOx data in light of this information.235
The diurnal behaviour of OH and HO2 during SOS was well described by a box model run to steady state, although the daytime measured mixing ratios of OH (noontime maximum 0.8 pptv) and HO2 (noontime maximum 80 pptv) were 1.33 and 1.56 times higher than the modelled values, respectively.235 Photolysis of O3 and HCHO were the main daytime HOx sources, with strong influences from biogenic emissions and alkene ozonolysis reactions, representing 8% of the total daytime HOx production and 95% of the modelled nighttime production.235 Production of HO2 following NO3 + alkene chemistry was not included in the model, but was expected to represent a similar nighttime source strength to that of the ozonolysis chemistry.235 While the NO3 chemistry may partly explain the model discrepancies at night, when the modelled HO2 was a factor of 2 to 8 times too low and modelled OH was a factor of 10 to 100 too low, significant uncertainty remains regarding nighttime HOx chemistry.235 The dominant HOx sink during the campaign was found to be OH + NO2, representing 50% of the total HOx loss, with other contributions from HO2 + RO2 and net formation of HONO and HO2NO2.235
In the same year as the SOS study in Nashville, the PUMA (Pollution of the Urban Midlands Atmosphere) campaign investigated urban air pollution and atmospheric chemistry in the UK.236 Comparisons of summer (1999) and winter (1999/2000) FAGE measurements of OH and HO2 in Birmingham during PUMA showed that noontime OH concentrations in winter (∼1.5 × 10⁶ molecule cm−3) were only a factor 2 lower than the equivalent measurements in summer (∼3.0 × 10⁶ molecule cm−3), despite a factor of 15 reduction in OH production following photolysis of ozone.237 A box model, using the MCM and constrained to 15 min average measurements of long-lived species, yielded modelled to measured ratios of 0.58 and 0.50 for OH between the hours of 1100 and 1500 for the summer and winter datasets, respectively.238 Concentrations of HO2 were found to be similar between the summer and winter campaigns,237 and were also underpredicted by the model.238 The modelled to measured ratios of 0.56 and 0.49 were obtained for HO2 between 1100 and 1500 for summer and winter, respectively.238 Sensitivity analyses on the model were unable to identify potential sources of the discrepancy, although the modelled concentrations of OH and HO2 were found to be highly sensitive to changes in NOx.238
Alkene ozonolysis reactions were found to dominate OH production in both summer and winter during PUMA, contributing 46 and 62% of the total OH production, respectively, and largely responsible for the maintenance of relatively high OH concentrations during the winter campaign.237,239 In summer, production from O3 photolysis comprised 24% of the total OH production, but only 0.6% in winter.237,239 Production of HO2 was dominated in summer and winter by the photolysis of HCHO and other carbonyl compounds.237,239
The role of alkene ozonolysis reactions in HOx production was also investigated in a study in Tokyo, which found that although ozonolysis reactions were important for daytime winter HOx production and production at night during summer and winter, carbonyl photolysis and HONO photolysis were also important in summer and winter.81 During the winter (January–February 2004), median daytime peaks of 1.5 × 10⁶ molecule cm−3 and 1.1 pptv were observed for OH and HO2, respectively, compared to values of 6.3 × 10⁶ molecule cm−3 and 5.7 pptv for OH and HO2, respectively, during the summer (July–August 2004).81 A box model using RACM chemistry was generally able to reproduce the daytime OH observations in summer and winter, but HO2 was underestimated in winter and overestimated in summer as shown in Fig. 15.81
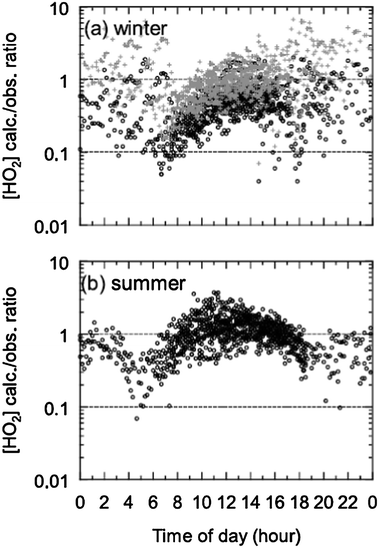 | ||
| Fig. 15 Diurnal variations in the calculated to observed ratio for HO2 in (a) winter and (b) summer during the IMPACT campaigns in Tokyo in 2004 showing the model underestimate in winter and overestimate in summer. (Reproduced from ref. 81, Copyright (2007) American Geophysical Union, reproduced by permission of American Geophysical Union. Further reproduction or electronic distribution is not permitted.) | ||
Inhomogeneities in NOx concentrations were proposed as a source of uncertainty in the model results, since the NOx measurements were made at a distance of 250 m from the OH and HO2 measurements.81 In addition, concurrent measurements of OH reactivity during winter provided evidence for missing OH sinks.82,83,240 Inclusion of additional alkanes and alkenes in the model analysis for OH and HO2 yielded increases in the modelled HO2, owing to HOx production through ozonolysis of the additional alkenes, but had little impact on the modelled OH owing to a balance between the increase in HOx production through ozonolysis and an increase in OH loss through OH + alkane and OH + alkene reactions.81
In contrast to the results obtained in Tokyo and in Birmingham during the PUMA campaign, the PMTACS (PM2.5 Technology Assessment and Characteristics Study) study in New York in summer 2001 found that photolysis of HONO was the dominant HOx source during the day, constituting ∼56% of the total daytime HOx production as a result of high HONO concentrations (∼1.4 ppbv on average in the morning).241,242 Unfortunately, HONO observations were not made during PUMA,236 and were only made in the winter campaign in Tokyo.81 Alkene ozonolysis reactions were found to represent only 10% of the total daytime HOx sources in New York, and were only of significance during the night.242 Loss of HOx was dominated (99.3%) by the reaction of OH with NO2,242 with average NO2 levels of ∼20–30 ppbv.241 In this study, daytime maximum OH concentrations of 5–20 × 106 molecule cm−3 were observed, and reproduced by a box model using RACM chemistry with an observed to modelled ratio of 1.10 during the day.241,242 Daytime maximum HO2 concentrations of 0.4–6 × 10⁸ molecule cm−3 were observed, and the model was able to reproduce daytime and nighttime HO2 with an average observed to modelled ratio of 1.24.241,242 The OH reactivity measurements were reproduced by model calculations to within 10%.242
A subsequent study in the same location in New York in winter 2004 observed maximum OH mixing ratios of 0.05 pptv (1.4 × 10⁶ molecule cm−3) and maximum HO2 of 0.7 pptv (2.0 × 10⁷ molecule cm−3), approximately one fifth of the concentrations observed in the same location in summer 2001.243 The daytime OH observations were well reproduced by the RACM-based model, with a median measured to modelled ratio of 0.98, although both day and night HO2 were significantly underpredicted, with a daytime median measured to modelled ratio of 6 and a notably increased discrepancy at high concentrations of NO.243
Sources and sinks of HOx were found to be similar between the summer and winter campaigns.243 Average HONO concentrations peaked in the morning at a value of approximately 700 pptv, approximately half that observed in the summer campaign,242 decreasing to ∼300 pptv at midday and then increasing to ∼600 pptv in the afternoon, and HONO photolysis was responsible for 48% of the total HOx production, followed by alkene ozonolysis reactions (36%) and HCHO photolysis (6%).243 Photolysis of O3, followed by reaction of O(1D) with water vapour, represented only 1% of the total HOx source at the low solar intensities and low O3 mixing ratios (∼20 ppbv on average) in winter,243 compared to 13% of the total HOx production in the summer campaign,242 with the total rate of OH production from O3 photolysis decreased by a factor of ∼25 in the winter campaign compared to the summer campaign owing to the differences in O3, solar intensities and water vapour concentrations. Reaction of OH with NO2 dominated HOx loss in both summer and winter, and constituted an average of 95% of the total HOx sink in winter.243
An Air Quality Forecast Modelling System (AQFMS) consisting of a chemical transport model coupled to a mesoscale meteorological forecasting model used to predict air quality and provide warnings regarding air pollution for the Northeastern United States significantly underpredicted HONO, and thus HOx, for both the summer 2001 and winter 2004 campaigns in New York.244 The underprediction for OH was worse for the winter data than for summer, indicating greater uncertainties with the chemical mechanism for winter conditions.244
Differences between the radical concentrations observed in New York and those observed in Birmingham during the PUMA campaign were attributed to higher NOx:VOC ratios in New York, which would drive the OH:HO2 partitioning towards OH and increase the efficiency of OH + NO2.243 The NO2 concentrations in Birmingham were generally between 10 and 30 ppbv,236 while those in New York were typically between 20 and 30 ppbv,243 with VOC concentrations up to a factor of two higher in Birmingham (e.g. benzene was ∼500 pptv on average) compared to New York.243,245 Average temperatures in New York were also approximately 10 °C lower than those in Birmingham, which may have contributed to decreased radical production rates.243
High temperatures and high ozone mixing ratios (>110 ppbv) were encountered during a heatwave in the TORCH (Tropospheric ORganic CHemistry experiment) campaign near London in summer 2003 and, on average, alkene ozonolysis represented only 29% of the total OH source, equivalent to that of HONO photolysis (using modelled HONO concentrations) and less important than O(1D) + H2O (42%).246,247 Observed daytime maxima in OH during TORCH were in the range 1.2–7.5 × 10⁶ molecule cm−3, and were overpredicted by an MCM-based box model by an average of 24%.247 On several nights, up to 8.5 × 10⁶ molecule cm−3 were recorded, and were underpredicted by the model.247
Noontime maxima of 0.16–3.3 × 10⁸ molecule cm−3 were observed for HO2, and the diurnal profile for HO2 often displayed asymmetry around noon, with secondary peaks occurring in the late afternoon/early evening.247 Modelled concentrations of HO2 overpredicted the observations, but only by 7%, and such good model agreement was attributed to the inclusion of a more complete representation of HO2 loss to aerosol surfaces and the inclusion of a greater number of oxygenated VOCs compared to other campaigns.247 On average, HO2 production was achieved through photolysis of dicarbonyls (44%), aldehydes (29%) and HCHO (24%). Loss of HO2 was dominated throughout the campaign by loss to aerosol surfaces (83%), although a high value for HO2 aerosol uptake was used in this study (γHO2 = 0.5), with an 18% decrease in modelled HO2 concentrations when γHO2 was changed from 0.02 to 1.0. Loss of OH was dominated by reaction with NO2 (57%) and NO (16%).247
The elevated O3 concentrations during the TORCH campaign (>110 ppbv at times246) also led to significant radical production at night, primarily through alkene ozonolysis reactions.248 Observed mean nighttime concentrations of OH and HO2 were 2.6 × 10⁵ molecule cm−3 and 2.9 × 10⁷ molecule cm−3, respectively, but in contrast to the daytime study, the nighttime observations were underpredicted by the model by 41% for OH and 16% for HO2.248 Direct production of OH and HO2 at night was dominated by alkene ozonolysis reactions (99.6% and 92.1%, respectively), with production of RO2 split between ozonolysis reactions (66%) and reactions of alkenes with NO3 (33%).248
Although the high O3 concentrations and high temperatures observed during TORCH are somewhat anomalous for the UK, such conditions are not unusual in other locations. High concentrations of ozone are common in locations such as Los Angeles and Mexico City, with a median observed O3 of 115 ppbv in Mexico City in April 2003,249 similar to that observed in the UK during the TORCH heatwave.246,248 Experiments have been performed to investigate the HOx chemistry occurring in Los Angeles smog in 1993250 and in ambient conditions in the Mexico City Metropolitan Area (MCMA) in April 2003249 and March 2006.78,251–254
The Los Angeles experiments were conducted in late September to coincide with the highest ozone levels in the Los Angeles basin.250 Midday OH concentrations were approximately 5.5 × 10⁶ molecule cm−3, and although model calculations were able to reproduce the observations early and late in the day, the modelled OH at midday was generally 50% too high.250 Similarly, the HO2 observations were well reproduced by the model in the early morning, but the observed midday concentrations of approximately 2 × 10⁸ molecule cm−3 were overpredicted by the model.250 Constraining the model to the observed HO2 concentrations improved the simulations for OH, leading to the conclusion that the HOx sources in the model were too large, the model was missing HOx loss processes, or the parameterisation of the RO2/HO2 chemistry used in the model was inadequate to describe the complex behaviour of these radicals.
Mexico City generally suffers more pollution than typical US and European cities,249 and in April 2003, GTHOS-FAGE measurements by the Penn State group observed median midday OH concentrations of ∼7 × 10⁶ molecule cm−3 (0.35 pptv) in Mexico City, comparable to those observed in Los Angeles250 and other cities in the US.249 Observations of HO2 peaked at 1300 hours, an hour later than those for OH, with a median mixing ratio of 40 pptv – higher than recorded in most US cities.249 The HO2 observations during the Mexico City Metropolitan Area (MCMA) project were typically 8 times higher than those observed in New York in July 2001,241,242,249 resulting from large differences in the HOx sources.249 Although photolysis frequencies during the MCMA project were only 40% higher than those during the New York campaign, mixing ratios of O3 and HCHO were significantly higher during MCMA, with HCHO mixing ratios in Mexico City approximately 15 times greater than those in New York at midday and representing approximately 40% of the total HOx source.249
The similarities in the OH observations between Mexico City and New York were attributed to the buffering effects of the OH production and loss processes, while the differences in HO2 observations between the two campaigns, and the day-to-day variability in the HO2 observations during the MCMA project, were explained by the differences in the HOx sources.249 The sensitivity of HO2, but not OH, to the HOx sources and sinks was used to demonstrate the need for HO2 measurements alongside OH to provide a real test of our understanding of fast photochemistry in the atmosphere.249 Both OH and HO2 observations during the MCMA project agreed with RACM-based box model calculations within the combined measurement and modelling uncertainties, although there was a tendency for overestimation of OH by the model at midday.249 A subsequent study using the MCM (v3.1), however, found good agreement for OH for most of the day, with the exception of an underprediction in the early morning (0600–0700 hours), and a significant underprediction of HO2, particularly at high NOx levels (25–130 ppbv).255,256
Measurements of OH and HO2 were also made in the Mexico City Metropolitan Area in March 2006 as part of the Megacity Initiative: Local And Global Research Observations (MILAGRO) campaign.78,251 The MCMA-2006 measurements were made with the Indiana University FAGE instrument (IU-FAGE), with maximum median observations of 4.6 × 10⁶ molecule cm−3 OH and 1.9 × 10⁸ molecule cm−3 HO2.78 Initial modelling studies, using a box model with chemistry described by the RACM, overpredicted both OH and HO2.251 However, when the model was constrained to dicarbonyl species, using measured concentrations of glyoxal and estimated concentrations of other dicarbonyls such as methylglyoxal, the model underpredicted HO2 in the morning (0800–1130 hours), reaching an underprediction of a factor of 5 at approximately 1000 hours, and overpredicted OH by a factor of 1.7 around noon.251 Observations of HO2 were reasonably well reproduced by the model after 1130 hours, and the modelled OH was in good agreement with the observations after 1430 hours.251
The requirement for additional HO2 sources in the model in the morning was linked to elevated concentrations of benzene and toluene, and it was postulated that there may be missing sources of HO2 related to oxidation of aromatics under high NOx conditions.251 However, as discussed above, the work of Fuchs et al.30 indicates the existence of interferences in HO2 measurements by FAGE from RO2 radicals produced following oxidation of unsaturated hydrocarbons. At the current time it is unclear how such interferences may have impacted the HO2 measurements, and hence model agreement, during the MILAGRO campaign.
Analysis of the radical budgets in the model as displayed in Fig. 16 revealed that production of OH from O(1D) + H2O represented only 6% of the total daytime radical production during the MILAGRO campaign.251 The main daytime radical sources were found to be photolysis of HONO (35%) and HCHO (24%), followed by alkene ozonolysis reactions (19%) and photolysis of dicarbonyls (8%), with the alkene ozonolysis reactions dominating in the late afternoon and comprising 56% of the total radical production. In keeping with this work, a study using the WRF-CHEM (Weather Research and Forecast model coupled with chemistry) model found that additional HONO sources were required to reproduce the HOx concentrations observed during the MILAGRO campaign.257 Loss of radicals was dominated by OH + NO2 (60%) and OH + NO (20%).251
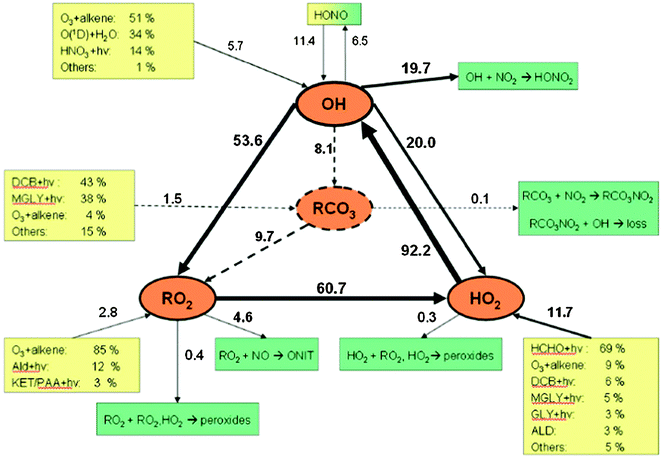 | ||
| Fig. 16 Median daytime (0840–1840 hours) radical budgets during the MCMA-2006 campaign (reproduced from ref. 251, Copyright (2009), with permission from Copernicus Publications). Rates are in 106 molecule cm−3 s−1. | ||
A comparison between observations made in Mexico City (in 2003), New York in (2001) and Houston (in 2000 and 2006) indicated that the tropospheric photochemistry in Houston was more similar to that observed in Mexico City than New York.258 Although production of HOx was dominated by photolysis of HONO and HCHO in all three locations, concentrations of OH and HO2 were found to be higher in Houston than in New York, and the ratio of VOCs to NOx in Houston was comparable to that in Mexico City, and much lower than in New York.258 Such differences arise not only from the differences in climate between the three regions, but also in the extent of air quality regulation, with VOC emissions in New York significantly reduced compared to Houston and Mexico City as a result of regulatory activity.258
The 2006 Houston measurements were examined in detail using a box model with a number of different chemical mechanisms (RACM, CB05, LaRC, SAPRC-99, SAPRC-07 and MCMv3.1).259 In general, the observed OH and HO2 concentrations were generally higher than the modelled concentrations. The differences between the various mechanisms were smallest under more polluted conditions, indicating that differences in mechanistic details are less important in polluted conditions as a result of the dominance of reactive nitrogen chemistry,259 with similar results reported by Emmerson and Evans.38
6.2. Suburban and semi-polluted continental boundary layer
Suburban and rural regions display a broad range of NOx concentrations to test our understanding of HOx chemistry over a wider variety of conditions. A number of campaigns have been conducted in such regions, summarised in Table 5, with some overlap between regions that could be considered as urban, suburban or rural. The TORCH experiments described above,13,246,247 for example, were characterised by air masses from a number of different environments, including air originating from the Atlantic Ocean and passing over mainland UK, air from the Arctic and North Sea, and the more polluted air from UK cities, such as London and Birmingham, and from mainland Europe.13,246,247 However, since the TORCH experiments in summer 2003, conducted approximately 25 miles north east of central London, were largely characterised by elevated temperatures and high levels of pollution246,247 they are included above in Section 6.1.| Campaign | Year | Dates | Location | Platform | Technique | OH measured | HO2 measured | Comments | Ref. |
|---|---|---|---|---|---|---|---|---|---|
| POPCORN | 1994 | August | Pennewit, Germany, 54° N, 12° E | Ground | LIF, DOAS | Maximum OH ∼107 molecule cm−3 | — | No detailed model calculations; LIF and DOAS measurements in good agreement | 55, 260–262, 329–331 |
| BERLIOZ | 1998 | July–August | Pabstthum, Germany, 53° N, 13° E | Ground | LIF, MI-ESR | 3.5 × 10⁶ molecule cm−3 at midday; 1.8 × 10⁵ molecule cm−3 at night | 4 × 10⁸ molecule cm−3 at midday; 4 pptv at night | RACM modelled concentrations within combined uncertainties at NOx > 5 ppbv but overpredicted OH by 100% and HO2 by 40% at lower NOx; MCM model overpredicted OH by factor of 1.6 at low NOx | 63, 263, 265–268, 332, 333 |
| PROPHET | 1998 | August | Pellston, Michigan, USA, 46° N, 85° W | Ground | LIF | 0.15 pptv daytime; 0.04 pptv at night | 14 pptv daytime; 2 pptv at night | OH underestimated by a factor of 2 or more during day and night; HO2 overestimated during the day by 30% | 269 |
| HOPE | 2000 | June–July | MOHp, Germany, 48° N, 11° E | Ground | CIMS | 4.5–7.4 × 10⁶ molecule cm−3 at midday | — | OH well reproduced by steady state calculations | 273 |
| HAFEX | 1998–2000 | April 1998–August 2000 | MOHp, Germany, 48° N, 11° E | Ground | CIMS | — | — | Long-term measurements | 334 |
| MOHp | 1998–2003 | April 1998–December 2003 | MOHp, Germany, 48° N, 11° E | Ground | CIMS | — | — | Long-term measurements | 94, 95 |
| Rock Springs | 2002 | May–June | Rock Springs, Pennsylvania, USA, 39° N, 77° W | Ground | LIF | 0.6 pptv | 30 pptv | OH observed to modelled ratio of 0.8; HO2 observed to modelled ratio of 1.0 on average but model overpredicted by a factor of 2 at night | 109, 271 |
| HOxCOMP | 2005 | July | Julich, Germany, 51 °N, 6 °E | Ground | LIF, DOAS, CIMS | — | — | Measurement intercomparison, including chamber and ambient measurements | 60, 64, 275, 276 |
Several experiments in suburban and rural regions have been conducted in Germany, including one of the earliest campaigns in such regions (POPCORN, Photochemistry Of Plant-Emitted Compounds and OH Radicals in Northeastern Germany)103,260–262 and long-term measurements of OH at the Meteorological Observatory Hohenpeissenberg (MOHp) in southern Germany.94,95
During the POPCORN campaign in north east Germany in 1994, OH radicals were measured by both FAGE and DOAS, with the two techniques showing good agreement in the concentrations and diurnal variation of OH (correlation coefficient of r = 0.90 and slope = 1.09 ± 0.12) when the two instruments were sampling the same air mass.103 Maximum OH concentrations at the site were on the order of 107 molecule cm−3, and the diurnal cycles were closely linked to primary production following photolysis of O3.103,262
Although detailed modelling of OH radicals was not conducted for the POPCORN campaign, the subsequent BERLIOZ (BERLIner OZone experiment) campaign at Pabstthum near Berlin in July and August 1998 provided a more comprehensive suite of measurements to enable a more in-depth analysis of the processes controlling OH and HO2 concentrations.263–266,63 During the BERLIOZ campaign, OH and HO2 were measured by LIF-FAGE, and additional measurements of HO2 and RO2 were made by MIESR and chemical amplification techniques.263,264
Measurements of OH and HO2 by FAGE found maximum concentrations of 8.0 × 10⁶ molecule cm−3 and 8.0 × 10⁸ molecule cm−3, respectively, although the average midday concentrations were 3.5 × 10⁶ molecule cm−3 and 4.0 × 10⁸ molecule cm−3, respectively.265 A high linear correlation (r = 0.90) was observed between OH and j(O1D) during the day, with deviation from this general behaviour at dawn and dusk when appreciable concentrations of OH were observed despite near-zero j(O1D).265 A box model using the RACM was constrained to measurements of over 60 non-methane hydrocarbons made during the campaign, and was able to reproduce the observed OH, HO2 and RO2 concentrations within the experimental errors of the measurements when mixing ratios of NOx were above 5 ppbv, indicating air masses advected from the direction of Berlin.266 At lower NOx mixing ratios, however, the model overestimated OH and HO2 by 100% and 40%, respectively.266 The reactivity of the measured VOCs to OH was dominated by alkenes (>60%), with isoprene and α-pinene representing the most significant species, and although increasing the VOC concentrations in the model improved the simulations for OH and HO2 at low NOx levels, the modelled RO2 concentrations were overestimated by a factor of 2 as a consequence.266
An additional modelling study of the radical concentrations during BERLIOZ, using a box model with MCM chemistry, was also able to reproduce the HOx observations at high NOx, but at low NOx mixing ratios (defined as <10 ppbv in this study) the OH observations were overpredicted by a factor of 1.6, and under conditions characterised by low NOx and high isoprene the model overestimated OH, HO2 and RO2.63 The radical budgets from the MCM model show that production of OH was dominated by recycling of HOx through the reaction of HO2 with NO (∼70% of the total), with the remainder largely resulting from photolysis of O3,63 with significant contributions from HONO photolysis in the early morning.267 In fact, HONO photolysis was found to contribute up to 20% of the total OH production over a 24 hour period.267 When NOx levels were high, the loss of OH to NO2 was approximately equal to the loss to VOCs, while reactions with VOCs dominated at lower NOx concentrations.63 The production of HO2 was dominated by reactions of RO2 radicals with NO, even during the low NOx periods when this production route constituted approximately 60% of the total HO2 production, followed by reactions of OH with CO and HCHO and photolysis of HCHO.63 Removal of HO2 was dominated by its reaction with NO (>80%).63
Production of radicals at night was also investigated during the BERLIOZ campaign.268 Modelled nighttime concentrations overpredicted OH and HO2 observations, by a factor of 2.2 and 1.5, respectively, for the maximum observed OH and HO2 of 1.85 × 10⁵ molecule cm−3 and 4 pptv, respectively, indicating missing nighttime sinks.268 Reactions of the nitrate radical (NO3) with terpenes was found to be responsible for 36% of the OH produced and 53% of the HO2, while ozonolysis reactions of alkenes were responsible for 64% of the OH produced and 47% of the HO2.268
Nighttime OH chemistry was also the subject of an investigation at a rural site in the United States, in Pellston, Michigan, in summer 1998.269 Measurements of HOx were made by the Penn State GTHOS instrument, and up to 0.04 pptv of OH and 2 pptv of HO2 were observed at night, compared to 0.15 pptv OH and 14 pptv HO2 during the day.269 Model calculations, using a 1-D Lagrangian model, underestimated the observed OH concentrations by a factor of 2 or more during both day and night, and overestimated daytime HO2 by 30%.269 Model calculations of nighttime HOx concentrations may have been impacted by uncertainties in nighttime boundary layer heights, and thus of transport and mixing of VOCs at night, and also by model descriptions of nighttime chemistry. Reactions of NO3 with RO2 radicals can act as nighttime sources of OH,270 but are often not included in models designed to simulate daytime chemistry, potentially leading to model underpredictions of nighttime OH concentrations.
Further measurements of OH and HO2 in 2002 by the Penn State group at Rock Springs, a rural region on an agricultural research farm of the Pennsylvania State University, showed maximum daytime mixing ratios of 0.6 pptv OH and 30 pptv HO2.109,271 A box model using the RACM was able to reproduce the OH observations during day and night, with an average observed to modelled ratio of 0.80. The model success for OH at night was attributed to the continuous soil emissions of NO, with the result that high OH concentrations at night were maintained by the reaction between HO2 and NO.271 However, although the average observed to modelled ratio for HO2 was 1.0, the model did overpredict HO2 at night by a factor of 2, and the model success for OH at night may therefore be somewhat fortuitous.271 Differences in the actual VOC speciation at night and the parameterisation used in the RACM model may have contributed to the overprediction of nighttime HO2,271 again highlighting the impact of using models designed for daytime conditions to simulate nighttime radical concentrations.
While the majority of HOx measurements have been made during intensive field campaigns, long-term measurements of OH have been achieved by the Deutscher Wetterdienst (DWD, the German Weather Service) at the Meteorological Observatory Hohenpeissenberg in rural southern Germany.94,95,272–274 The measurements, made by a CIMS instrument were in operation between April 1998 and December 2003,94,95 and were incorporated in the HOPE (Hohenpeissenberg Photochemical Experiment) 2000 intensive field campaign in June 2000.273 During the HOPE campaign, maximum midday OH concentrations ranged between 4.5 × 10⁶ molecule cm−3 and 7.4 × 10⁶ molecule cm−3, and were well reproduced by a photostationary steady state model when the calculations assumed the presence of 3 ppbv HCHO.273 Budget analyses indicated that the majority of OH was produced from HO2 + NO, with primary production occurring equally from O3 and HCHO photolysis.273 Subsequent measurements of HONO at the site in 2002 and 2004 indicated that production of HOx from photolysis of HONO could be comparable to that following photolysis of O3 or HCHO.274
Analysis of the OH measurements made in the period between April 1999 and December 2003 revealed a strong correlation between the observed OH concentration and j(O1D), as shown in Fig. 2.95 The long-term measurements indicate that despite the myriad of species reacting with OH in the atmosphere, the observed concentrations could be parameterised by a simple relationship (eqn (E6)) with solar UV radiation:
| [OH] = (a × j(O1D)b) + c | (E6) |
It was found that between 87% and 100% of the observed variance in OH could be explained by the dependence of OH on j(O1D) and instrument noise.95 This led to the proposal that regional or even global distributions of OH could be characterised by a simple set of coefficients, such as those in eqn (E6), to define an ‘OH index’ that describes the oxidising capacity of the troposphere in different chemical regimes.95Table 6 summaries the parameters in eqn (E6) reported in the literature for a number of field campaigns.
| Campaign | Location | Year | a | b | c | Ref. |
|---|---|---|---|---|---|---|
| POPCORN | Rural Germany | 1994 | 3.9 | 0.95 | 0.04 ± 0.01 | 95, 329 |
| ALBATROSS | Remote Atlantic Ocean | 1996 | 1.4 | 1.3 | 0.20 ± 0.21 | 95, 121 |
| BERLIOZ | Rural Germany | 1998 | 2.0 | 0.95 | 0.43 ± 0.02 | 95, 265 |
| MOHp | Rural Germany | 1998–2003 | 2.4 | 0.93 | 0.13 ± 0.01 | 95 |
| MINOS | Coastal Crete | 2001 | 2.2 | 0.68 | 0.01 ± 0.05 | 95, 136 |
| NAMBLEX | Coastal Ireland | 2002 | 1.47 ± 0.08 | 0.84 ± 0.05 | 0.44 ± 0.06 | 4, 335 |
| TORCH | Urban UK | 2003 | 1.07 ± 0.04 | 1.16 ± 0.05 | 0.62 ± 0.03 | 247, 335 |
| CHABLIS | Antarctica | 2005 | 0.25 ± 0.16 | 0.74 ± 0.04 | 0.11 ± 0.12 | 295 |
| RHaMBLe | Coastal Cape Verde | 2007 | 1.73 ± 0.57 | 0.90 ± 0.25 | 0.95 ± 0.45 | 70, 336 |
| OP3 | Tropical forest Borneo | 2008 | 0.94 ± 0.11 | 0.61 ± 0.09 | 0.20 ± 0.07 | 21, 336 |
| SOS | Coastal Cape Verde | 2009 | 1.19 | 0.98 ± 0.05 | 0.50 | 15 |
Several of the instruments described above took part in the HOxComp project in Julich, Germany, in 2005 to facilitate a formal comparison between the different instruments and techniques used to measure OH and HO2 in the atmosphere.60,64 The experiments involved chamber measurements under controlled conditions60,64 as well as ambient measurements275,276 on the campus of Forschungszentrum Julich (FJZ), situated in a mixed deciduous forest in a rural environment. During the ambient measurements a range of NOx concentrations were encountered, with one day characterised by high NOx (NO 1–3 ppbv) in the morning, followed by low NOx (NO < 1 ppbv) in the afternoon.276 The measured OH concentrations, taken as the mean of the observations reported by the different instruments involved in the project, reached a maximum of 9.4 × 10⁶ molecule cm−3 around noon, and then decreased sharply during the low NOx period.276 Model calculations for OH, using the MCM (v3.2), gave a slight overestimation during the high NOx period, with an increasing underestimation during the low NOx period, reaching an underestimation of 65% at <0.2 ppbv NO.276 Concentrations of HO2, corrected for potential interferences from alkene-derived RO2 radicals, were reasonably well reproduced by the model during the high NOx period, but were overpredicted by a factor of 1.3–1.8 during the low NOx period.276 A comparison of the radical fluxes during the high and low NOx periods is shown in Fig. 17.
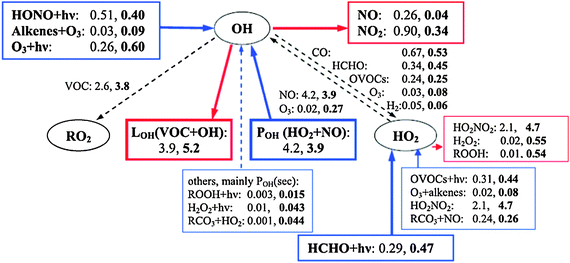 | ||
| Fig. 17 Average fluxes of the key radical sources and sinks during the high-NOx period and low-NOx period (bold) on 10th July 2005 during HOxComp. Units are in ppbv h−1. (Reproduced from ref. 276, Copyright (2012), American Geophysical Union, reproduced by permission of American Geophysical Union. Further reproduction or electronic distribution is not permitted.) | ||
Further investigation of the full ambient measurement period was carried out using a RACM-based model with MCM (v3.1) chemistry and epoxide formation277 to describe isoprene oxidation, but with isoprene emissions only added to the modelled air mass for the last 12 min of the five day model run to optimise agreement between observed and modelled MACR and MVK, the oxidation products of isoprene.275 Modelled OH concentrations were reproduced to within 33% over a range of isoprene (0.3–2 ppbv) and NO (0.1–10 ppbv) mixing ratios, with significant overestimations (up to 60%) of OH found when isomerisation of isoprene peroxy radicals219,220 was included in the model.275 Observed concentrations of HO2, corrected for potential RO2 interferences, were typically overestimated by factors greater than 1.8, although during the low isoprene and high NO period described by Elshorbany et al.,276 HO2 was underestimated using the RACM scheme.275
6.3. Summary of measurements in polluted/semi-polluted environments
Results from field campaigns in urban and polluted regions have demonstrated the significance of HONO photolysis, carbonyl photolysis and alkene ozonolysis in the production of HOx radicals. In many cases, measurements of HONO have not been made, reducing our ability to truly evaluate model successes for OH in these environments. Similarly, measurements of carbonyl compounds are generally limited to a small number of species, and improvements in measurement techniques for this class of compounds will aid our understanding of their role in oxidation chemistry in polluted regions.The oxidation of aromatic compounds has been highlighted as a significant source of uncertainty in models, and an area in need of further attention. The development of new laboratory techniques for the study of complex reaction mechanisms is an important ongoing research area in atmospheric chemistry, and recent advances in the detection of key intermediate species in ozonolysis reactions, with direct measurements of their kinetics, is an exciting new discovery for the development of chemical mechanisms for atmospheric modelling.116
Suburban and rural regions encompass a wide range of NOx and VOC conditions, with such regions often impacted by the transport of species from local forests or urban centres. As a result, many of the uncertainties encountered in urban regions, with regard to HONO measurements for example, or forested regions, such as the impact of isoprene on HOx, are relevant to suburban and rural regions.
The successes of the German Weather Service in making long-term measurements of OH have provided an impressive dataset for the investigation of seasonal behaviour in OH chemistry. Results of this study95 indicate that OH concentrations can be described as a simple function of j(O1D), and have been corroborated by other seasonal studies of HOx observations,15 enabling the definition of an OH index (eqn (E6)) to describe the oxidising capacity of the troposphere in different chemical regimes. However, if we are to use this relationship to its full potential for the assessment and prediction of atmospheric oxidising capacities, further field campaigns in a wide range of locations will be required to parameterise and validate the terms in eqn (E6) for different environments.
Finally, laboratory measurements relevant to polluted environments308 suggested that OH and HONO could be formed from the reaction:
| NO2* + H2O → HONO + OH | (R30) |
There are relatively few measurements of OH and HO2 radicals at night, yet the presence of both species has been confirmed in several campaigns, particularly in urban areas. The ROle of Nighttime chemistry in controlling the Oxidising Capacity of the atmosphere (RONOCO) campaign took place in September 2011 and January 2012, an aircraft based project to measure HOx and NO3 radicals at night, as well as a large number of supporting species, in the polluted boundary layer and free-troposphere. A strong correlation between HO2 and NO3 was observed, with the NO3 and O3 initiated oxidation of VOCs providing a source of HOx at night. Another major field campaign sampling in the polluted boundary layer over a range of NOx in California and the eastern Pacific region, from ground and airborne platforms, was the California Nexus (CalNex) campaign.
7. Measurements of OH and HO2 and model comparisons in polar environments
Studies of OH and HO2 in polar regions are summarised in Table 7. The interest in the hydroxyl radical at high latitudes was initially sparked by its role in the natural sulfur cycle and the oxidation of marine-released Dimethyl Sulfide (DMS) leading ultimately to the formation of sulfate aerosol. The Antarctic Peninsula provides an environment rich in biogenic sulfur emissions far from anthropogenic sources making it uniquely suited for studying DMS oxidation chemistry. The first measurements of OH in the polar boundary layer were made at Palmer Station on Anvers Island in Antarctica (64°46′S, 64°03′W) in the Sulphur chemistry in the Antarctic Troposphere Experiment (SCATE) during the austral summer of 1993/1994 using CIMS.278 In agreement with simple model predictions, the steady state hydroxyl radical concentrations were low, ranging between 1–9 × 10⁵ molecule cm−3, reflecting the high solar zenith angle (SZA), extensive cloud cover, lack of snow cover and low NO experienced at the measurement site. The levels of NO were close to the detection limit of the instrument used (2–4 pptv), and the modelled OH levels were only consistent with very low NO (1–5 pptv). Modelling results suggested that the primary source (70%) of OH resulted from the photolysis of O3 and the subsequent reaction of O(1D) with H2O vapour ((R1) and (R2)); the reaction of HO2 with NO or O3 contributed ∼25%. The major OH sink was reaction with CO.| O3 + hν (λ < 340 nm) → O(1D) + O2 | (R1) |
| O(1D) + H2O → 2OH | (R2) |
| HO2 + HO2 → H2O2 + O2 | (R8) |
| HO2 + CH3O2 → CH3O2H + O2 | (R9) |
| Campaign | Year | Dates | Location | Platform | Technique | OH measured | HO2 measured | Comments | Ref. |
|---|---|---|---|---|---|---|---|---|---|
| SCATE | 1994 | February | Palmer Station, Antarctica 65° S, 64° W | Ground | CIMS | 1.1 × 10⁵ molecule cm−3 (mean) 7 × 10⁵ molecule cm−3 (mean diurnal peak) | — | Reasonable agreement between observations and model (within uncertainties) only basic chemistry included in model | 278 |
| ISCAT | 1998–1999 | November–January | South Pole, 90° S | Ground | CIMS | 2 × 10⁶ molecule cm−3 (mean) | — | Agreement for mid-range NO. Observed to modelled ratio <1 for NO <120 pptv and >1 for NO > 380 pptv | 279, 282 |
| TOPSE | 2000 | February–May | Canada | Aircraft | CIMS | Not reporter (range between 0–4 × 10⁶ molecule cm−3) | 7.8 pptv (60–85° N) (mean) 1.5–9.5 pptv @ surface | Model underestimates OH at SZA > 70° Good agreement between for HO2 + RO2 | 291, 337 |
| ISCAT-2 | 2000–2001 | November–January | South Pole, 90° S | Ground | CIMS | 2.5 × 10⁶ molecule cm−3 (mean) | 7 × 10⁷ molecule cm−3 (mean) | Agreement between model and observations. If HONO is included large model overestimates | 287, 297 |
| Summit 2003 | 2003 | July | Summit, Greenland, 72° N, 38° W | Ground | CIMS | 6.3 × 10⁶ molecule cm−3 (mean) (8.4 × 10⁶ molecule cm−3 noontime (1000–1500) median) | 2.4 × 10⁸ molecule cm−3 (mean) (4.1 × 10⁸ molecule cm−3 noontime (1000–1500) median) | HO2 + RO2 Mod/obs = 1.06 Modelled OH > factor of 2 lower than observed | 93, 292 |
| ANTCI | 2003–2004 | November–January | South Pole, 90° S | Ground | CIMS | 1.5–2.5 × 10⁶ molecule cm−3 (mean) | — | OH observations systematically lower than model | 286 |
| CHABLIS | 2005 | January–February | Halley, Antarctica, 75° S, 26° W | Ground | FAGE | 3.9 × 10⁵ molecule cm−3 (mean) (7.9 × 10⁵ noontime) | 0.76 pptv (mean) (1.5 pptv noontime) | Model overestimates OH and HO2 | 295, 298 |
| GSHOX | 2007, 2008 | May–June 2007, June–July 2008 | Summit, Greenland, 72° N, 38° W | Ground | CIMS | 3 & 4.1 × 10⁶ molecule cm−3 (Spring & summer) (median midday values) | 2.7 & 4.2 × 10⁸ molecule cm−3 (Spring & summer) (median midday values) | Model agrees reasonably well for HO2 + RO2, but underpredicts OH | 92 |
| ARCTAS | 2008 | April | Arctic | Aircraft | FAGE & CIMS | 5 × 10⁵ molecule cm−3 (at the surface) | ∼3 pptv(at the surface) | Model underestimates OH by 40% at surface. Overestimates HO2 by factor of 2 | 299, 304 |
| COBRA | 2008 | March | Hudson Bay, Canada, 55° N, 78° W | Ground | FAGE | 2.6 × 10⁵ molecule cm−3 (mean) 1.16 × 10⁶ molecule cm−3 (men diurnal peak) | 1.42 × 10⁸ molecule cm−3 (mean diurnal peak) | Model and observations in agreement. HCHO dominant radical source | 305 |
7.1. Snowpack emissions of NOx and the impact on radical concentrations
In the Antarctic summer of 1998–1999, polar OH chemistry was re-investigated during the Investigation of Sulphur Chemistry in the Antarctic Troposphere (ISCAT) field study that took place at the South Pole. In contrast to the earlier OH measurements, OH concentrations (also measured using CIMS) were found to be elevated, with an average OH concentration of 2 × 10⁶ molecule cm−3 observed (24 h average),279 which is approximately 20 times greater than the OH observed at a coastal Antarctic station278 and exceeds the daily mean OH levels observed at equatorial marine locations (in part caused by the fact that the South Pole experiences 24 h of sunlight). This is an unexpected result when first considered, given the dry conditions and the low angle of the sun that should effectively limit the primary production of OH viareactions (R1) and (R2).Model simulations revealed that much of the observed OH resulted from the much higher NO concentrations (up to 600 pptv) present at the South Pole relative to Antarctic coastal environments (∼5 pptv).278 These high levels of NO are a result of emissions of NOx from the snow pack into a mixed layer with a low boundary layer height, a process initiated by the photolysis of NO3− from within the snow pack.280,281 The model and observations were found to be in good agreement at NO levels between 120 and 380 pptv; at lower NO concentrations the basic model overestimated OH observations and at concentrations greater than 380 pptv the model tended to underpredict OH levels.282 Further investigation highlighted that the low NO data corresponded to foggy conditions suggesting that additional HOx radical losses due to droplet scavenging could be missing from the model. Indeed, if an irreversible uptake coefficient (or sticking coefficient) γ of unity was assumed for HO2, the additional first order loss introduced into the model was sufficient to bring OH model and observations into a high level of agreement at the low NO range.282 However, recent laboratory studies indicate that γ is likely to be much less than unity.46,148
In contrast to SCATE, the presence of NO alters the major radical sink pathways with the dry deposition of HNO3 (52%), formed via (R24), and HO2NO2 (22%), formed via (R25), dominating the loss.
| OH + NO2 + M → HNO3 + M | (R24) |
| HO2 + NO2 + M → HO2NO2 + M | (R25) |
7.2. Snowpack emissions of HCHO, H2O2 and HONO acting as important radical sources
Along with missing radical sinks, the basic model employed in this study may also have neglected key radical sources. Snow emissions of formaldehyde (HCHO), hydrogen peroxide (H2O2), and nitrous acid (HONO) could all increase radical concentrations ((R26)–(R28)) and have been observed in other polar regions/studies.283–285 Assuming that these additional HOx sources parallel the NO trend, the concentration of which was found to be strongly influenced by the atmospheric mixing depth at the South Pole, they could help reconcile the model OH underprediction under the high NO conditions without adversely affecting the agreement between model and observations under the lower NO conditions.| HCHO + hν (+2O2) → CO + 2HO2 | (R26) |
| H2O2 + hν → 2OH | (R27) |
| HONO + hν → OH + NO | (R28) |
A second ISCAT campaign took place at the South Pole during 2000 and further radical measurements were made using CIMS at the South Pole during the Antarctic Chemistry Investigation (ANTCI) in 2003. Calibrations for these two campaigns compared well, showing a variation of 19% (2σ) for OH providing confidence in the absolute radical levels reported. Similarly elevated OH concentrations, as were observed during the austral summer of 1998–1999, were seen once again with a mean OH concentration of 2.5 × 10⁶ molecule cm−3 recorded during ISCAT 2000 and typical daily average values ranging from 1.5–2.5 × 10⁶ molecule cm−3 in 2003. On average the OH observations were higher during the ISCAT 2000 campaign relative to ANTCI.286 During the 2000 campaign, the first measurements of HO2 + RO2 were made allowing the influence of primary ((R1) and (R2)) and secondary OH production (HO2 + NO or HO2 + O3) to be determined directly from measurements and compared with model predictions. In contrast to the 1998 campaign, NO levels were a factor of 3 times lower during the ISCAT 2000 campaign (median NO = 88 pptv); the median NO values during ANTCI were 231 pptv. During ISCAT 2000 and ANTCI, key HOx precursor species (HCHO, H2O2, HONO) which were missing from the earlier ISCAT campaign were measured alongside the radicals. Basic model predictions which exclude additional radical sources from HCHO, H2O2 and HONO were found to underpredict OH observations during ISCAT 2000 at all NO concentrations except at NO < 40 pptv with a median model to observation (M/O) ratio of 0.68. For HO2 (which was assumed to make up 75% of the HO2 + RO2 observations) the same basic model underpredicted HO2 observations also (M/O = 0.65),287 as shown in Fig. 18. Constraining the model to observations of HCHO, H2O2 and HONO led to significant model overestimations of OH and HO2, with OH being overpredicted by a factor of 3–5 and HO2 by a factor of 2–3 (see Fig. 18). The model, constrained to HONO observations, was also used to estimate NOx levels. Using this approach the median modelled NOx concentration was approximately 10 times higher than observations leading to the suggestion that the HONO measurements made using mist chamber/ion chromatography (MC/IC)288 may suffer from a systematic interference.287 An alternative laser flash photolysis–laser induced fluorescence (LFP–LIF) detection of HONO was employed alongside MC/IC during the ANTCI campaign. In support of an interference from MC/IC HONO observations, LFP–LIF HONO observations were found to be 7.2 ± 2.3 times lower than those reported by MC/IC during this campaign.289 Model observations constrained to the basic oxidation chemistry plus HCHO and H2O2 improved the median M/O ratio for OH (1.27) and HO2 (1.12), with HCHO and H2O2 contributing 32% and 14% to the total HOx budget. Systematic overpredictions of both radicals were still observed over the whole NO range, with the overprediction becoming larger at the highest NO concentrations (>150 pptv) (Fig. 18). During ANTCI, OH observations were also systematically lower than model predictions.286 The authors suggest that this trend may indicate a missing OH sink in the model mechanism, a systematic error in the calibration or systematic losses of OH during sampling.
 | ||
| Fig. 18 (Left) Comparison of observations of OH and HO2 during ISCAT 2000 with standard model predictions (gas phase chemistry only) as a function of NO. (Right) Comparison to models constrained with snow pack emissions of formaldehyde, hydrogen peroxide (and nitrous acid). (Reproduced from ref. 287, Copyright (2004), with permission from Pergamon.) | ||
A number of measurements of key HOx precursors (HCHO, H2O2, HONO) have been made in the Arctic since the late 1990s and have been used to constrain models used to predict radical concentrations. Yang et al.290 predicted noontime OH concentrations of 9 × 10⁶ molecule cm−3 and a diel average of approximately 4 × 10⁶ molecule cm−3 based on direct observations of the HOx precursors at Summit in Greenland. These hydroxyl radical levels are a factor of 2–3 times greater than OH observations at the South Pole. This elevated OH in the polar northern hemisphere relative to the southern hemisphere is in part driven by the lower SZA and higher O3 and humidity experienced in the Arctic. The role of HCHO, H2O2 and HONO as HOx precursors is also significant at Summit; the authors conclude that HOx production from these species combined is greater than the HOx produced by primary production ((R1) and (R2)).
During the Tropospheric Ozone Production about the Spring Equinox (TOPSE) aircraft campaign several flights were performed over the Arctic region providing observations of OH and HO2 + RO2 by CIMS; measurements were limited, however, to altitudes outside the boundary layer. A modelling study tended to underestimate OH observations at the highest latitudes and at SZA > 70° potentially indicating missing OH sources; inclusion of new HCHO photolysis quantum yields was suggested as a means to improve the model underestimation at the highest SZA. Generally good agreement between modelled HO2 + RO2 and observations was reported.291
The first direct ground-based observations of OH and HO2 + RO2 in this region were made by CIMS during the summer of 2003 at Summit (72°34′N, 38°30′).93 The median HO2 + RO2 and OH concentrations were 2.2 × 10⁸ molecule cm−3 and 6.4 × 10⁶ molecule cm−3 respectively. Excellent agreement between peroxy radical observations and highly constrained model predictions was realised when the model was not constrained to HONO observations (M/O = 1.06); the M/O ratio when HONO was included increased by approximately 20%. Modelled OH concentrations were typically a factor of 2–3 times lower than observations, as shown in Fig. 19, this discrepancy was found to be highly dependent upon the local meteorology. Under relatively calm conditions the model compared most favourably with observations with a median M/O for OH of 0.65 when the modelled was constrained to HONO observations; this dropped to 0.48 when the model was left unconstrained to HONO. Unlike at the South Pole, the impact of the HONO observations on HOx concentrations at Summit was relatively small as a result of the lower HONO concentrations measured at Summit (10 pptv) compared to those measured at the South Pole (33 pptv) and also due to the larger percentage impact of primary radical production from O3 and H2O2 photolysis at Summit93 compared to HONO. As found at the South Pole, model predictions of NO, when constrained to HONO observations were greatly overpredicted suggesting that HONO observations at both locations may suffer the same artefact signal.292 HCHO and H2O2 were found to contribute 3% and 37% as HOx sources.
 | ||
| Fig. 19 Comparison of observations with model predictions for (a) HO2 + RO2 and (b) OH. Model 1: calculation without snow influenced precursors, model 2: calculations constrained by H2O2 and CH2O, model 3: calculations constrained by H2O2, CH2O and HONO. (Reproduced from ref. 292, Copyright (2007), with permission from Pergamon.) | ||
7.3. The role of halogen oxides in polar regions
Sjostedt et al.93 using the measured peroxy radical levels at the Summit, calculated an O3 production rate of approximately 0.8 ppbv day−1 within the boundary layer, about 2% of the daily O3 concentration:| PO3 = k11[RO2][NO] + k10[HO2][NO] | (E11) |
| HO2 + XO → HOX + O2 | (R15) |
| HOX + hν → OH + X | (R16) |
| X + O3 → XO + O2 | (R23) |
| HOX + aerosol → loss | (R29) |
In 2005 the first polar measurements of OH and HO2 radicals using FAGE were made at a coastal site in Antarctica during the Chemistry of the Antarctic Boundary Layer and the Interface with Snow (CHABLIS) project, as shown in Fig. 20.295 DOAS measurements of the halogen oxides of IO and BrO296 were also made during the project allowing the impact of these species on the oxidant concentrations to be determined directly. Mean OH and HO2 concentrations of 3.9 × 10⁵ molecule cm−3 and 0.76 pptv were observed respectively; maximum radical levels, observed at local noon, were of the order of 7.9 × 10⁵ molecule cm−3 and 1.5 pptv for OH and HO2. These radical concentrations are similar to early OH concentrations made on the Antarctic Peninsula278 but lower than observations made at the South Pole279,286,297 likely reflecting the lower mixed layer height at the South Pole which effective amplifies snowpack emissions of NOx and HOx precursor species. During CHABLIS a mean NO of 8.1 pptv during HOx measurement period was observed. A steady-state analysis found that O3 and HCHO photolysis acted as the main source of HOx; the contributions from HONO photolysis was found to be significant at nominal HONO concentrations of 1 and 5 pptv which were used in the model, however, the observations of HONO that were made were consistent with neither OH nor NO observations; large model overpredictions of OH and NO were noted when the model was constrained to HONO observations298 similar to findings from the South Pole experiments.287 Reactions of HO2 with halogen oxides ((R10)–(R12)) dominated HO2 to OH interconversion over and above NO (mean IO = 3.3 pptv, BrO = 2.5 pptv). A photochemical box model, including halogen chemistry was found to significantly overpredict the observed OH and HO2, as shown in Fig. 20, despite being able to reproduce the observed IO, BrO and NOx concentrations. The authors suggest that uncertainties in key kinetic and photochemical parameters associated with iodine chemistry, coupled with uncertainties arising from the lack of measured physical parameters such as aerosol surface area and boundary layer structure during the project could account for the model over-prediction.298
 | ||
| Fig. 20 Observed and simulated time series of (a) OH concentrations and (b) HO2 mixing ratios. Open circles: all HOx observations. Filled circles: observations for which all other data present, as used in the model-measurement comparisons. Blue and red lines: model simulations constrained to observations of halogen oxides, NOx and VOC. Black line: simplified model scheme, containing C1 chemistry only. (Reproduced from ref. 295, Copyright (2007), with permission from Copernicus Publications.) | ||
7.4. Impact of aerosols on polar radicals
The potential impact of aerosols on polar HOx concentrations was demonstrated during recent aircraft measurements of OH and HO2 over the Arctic during springtime of 2008 as part of the Arctic Research of the Composition of the Troposphere from Aircraft and Satellites (ARCTAS) campaign. Comparison of the measurements taken on board the DC8 aircraft with a global 3-D chemical model (GEOS-Chem) demonstrated that the standard gas phase chemical model implemented in the model led to large overpredictions of the observed HO2 concentrations; a large influx of peroxides from northern mid-latitudes in the model accounted for 50% of the HOy sources above 6 km suggesting a large missing sink necessary to compensate for this.299 The transport of aerosol pollution from mid-latitudes to Arctic regions is often greatest during the spring.300 Low temperatures and reasonably high aerosol loadings experienced under Arctic conditions, particularly during springtime, lead to the uptake of HO2 on aerosol surfaces becoming increasingly important. A standard uptake coefficient, γ = 0.02 at 275 K increasing to γ = 0.5 at 220 K was sufficient to reproduce the concentrations and vertical distributions of OH and HO2 that were observed during the ARCTAS campaign.299 The presence of aerosols in the Arctic was estimated to lead a decrease in OH and HO2 of approximately 30% throughout the tropospheric column, with heterogeneous loss acting as the dominant radical sink at altitudes above 5 km; below 5 km radical–radical self reactions became the dominant sink ((R8) and (R9)). Recent laboratory experiments that have studied the uptake of HO2 on different surface types and under different conditions46,148,301 indicate that uptake coefficients generally increase with a decreasing temperature, reflecting the negative temperature dependence of the mass accommodation coefficient (α) on the surface and the solubility constant.302 Aqueous surfaces tend to have higher uptake coefficients than solid surfaces and the presence of transition metals such as copper increase the reactive uptake considerably. Biomass burning from Siberian wildfires acted as a major aerosol source during ARCTAS and aerosol mass spectrometric observations taken on board the DC8 aircraft demonstrated that a significant portion of the aerosol was made up of organics (32%), for which there are limited data on the reactive uptake coefficient of HO2 (just one reported HO2 uptake coefficient on levoglucosan303) leading to large uncertainties in the overall impact of aerosols on the oxidising capacity over this region.Data from the ARCTAS campaign have also been examined using the NASA Langley Research Center photochemical box model (LaRC-V08).304 During spring, the model was generally able to replicate the observations, with an observed to modelled ratio of 0.96, although the observed OH concentrations were frequently at the limit of detection. Observed concentrations of OH during summer were four times larger than those observed during spring, but the model underestimated the observations, with an observed to modelled ratio of 1.25.304 Modelled HO2 concentrations overestimated the observations by a factor of up to 2, and although the use of a temperature dependent γHO2 decreased the modelled HO2 concentrations by ∼23%,304 the difference was insufficient to reconcile the model with the observations. The differences between the global model and box model predictions relate to the fact that many of the HOx precursor fields generated by the global model were lower than those observed, with GEOS-Chem predicting lower values for H2O2, CH2O, H2O and j(O1D). Olson et al. found that when the box model was constrained by GEOS-Chem precursor predictions, the modelled HOx determined by the two models was equivalent. These discrepencies highlight that a direct comparison of in situ HOx measurements to a model can only be achieved when the observed precursors and physical parameters are used. Nevertheless, global models provide a useful tool to identify key atmospheric processes.
Model measurement comparisons of OH and HO2 detected using FAGE have been made during a recent ground-based sub-Arctic study that took place on the Eastern coast of Hudson Bay in Northern Canada during the COmbined iodine and Bromine release on the Arctic atmosphere (COBRA) project.305 An average peak OH concentration of 1.16 × 10⁶ molecule cm−3 was observed and HO2 peaked at 1.34 × 10⁸ molecule cm−3. The model was in good general agreement with the observations for both OH and HO2; this is in contrast to findings from experiments conducted at Summit which underpredicted OH observations. During COBRA, HCHO was measured alongside the radicals using DOAS and was found to be at higher concentrations (mean HCHO = 363 pptv) than previously reported during earlier Arctic studies (mean HCHO during the 2003 Summit campaign = 90 pptv) and helped to elevate modelled HOx concentrations. During COBRA, 74% of the HOx came from photolysis of HCHO which was the dominant radical source. Radical concentrations were also lower on average at Hudson Bay than at Summit, potentially reflecting the lower NO and O3 concentrations at Hudson Bay compared to Summit (mean NO = 4 pptv, O3 = 30 ppbv at Hudson Bay and NO = 21 pptv, O3 = 50 ppbv at Summit). During the HOx measurement period in COBRA, the halogen oxides of IO and BrO were generally not detected above the 1 pptv detection limit of DOAS and as such had a limited impact on the radical cycling. The HOx precursors of HONO and H2O2 were not measured during the COBRA project and were omitted from modelling studies. The photolysis of H2O2 contributed as much as 37% during the 2003 Summit campaign292 and so if present during COBRA may suggest that additional sinks would be required to compensate for this missing radical source to maintain good model to measured agreement. Uncertainties in the reactive uptake coefficient employed in the model could compensate for missing OH sources.305 A relatively low uptake coefficient of 0.025–0.05 was found to best agree with observations when H2O2 was not considered. Higher values of the uptake coefficients, particularly considering the low temperatures experienced during the campaign (mean temperature, −22 °C), could still be consistent with theory306 and recent laboratory results,301 which indicate that the HO2 uptake coefficient increases with decreasing temperature. However, no temperature dependent laboratory data for HO2 uptake have been published. It is noteworthy that heterogeneous loss for HO2 was not considered during earlier modelling studies based on Summit observations92,93,292 which may suggest that the models would further underpredict OH concentrations if this additional sink were included.
7.5. Summary of model measurement comparisons in polar regions
Despite the large SZA and low humidity experienced in polar regions, both of which limit the rate of primary production of OH via the reaction of O(1D) atoms with water vapour, the oxidising capacity, embodied by the observed OH concentration, at many polar sites has been shown to rival that experienced under equatorial marine conditions. The observations of radicals and comparison with model predictions demonstrate that the snowpack acts as an important source of HOx precursors, namely HCHO and H2O2. In many studies HCHO and H2O2 have been identified as the dominant radical sources over and above O(1D)/H2O primary production. HONO emissions have also been observed from the snowpack, although the levels reported are, in many cases, not consistent with the observations of OH and NO and have led to the suggestion that the HONO measurements (typically carried out using mist chambers/ion chromatography) suffer an artefact signal. There is a pressing need for accurate, artefact free measurements of the very low concentrations of HONO found in polar regions.NO emissions from the snowpack have also been demonstrated to increase the oxidising capacity, particularly at the South Pole where the boundary layer is, at times, only a few metres in height, by promoting secondary production of OH from HO2 and higher peroxy radicals, and leading to ozone production.
Discrepancies between the modelled and observed OH to HO2 ratio has helped to identify the presence of halogen oxides in polar regions. Direct observations of IO and BrO both in the Arctic and Antarctic have demonstrated the importance of halogens in both radical cycling and ozone depletion events. In several studies, inclusion of halogen oxide chemistry in model schemes has helped to improve the agreement between predictions and observations.
A number of studies have suggested that aerosols may act as significant radical sinks in polar regions, for example the uptake coefficients for HO2 are expected to increase at lower temperatures, but the absolute impact of aerosols on the oxidising capacity remains highly uncertain. In some cases this uncertainty arises from the lack of direct aerosol observations but, in the most part, is caused by the lack of reported data of reactive uptake coefficient on different aerosol types under appropriate low temperature conditions.
Much of the work to date has focussed on the chemistry of the polar boundary layer, whilst the polar free-troposphere has received less attention with only two aircraft campaigns conducted in which radical measurements were made. Snowpack emissions and halogen radical photochemistry which have been identified as important sources in controlling the radical concentrations in the boundary layer are expected to have a limited impact on the radical chemistry outside of the boundary layer, instead interaction with aerosols has been identified as the dominant radical sink above 5 km in the Arctic, whilst long-range transport of peroxides from northern mid-latitudes act as important HOx sources at this altitude.
Good agreement between radical observations and predictions have been reported at a number of the polar sites but discrepancies between radical observations and predictions still exist at others, despite the improved knowledge on the radical sources and sinks and inclusion of these in models. Models have a tendency to overpredict OH concentrations at the South Pole and Coastal Antarctica implying missing radical sinks or uncertainties in key kinetic parameters employed in models (for example, uncertainties in halogen chemistry kinetics has been suggested as a reason for model overpredictions of OH during CHABLIS). Focussed laboratory studies addressing these issues are necessary to minimise these uncertainties and model discrepancies in the future.
8. Overall summary and future requirements
Individual section summaries above highlight the main findings for different environments, for example the level of agreement found between measurements and models. In this section we provide an overall synthesis and make recommendations for future work to help solve some of the remaining uncertainties in our understanding of photochemical oxidation in the troposphere mediated by OH and HO2 radicals. Such recommendations are of course subjective, but we have tried to highlight some of the major uncertainties which need addressing.OH concentrations fit the general expression [OH] = a j(O1D)b + c expression in most environments, but parameters vary considerably and are heavily influenced by unexpected factors, for example halogens. Given the right conditions, concentrations of OH have reached as high as 2 × 10⁷ molecule cm−3, although OH is remarkably buffered, varying by a relatively small amount (usually in the 106 molecule cm−3 range) for a wide range of environments, latitudes and seasons. There are also a paucity of data at night when j(O1D) = 0. There is a need to systematically characterise this relationship in different global regions over time scales that are longer than most campaigns in order to establish an index of a, b and c that could be useful for parameterisation of OH in multidimensional models, although there are some examples of seasonal studies of OH in certain locations. With the advent of smaller, electrically-efficient and more reliable instrumentation, it is recommended that more long-term measurements of OH and HO2 in a variety of locations are performed.
In the marine boundary layer, OH measurements and box model calculations are now broadly in good agreement within the combined uncertainties. Earlier campaigns suffered from a lack of supporting measurements, in particular of oxygenated VOCs (a significant sink for OH) and halogen species (which convert HO2 to OH reducing the HO2 to OH ratio). In environments characteristic of the open ocean, model calculations show significant impacts of bromine and iodine on HOx chemistry, with subsequent impacts on local methane lifetimes. However, given that ∼70% of the Earth's surface is ocean, further open-ocean measurements are required from ships over a range of latitudes. A major gap in our understanding is the influence of oceanic emissions as you move vertically above the ocean. In order to examine the vertical extent of the influence of halogen chemistry, vertically resolved measurements of OH and HO2 are needed, particularly in the first kilometre, together with supporting measurements of sources and sinks (e.g. IO and BrO and aerosols). In coastal regions at low tide where macroalgae are exposed, halogen chemistry can become a dominant factor, and the impact of halogen species may be underestimated if there is heterogeneity in source regions. Although the laboratory database for uptake coefficients onto aerosols is improving, heterogeneous loss of HO2 still remains a significant source of uncertainty in determining its budget in this region, and further direct studies in the laboratory are needed. Measurements to probe the interaction of HOx with sulfur containing species over the open-ocean, determined as a function of altitude, are also required.
Some of the worst agreement with models, with discrepancies up to an order of magnitude, is in regions characterised by significant emissions of biogenic VOCs. The model-measurement agreement is very dependent upon the level of NOx, with significant model underprediction for OH observed at low NO (<100 pptv). Although advances in instrumentation mean that the number and functionality of measured VOCs has increased significantly, OH reactivity measurements show that significant OH sinks are still missing in models for forested regions. When the rate of OH removal is constrained using field measurements of OH reactivity, model calculations show that significant unknown OH sources exist at low NOx in these environments. Although a number of suggestions have been put forward for the new source of OH in such an environment, based on theoretical and experimental studies, for example the Peeters' mechanism involving the isomerisation and subsequent decomposition of isoprene peroxy radicals, no single mechanism is yet able to close the model-measurement gap. A process not considered routinely in models or in Section 5 above is the excitation of weak absorption features, for example vibrational overtone transitions in organic peroxides,307 which are hypothesised to promote photolysis to form HOx. However, constraints on the rate of certain key processes that have been suggested, for example the rate of photolysis and reaction with OH of HPALDS are beginning to emerge from intense activity both in the laboratory and in instrumented chamber studies. It is strongly recommended that further OH and HO2 measurements are made in low NOx environments, such as forests, using a variety of instrumentation to ensure a stringent model constraint.
From an experimental point of view, it is important for the community to know whether these unexpectedly high measurements of OH in low NOx environments are accurate or not. The implementation of any new chemistry that is developed to explain these findings may lead to erroneous results, for example in the calculation of the lifetime of CH4, if the field data upon which the development of the new chemistry is based, are wrong. The conclusions are based on measurements of OH using FAGE, and one group, using an alternative method to obtain the background signal, has reported an artefact under certain conditions. It is difficult to know if previous measurements during other campaigns are subject to the same type of interference. It is strongly recommended, as a matter of priority, that all groups should perform agreed laboratory experiments to investigate the presence or not of interferences, which may allow some understanding of whether corrections to previous data are required or not. However, if an interference were revealed, the concentration of the guilty species may not have been measured, but it may be possible to use a model to calculate its concentration. Measurement groups should adopt instrument designs and sampling procedures (for example the addition of C3F6 to determine the OH background) which minimise the possibility of interferences. In addition, there need to be further intercomparisons for OH and HO2 using different methods, for example FAGE and CIMS, under field conditions in environments that provide a range of potentially interfering species. A recent chamber intercomparison has provided support for the accuracy of FAGE OH measurements in these types of environments, but further studies of this type are urgently needed.
The level of agreement for HO2 in low NOx, high biogenic VOC environments is more variable from campaign to campaign, but clear conclusions cannot be drawn until the level of possible interferences in HO2 measurements, which have largely been measured using FAGE and chemical conversion to OH, have been quantified by the measurement groups involved. Recent work suggests that the level of interference is likely to be influenced by details of the design of an individual FAGE instrument. Some campaigns suggest there is a missing species which is able to convert HO2 to OH, but without any concomitant production of ozone. Measurements at high temporal resolution above the canopy combined with micrometeorological data have enabled the flux of OH and HO2 to be determined, and the role of turbulent mixing (which controls deposition rates) on the budgets of these radicals to be determined.
In polluted urban regions, characterised by high levels of NOx and VOCs, there is significant HOx production from HONO, HCHO and other carbonyl/oxygenated species, and from reactions of ozone with alkenes. OH reactivity measurements demonstrate, once again, that models are missing OH sinks, and chemical mechanisms are often deficient or completely missing for the oxidative degradation of more complex, multifunctional VOCs. At the ground, the level of model-measurement agreement is variable, often displaying a diurnal variation that scales with NOx. Models underpredict HOx at high levels of NOx, when the rate of O3 production is highest, and therefore underestimate net ozone production. Aircraft measurements over continental regions show a consistent model underprediction for HO2 that becomes worse with increasing NO concentration, suggesting unknown sources of HOx that may be present downwind of convection. These results imply uncertainties in our understanding of chemical oxidation at high NOx, for example of aromatic species, although potential interferences for HO2 FAGE measurements from alkene- and aromatic-derived RO2 species (which will scale with the level of VOCs, and also NOx) need to be taken into account for some studies to confirm these conclusions.
Concentrations of OH and HO2 in polar regions can be surprisingly high given the high solar zenith angle and low concentrations of water vapour, because of HOx sources emitted from the snowpack. H2O2, HCHO and HONO can be dominant sources of HOx, but a lack of high quality measurements of these species to constrain box models have limited the studies. In the case of HONO, there are large overpredictions of OH if measured HONO is used to constrain the model, casting doubt on the reliability of some methods to measure HONO. At the South Pole the very low mixed boundary layer leads to high levels of NOx following emission of precursors, which enhances the concentration of OH via the reaction of HO2 with NO. Radical budgets calculated using box models constrained by measurements of halogen oxides in coastal Antarctica show that halogen species are a significant source of HOx and can dominate the conversion of HO2 into OH. However, significant OH overpredictions remain, suggestive of OH sinks missing in the model, or that there are errors in the kinetic data involving halogen species at lower temperatures. In the free troposphere above the Arctic, at altitudes above 5 km, and where halogen influences are likely to be small, HO2 overpredictions can be improved via inclusion of uptake onto aerosols, the rate of which is expected to increase at lower temperatures. However, there is an absence of direct laboratory measurements of HO2 uptake coefficients under relevant conditions at low temperature.
For all environments studied, there is an almost complete lack of OH and HO2 measurements in the altitude range 10–500 m, although limited vertically-resolved measurements exist from elevator-based instruments in the range 2–40 m within forest canopies. There are likely to be large gradients in the concentration of HOx source and sink gases as well as aerosols, and extrapolating conclusions of measurement-model studies at the surface to higher altitudes is risky. There have been pioneering measurements of OH, HO2 and supporting measurements at very low altitudes in the last 2–3 years in Germany using an instrumented Zeppelin, and the results of these studies will greatly extend our knowledge of a little probed region. It is recommended that vertically resolved measurements are made in the boundary layer over land, the ocean and the snowpack.
Following the ending of MIESR measurements, a fundamental gap in the arsenal of field instruments is a direct field measurement for HO2. Although there have been remote sensing measurements of stratospheric HO2 from space using far-IR emission rotational spectroscopy, and integrated column abundances have been measured from the ground using mm wave absorption spectroscopy (but most sensitive to stratospheric and mesospheric HO2), these methods have not been used for local in situ HO2 in the troposphere. Continuous wave cavity ringdown absorption spectroscopy in the near-IR, using the first vibrational overtone of the OH stretch around 6638 cm−1, has been used to detect HO2 directly in a large photoreactor,318 although the detection limit reported of 1.5 × 10¹⁰ molecule cm−3 (at <100 Torr total pressure) is not low enough to enable tropospheric detection. It is strongly recommended that the community strive to develop a technique capable of direct in situ measurements for HO2, and other specific peroxy radicals, with good time resolution.
Clouds play a crucial role in the chemistry of the atmosphere, occupying, on average, ∼15% of the volume of the troposphere. Other than by modifying j(O1D), the role of clouds in determining local HOx concentrations is not well understood, although aqueous phase chemistry in clouds can influence gas phase radical chemistry. A number of aircraft projects and one recent ground-based 2010 Hill Cap Cloud Thuringia (HCCT) project atop Mt Schmucke in Germany have identified significantly reduced HO2 concentrations in clouds that exceed the depletion expected due to the reduction in radiation alone.338 Further work is required to probe the influence of clouds on local HOx concentrations.
Acknowledgements
The authors wish to thank the National Centre for Atmospheric Science, which is a distributed institute funded by the Natural Environment Research Council, for funding. We also wish to thank the two reviewers for their comments which have helped to improve the manuscript.References
- S. Saunders, M. Jenkin, R. Derwent and M. Pilling, Atmos. Chem. Phys., 2003, 3, 161–180 CrossRef CAS.
- MCM, http://mcm.leeds.ac.uk/MCM.
- W. J. Bloss, J. D. Lee, G. P. Johnson, R. Sommariva, D. E. Heard, A. Saiz-Lopez, J. M. C. Plane, G. McFiggans, H. Coe, M. Flynn, P. Williams, A. R. Rickard and Z. L. Fleming, Geophys. Res. Lett., 2005, 32, L06814 CrossRef.
- S. C. Smith, J. D. Lee, W. J. Bloss, G. P. Johnson, T. Ingham and D. E. Heard, Atmos. Chem. Phys., 2006, 6, 1435 CrossRef CAS.
- R. Sommariva, W. J. Bloss, N. Brough, N. Carslaw, M. Flynn, A.-L. Haggerstone, D. E. Heard, J. R. Hopkins, J. D. Lee, A. C. Lewis, G. McFiggans, P. S. Monks, S. A. Penkett, M. J. Pilling, J. M. C. Plane, K. A. Read, A. Saiz-Lopez, A. R. Rickard and P. I. Williams, Atmos. Chem. Phys., 2006, 6, 1135 CrossRef CAS.
- Y. Kanaya, Y. Yokouchi, J. Matsumoto, K. Nakamura, S. Kato, H. Tanimoto, H. Furutani, K. Toyota and H. Akimoto, Geophys. Res. Lett., 2002, 29, 531 CrossRef.
- Y. Kanaya, R. Cao, S. Kato, Y. Miyakawa, Y. Kajii, H. Tanimoto, Y. Yokouchi, M. Mochida, K. Kawamura and H. Akimoto, J. Geophys. Res., 2007, 112, D11308 CrossRef.
- T. A. Kovacs, W. H. Brune, H. Harder, M. Martinez, J. B. Simpas, G. J. Frost, E. Williams, T. Jobson, C. Stroud, V. Young, A. Fried and B. Wert, J. Environ. Monit., 2003, 5, 68 RSC.
- Y. Sadanaga, A. Yoshino, S. Kato and Y. Kajii, Environ. Sci. Technol., 2005, 39, 8847 CrossRef CAS.
- V. Sinha, J. Williams, J. Lelieveld, T. M. Ruuskanen, M. K. Kajos, J. Patokoski, H. Hellen, H. Hakola, D. Mogensen, M. Boy, J. Rinne and M. Kulmala, Environ. Sci. Technol., 2010, 44, 6614 CrossRef CAS.
- P. Di Carlo, W. H. Brune, M. Martinez, H. Harder, R. Lesher, X. R. Ren, T. Thornberry, M. A. Carroll, V. Young, P. B. Shepson, D. Riemer, E. Apel and C. Campbell, Science, 2004, 304, 722 CrossRef CAS.
- T. Ingham, A. Goddard, L. K. Whalley, K. L. Furneaux, P. M. Edwards, C. P. Seal, D. E. Self, G. P. Johnson, K. A. Read, J. D. Lee and D. E. Heard, Atmos. Meas. Tech., 2009, 2, 465 CrossRef CAS.
- J. D. Lee, J. C. Young, K. A. Read, J. F. Hamilton, J. R. Hopkins, A. C. Lewis, B. J. Bandy, J. Davey, P. Edwards, T. Ingham, D. E. Self, S. C. Smith, M. J. Pilling and D. E. Heard, J. Atmos. Chem., 2009, 64, 53 CrossRef CAS.
- D. H. Ehhalt and F. Rohrer, J. Geophys. Res., 2000, 105 Search PubMed.
- S. Vaughan, T. Ingham, L. K. Whalley, D. Stone, M. J. Evans, K. A. Read, J. D. Lee, S. J. Moller, L. J. Carpenter, A. C. Lewis, Z. L. Fleming and D. E. Heard, Atmos. Chem. Phys., 2012, 12, 2149 CrossRef CAS.
- V. Sinha, J. Williams, J. N. Crowley and J. Lelieveld, Atmos. Chem. Phys., 2008, 8, 2213 CrossRef CAS.
- S. Kim, A. Guenther, T. Karl and J. Greenberg, Atmos. Chem. Phys., 2011, 11, 8613 CrossRef CAS.
- D. Mogensen, S. Smolander, A. Sogachev, L. Zhou, V. Sinha, A. Guenther, J. Williams, T. Nieminen, M. K. Kajos, J. Rinne, M. Kumala and M. Boy, Atmos. Chem. Phys., 2011, 11, 9709 CrossRef CAS.
- A. C. Lewis, N. Carslaw, P. J. Marriott, R. M. Kinghorn, P. Morrison, A. L. Lee, K. D. Bartle and M. J. Pilling, Nature, 2000, 405, 778 CrossRef CAS.
- S. Kato, T. Sato and Y. Kajii, Atmos. Environ., 2011, 45, 5531 CrossRef CAS.
- L. K. Whalley, P. M. Edwards, K. L. Furneaux, A. Goddard, T. Ingham, M. J. Evans, D. Stone, J. R. Hopkins, C. E. Jones, A. Karunaharan, J. D. Lee, A. C. Lewis, P. S. Monks, S. J. Moller and D. E. Heard, Atmos. Chem. Phys., 2011, 11, 7223 CrossRef CAS.
- A. Hofzumahaus, F. Rohrer, K. D. Lu, B. Bohn, T. Brauers, C. C. Chang, H. Fuchs, F. Holland, K. Kita, Y. Kondo, X. Li, S. R. Lou, M. Shao, L. M. Zeng, A. Wahner and Y. H. Zhang, Science, 2009, 324, 1702 CrossRef CAS.
- D. E. Heard and M. J. Pilling, Chem. Rev., 2003, 103, 5163 CrossRef CAS.
- P. S. Monks, Chem. Soc. Rev., 2005, 34, 376 RSC.
- P. S. Monks, C. Granier, S. Fuzzi, A. Stohl, M. L. Williams, H. Akimoto, M. Amann, A. Baklanov, U. Baltensperger, I. Bey, N. Blake, R. S. Blake, K. Carslaw, O. R. Cooper, F. Dentener, D. Fowler, E. Fragkou, G. J. Frost, S. Generoso, P. Ginoux, V. Grewe, A. Guenther, H. C. Hansson, S. Henne, J. Hjorth, A. Hofzumahaus, H. Huntrieser, I. S. A. Isaksen, M. E. Jenkin, J. Kaiser, M. Kanakidou, Z. Klimont, M. Kulmala, P. Laj, M. G. Lawrence, J. D. Lee, C. Liousse, M. Maione, G. McFiggans, A. Metzger, A. Mieville, N. Moussiopoulos, J. J. Orlando, C. D. O'Dowd, P. I. Palmer, D. D. Parrish, A. Petzold, U. Platt, U. Poeschl, A. S. H. Prevot, C. E. Reeves, S. Reimann, Y. Rudich, K. Sellegri, R. Steinbrecher, D. Simpson, H. ten Brink, J. Theloke, G. R. van der Werf, R. Vautard, V. Vestreng, C. Vlachokostas and R. von Glasow, Atmos. Environ., 2009, 43, 5268 CrossRef CAS.
- P. Laj, J. Klausen, M. Bilde, C. Plass-Duelmer, G. Pappalardo, C. Clerbaux, U. Baltensperger, J. Hjorth, D. Simpson, S. Reimann, P. F. Coheur, A. Richter, M. De Maziere, Y. Rudich, G. McFiggans, K. Torseth, A. Wiedensohler, S. Morin, M. Schulz, J. D. Allan, J. L. Attie, I. Barnes, W. Birmili, J. P. Cammas, J. Dommen, H. P. Dorn, D. Fowler, S. Fuzzi, M. Glasius, C. Granier, M. Hermann, I. S. A. Isaksen, S. Kinne, I. Koren, F. Madonna, M. Maione, A. Massling, O. Moehler, L. Mona, P. S. Monks, D. Mueller, T. Mueller, J. Orphal, V. H. Peuch, F. Stratmann, D. Tanre, G. Tyndall, A. A. Riziq, M. Van Roozendael, P. Villani, B. Wehner, H. Wex and A. A. Zardini, Atmos. Environ., 2009, 43, 5351 CrossRef CAS.
- Free radicals in the troposphere: Their measurement, interpretation of field data and future directions, ed. D. E. Heard, ACCENT Leeds Expert Meeting, ACCENT Secretariat, 2006 Search PubMed.
- Analytical Techniques for Atmospheric Measurement, ed. D. E. Heard, Blackwell Publishing, 2006 Search PubMed.
- K. C. Clemitshaw, Crit. Rev. Environ. Sci. Technol., 2004, 34, 1 CrossRef CAS.
- H. Fuchs, B. Bohn, A. Hofzumahaus, F. Holland, K. Lu, S. Nehr, F. Rohrer and A. Wahner, Atmos. Meas. Tech., 2011, 4, 1209 CrossRef CAS.
- J. Mao, X. Ren, W. Brune, D. M. Van Duin, R. C. Cohen, J. H. Park, A. Goldstein, F. Paulot, M. R. Beaver, J. D. Crounse, P. O. Wennberg, J. P. DiGangi, S. B. Henry, F. N. Keutsch, C. Park, G. W. Schade, G. M. Wolfe and J. A. Thornton, Atmos. Chem. Phys., 2012, 12, 6715 Search PubMed.
- M. E. Jenkin, S. M. Saunders and M. J. Pilling, Atmos. Environ., 1997, 31, 81 CrossRef CAS.
- M. E. Jenkin, S. M. Saunders, V. Wagner and M. J. Pilling, Atmos. Chem. Phys., 2003, 3, 181 CrossRef CAS.
- S. M. Saunders, M. E. Jenkin, R. G. Derwent and M. J. Pilling, Atmos. Chem. Phys., 2003, 3, 161 CrossRef CAS.
- C. Bloss, V. Wagner, M. E. Jenkin, R. Volkamer, W. J. Bloss, J. D. Lee, D. E. Heard, K. Wirtz, M. Martin-Reviejo, G. Rea, J. C. Wenger and M. J. Pilling, Atmos. Chem. Phys., 2005, 5, 641 CrossRef CAS.
- W. Stockwell, R. F. Kirchner, M. Kuhn and S. Seefeld, J. Geophys. Res., [Atmos.], 1997, 102, 25847 CrossRef CAS.
- M. Michou, D. Saint-Martin, H. Teyssedre, A. Alias, F. Karcher, D. Olivie, A. Voldoire, B. Josse, V. H. Peuch, H. Clark, J. N. Lee and F. Cheroux, Geoscientific Model Development, 2011, 4, 873 CrossRef.
- K. M. Emmerson and M. J. Evans, Atmos. Chem. Phys., 2009, 9, 1831 CrossRef CAS.
- N. Carslaw, D. J. Creasey, D. E. Heard, P. J. Jacobs, J. D. Lee, A. C. Lewis, J. B. McQuaid and M. J. Pilling, J. Geophys. Res., 2002, 107, 5 Search PubMed.
- Y. Kanaya, Y. Sadanaga, J. Matsumoto, U. K. Sharma, J. Hirokawa, Y. Kajii and H. Akimoto, J. Geophys. Res., [Atmos.], 2000, 105, 24205 CrossRef CAS.
- Y. Kanaya, Y. Sadanaga, K. Nakamura and H. Akimoto, J. Geophys. Res., [Atmos.], 2001, 106, 24197 CrossRef CAS.
- A. S. Mahajan, J. M. C. Plane, H. Oetjen, L. Mendes, R. W. Saunders, A. Saiz-Lopez, C. E. Jones, L. J. Carpenter and G. McFiggans, Atmos. Chem. Phys., 2010, 10, 4611 CrossRef CAS.
- K. A. Read, A. S. Mahajan, L. J. Carpenter, M. J. Evans, B. V. E. Faria, D. E. Heard, J. R. Hopkins, J. D. Lee, S. J. Moller, A. C. Lewis, L. Mendes, J. B. McQuaid, H. Oetjen, A. Saiz-Lopez, M. J. Pilling and J. M. C. Plane, Nature, 2008, 453, 1232 CrossRef CAS.
- K. L. Furneaux, L. K. Whalley, D. E. Heard, H. M. Atkinson, W. J. Bloss, M. J. Flynn, M. W. Gallagher, T. Ingham, L. Kramer, J. D. Lee, R. Leigh, G. B. McFiggans, A. S. Mahajan, P. S. Monks, H. Oetjen, J. M. C. Plane and J. D. Whitehead, Atmos. Chem. Phys., 2010, 10, 3645 CrossRef CAS.
- R. Commane, K. Seitz, C. S. E. Bale, W. J. Bloss, J. Buxmann, T. Ingham, U. Platt, D. Poehler and D. E. Heard, Atmos. Chem. Phys., 2011, 11, 6721 CrossRef CAS.
- F. Taketani, Y. Kanaya and H. Akimoto, J. Phys. Chem. A, 2008, 112, 2370 CrossRef CAS.
- F. Taketani, Y. Kanaya and H. Akimoto, Atmos. Environ., 2009, 43, 1660 CrossRef CAS.
- J. R. Olson, J. H. Crawford, G. Chen, W. H. Brune, I. C. Faloona, D. Tan, H. Harder and M. Martinez, J. Geophys. Res., 2006, 111, D10301 CrossRef.
- M. Hanke, J. Uecker, T. Reiner and F. Arnold, Int. J. Mass Spectrom., 2002, 213, 91 CrossRef CAS.
- G. D. Edwards, C. Cantrell, S. Stephens, B. Hill, O. Goyea, R. Shetter, R. L. Mauldin, E. Kosciuch, D. Tanner and F. Eisele, Anal. Chem. (Washington, DC, U. S.), 2003, 75, 5317 CrossRef CAS.
- G. H. Mount, J. Geophys. Res., [Atmos.], 1992, 97, 2427 CrossRef CAS.
- F. J. Comes, W. Armerding, M. Spiekermann, J. Walter and C. Ruger, Ber. Bunsen-Ges., 1993, 97, 1156 CrossRef CAS.
- F. J. Comes, W. Armerding, M. Spiekermann, J. Walter and C. Ruger, Atmos. Environ., 1995, 29, 169 CrossRef CAS.
- H. P. Dorn, U. Brandenburger, T. Brauers and H. Hausmann, J. Atmos. Sci., 1995, 52, 3373 CrossRef.
- H. P. Dorn, U. Brandenburger, T. Brauers, M. Hausmann and D. H. Ehhalt, Geophys. Res. Lett., 1996, 23, 2537 CrossRef CAS.
- D. Perner, U. Platt, M. Trainer, G. Hubler, J. Drummond, W. Junkermann, J. Rudolph, B. Schubert, A. Volz, D. H. Ehhalt, K. J. Rumpel and G. Helas, J. Atmos. Chem., 1987, 5, 185 CrossRef CAS.
- D. Perner, Fresenius’ Z. Anal. Chem., 1989, 333, 699 CrossRef.
- G. Hubler, D. Perner, U. Platt, A. Tonnissen and D. H. Ehhalt, J. Geophys. Res., [Atmos.], 1984, 89, 1309 CrossRef.
- E. Schlosser, T. Brauers, H.-P. Dorn, H. Fuchs, A. Hofzumahaus, F. Holland and A. Wahner, J. Atmos. Chem., 2007, 56, 187 CrossRef CAS.
- E. Schlosser, T. Brauers, H.-P. Dorn, H. Fuchs, R. H'aseler, A. Hofzumahaus, F. Holland, A. Wahner, Y. Kanay, Y. Kajii, S. Miyamoto, S. Nishida, K. Watanabe, A. Yoshino, D. Kubistin, M. Martinez, M. Rudolf, H. Harder, H. Berresheim, T. Elste, C. Plass-Dülmer, G. Stange and U. Schurath, Atmos. Chem. Phys., 2009, 9, 7923 CrossRef CAS.
- D. Mihelcic, D. H. Ehhalt, J. Klomfass, G. F. Kulessa, U. Schmidt and M. Trainer, Ber. Bunsen-Ges., 1978, 82, 16 CAS.
- D. Mihelcic, D. Klemp, P. Musgen, H. W. Patz and A. Volzthomas, J. Atmos. Chem., 1993, 16, 313 CrossRef CAS.
- D. Mihelcic, F. Holland, A. Hofzumahaus, L. Hoppe, S. Konrad, P. Musgen, H. W. Patz, H. J. Schafer, T. Schmitz, A. Volz-Thomas, K. Bachmann, S. Schlomski, U. Platt, A. Geyer, B. Alicke and G. K. Moortgat, J. Geophys. Res., [Atmos.], 2003, 108, 8254 CrossRef.
- H. Fuchs, T. Brauers, H. P. Dorn, H. Harder, R. Häseler, A. Hofzumahaus, F. Holland, Y. Kanaya, Y. Kajii, D. Kubistin, S. Lou, M. Martinez, K. Miyamoto, S. Nishida, M. Rudolf, E. Schlosser, A. Wahner, A. Yoshino and U. Schurath, Atmos. Chem. Phys., 2010, 10, 12233 CrossRef CAS.
- D. E. Heard, Annu. Rev. Phys. Chem., 2006, 57, 191–216 CrossRef CAS.
- M. Siese, K. H. Becker, K. J. Brockmann, H. Geiger, A. Hofzumahaus, F. Holland, D. Mihelcic and K. Wirtz, Environ. Sci. Technol., 2001, 35, 4660 CrossRef CAS.
- W. J. Bloss, J. D. Lee, C. Bloss, D. E. Heard, M. J. Pilling, K. Wirtz, M. Martin-Reviejo and M. Siese, Atmos. Chem. Phys., 2004, 4, 571 CrossRef CAS.
- D. J. Creasey, P. A. Halford-Maw, D. E. Heard, M. J. Pilling and B. J. Whitaker, J. Chem. Soc., Faraday Trans., 1997, 93, 2907 RSC.
- R. Commane, C. F. A. Floquet, T. Ingham, D. Stone, M. J. Evans and D. E. Heard, Atmos. Chem. Phys., 2010, 10, 8783 CrossRef CAS.
- L. K. Whalley, K. L. Furneaux, A. Goddard, J. D. Lee, A. Mahajan, H. Oetjen, K. A. Read, N. Kaaden, L. J. Carpenter, A. C. Lewis, J. M. C. Plane, E. S. Saltzman, A. Wiedensohler and D. E. Heard, Atmos. Chem. Phys., 2010, 10, 1555 CrossRef CAS.
- D. Tan, I. Faloona, J. B. Simpas, W. Brune, J. Olson, J. Crawford, M. Avery, G. Sachse, S. Vay, S. Sandholm, H. W. Guan, T. Vaughn, J. Mastromarino, B. Heikes, J. Snow, J. Podolske and H. Singh, J. Geophys. Res., [Atmos.], 2001, 106, 32667 CrossRef CAS.
- I. C. Faloona, D. Tan, R. L. Lesher, N. L. Hazen, C. L. Frame, J. B. Simpas, H. Harder, M. Martinez, P. di Carlo, X. Ren and W. H. Brune, J. Atmos. Chem., 2004, 47, 139 CrossRef CAS.
- S. Lou, F. Holland, F. Rohrer, K. Lu, B. Bohn, T. Brauers, C. C. Chang, H. Fuchs, R. Haeseler, K. Kita, Y. Kondo, X. Li, M. Shao, L. Zeng, A. Wahner, Y. Zhang, W. Wang and A. Hofzumahaus, Atmos. Chem. Phys., 2010, 10, 11243 CrossRef CAS.
- A. Hofzumahaus, F. Rohrer, K. Lu, B. Bohn, T. Brauers, C. C. Chang, H. Fuchs, F. Holland, K. Kita, Y. Kondo, X. Li, S. Lou, M. Shao, L. Zeng, A. Wahner and Y. Zhang, Science, 2009, 324, 1702 CrossRef CAS.
- F. Holland, M. Hessling and A. Hofzumahaus, J. Atmos. Sci., 1995, 52, 3393 CrossRef.
- M. Martinez, H. Harder, D. Kubistin, M. Rudolf, H. Bozem, G. Eerdekens, H. Fischer, T. Klupfel, C. Gurk, R. Konigstedt, U. Parchatka, C. L. Schiller, A. Stickler, J. Williams and J. Lelieveld, Atmos. Chem. Phys., 2010, 10, 3759 CrossRef CAS.
- S. Dusanter, D. Vimal and P. S. Stevens, Atmos. Chem. Phys., 2008, 8, 321 CrossRef CAS.
- S. Dusanter, D. Vimal, P. S. Stevens, R. Volkamer and L. T. Molina, Atmos. Chem. Phys., 2009, 9, 1665 CrossRef CAS.
- Y. Kanaya, Y. Sadanaga, J. Hirokawa, Y. Kajii and H. Akimoto, J. Atmos. Chem., 2001, 38, 73 CrossRef CAS.
- Y. Kanaya and H. Akimoto, Chem. Rec., 2002, 2, 199 CrossRef CAS.
- Y. Kanaya, R. Cao, H. Akimoto, M. Fukuda, Y. Komazaki, Y. Yokouchi, M. Koike, H. Tanimoto, N. Takegawa and Y. Kondo, J. Geophys. Res., [Atmos.], 2007, 112 Search PubMed.
- Y. Sadanaga, A. Yoshino, K. Watanabe, A. Yoshioka, Y. Wakazono, Y. Kanaya and Y. Kajii, Rev. Sci. Instrum., 2004, 75, 2648 CrossRef CAS.
- Y. Sadanaga, A. Yoshino, K. Shungo and K. Yoshizumi, Environ. Sci. Technol., 2005, 39, 8847 CrossRef CAS.
- D. Amedro, K. Miyazaki, A. Parker, C. Schoernaecker and C. Fittschen, J. Environ. Sci.(Beijing, China), 2012, 24, 78 CAS.
- M. S. Alam, M. Camredon, A. R. Rickard, T. Carr, K. P. Wyche, K. E. Hornsby, P. S. Monks and W. J. Bloss, Phys. Chem. Chem. Phys., 2011, 12, 11002 RSC.
- D. R. Glowacki, A. Goddard, K. Hemavibool, T. L. Malkin, R. Commane, F. Anderson, W. J. Bloss, D. E. Heard, T. Ingham, M. J. Pilling and P. W. Seakins, Atmos. Chem. Phys., 2007, 7, 5371–5390 CrossRef CAS.
- T. L. Malkin, A. Goddard, D. E. Heard and P. W. Seakins, Atmos. Chem. Phys., 2010, 10, 1441 CrossRef CAS.
- R. Dlugi, M. Berger, M. Zelger, A. Hofzumahaus, M. Siese, F. Holland, A. Wisthaler, W. Grabmer, A. Hansel, R. Koppmann, G. Kramm, M. Mollmann-Coers and A. Knaps, Atmos. Chem. Phys., 2010, 10, 6215 CrossRef CAS.
- H. Fuchs, F. Holland and A. Hofzumahaus, Rev. Sci. Instrum., 2008, 79, 084104 CrossRef.
- M. Hanke, J. Uecker, T. Reiner and F. Arnold, Int. J. Mass Spectrom., 2002, 213, 91 CrossRef CAS.
- H. Fuchs, T. Brauers, R. Häseler, F. Holland, D. Mihelcic, P. Müsgen, F. Rohrer, R. Wegener and A. Hofzumahaus, Atmos. Meas. Tech., 2009, 2, 55 CrossRef CAS.
- J. Liao, L. G. Huey, D. J. Tanner, N. Brough, S. Brooks, J. E. Dibb, J. Stutz, J. L. Thomas, B. Lefer, C. Haman and K. Gorham, Atmos. Chem. Phys., 2011, 11, 8577 CrossRef CAS.
- S. J. Sjostedt, L. G. Huey, D. J. Tanner, J. Peischl, G. Chen, J. E. Dibb, B. Lefer, M. A. Hutterli, A. J. Beyersdorf, N. J. Blake, D. R. Blake, D. Sueper, T. Ryerson, J. Burkhart and A. Stohl, Atmos. Environ., 2007, 41, 5122 CrossRef CAS.
- H. Berresheim, T. Elste, C. Plass-Dülmer, F. L. Eiseleb and D. J. Tannerb, Int. J. Mass Spectrom., 2000, 202, 91 CrossRef CAS.
- F. Rohrer and H. Berresheim, Nature, 2006, 442, 184 CrossRef CAS.
- F. L. Eisele and J. D. Bradshaw, Anal. Chem. (Washington, DC, U. S.), 1993, 65, A927 Search PubMed.
- D. J. Tanner, A. Jefferson and F. L. Eisele, J. Geophys. Res., [Atmos.], 1997, 102, 6415 CrossRef CAS.
- R. L. Mauldin, D. J. Tanner and F. L. Eisele, J. Geophys. Res., [Atmos.], 1998, 103, 3361 CrossRef CAS.
- A. Kukui, G. Ancellet and G. Le Bras, J. Atmos. Chem., 2008, 61, 133 CrossRef CAS.
- J. H. Mather and W. H. Brune, Geophys. Res. Lett., 1990, 17, 1283 CrossRef CAS.
- U. Aschmutat, M. Hessling, F. Holland and A. Hofzumahaus, Phys.-Chem. Behav. Atmos. Pollut., [Proc. Eur. Symp.], 1994, 811 CAS.
- H. Fuchs, B. Bohn, A. Hofzumahaus, F. Holland, K. D. Lu, S. Nehr, F. Rohrer and A. Wahner, Atmos. Meas. Tech., 2011, 4, 1255 CrossRef.
- A. Hofzumahaus, U. Aschmutat, U. Brandenburger, T. Brauers, H. P. Dorn, M. Hausmann, M. Hessling, F. Holland, C. Plass-Dulmer and D. H. Ehhalt, J. Atmos. Chem., 1998, 31, 227 CrossRef CAS.
- C. Y. Chan, T. M. Hard, A. A. Mehrabzadeh, L. A. George and R. J. O'Brien, J. Geophys. Res., 1990, 95, 18569 CrossRef.
- T. M. Hard, L. A. George and R. J. O'Brien, J. Atmos. Sci., 1995, 52, 3354 CrossRef.
- W. J. Bloss, J. D. Lee, C. Bloss, D. E. Heard, M. J. Pilling, K. Wirtz, M. Martin-Reviejo and M. Siese, Atmos. Chem. Phys., 2004, 4, 571 CrossRef CAS.
- F. L. Eisele, R. L. Mauldin, D. J. Tanner, C. Cantrell, E. Kosciuch, J. B. Nowak, B. Brune, I. Faloona, D. Tan, D. D. Davis, L. Wang and G. Chen, J. Geophys. Res., [Atmos.], 2001, 106, 32683 CrossRef CAS.
- E. Schlosser, T. Brauers, H. P. Dorn, H. Fuchs, R. Häseler, A. Hofzumahaus, F. Holland, A. Wahner, Y. Kanaya, Y. Kajii, K. Miyamoto, S. Nishida, K. Watanabe, A. Yoshino, D. Kubistin, M. Martinez, M. Rudolf, H. Harder, H. Berresheim, T. Elste, C. Plass-Dülmer, G. Stange and U. Schurath, Atmos. Chem. Phys., 2009, 9, 7923 CrossRef CAS.
- X. Ren, G. D. Edwards, C. Cantrell, R. L. Lesher, A. R. Metcalf, T. Shirley and W. H. Brune, J. Geophys. Res., 2003, 108, 4605 CrossRef.
- X. Ren, H. Harder, M. Martinez, I. Faloona, D. Tan, R. Lesher, P. Di Carlo, J. B. Simpas and W. H. Brune, J. Atmos. Chem., 2004, 47, 169 CrossRef CAS.
- D. E. Heard, L. K. Whalley, M. A. Blitz and P. W. Seakins, Abstract 11I-04, The sensitivity of laser-induced fluorescence instruments at low pressure to RO2 radicals and the use of this detection method to determine the yield of HO2 during OH-initiated isoprene oxidation, Proceedings Fall Meeting AGU, 2011 Search PubMed.
- K. Lu, F. Rohrer, F. Holland, H. Fuchs, B. Bohn, T. Brauers, C. C. Chang, R. Haeseler, M. Hu, K. Kita, Y. Kondo, X. Li, S. Lou, S. Nehr, M. Shao, L. Zeng, A. Wahner, Y. Zhang and A. Hofzumahaus, Atmos. Chem. Phys., 2012, 12, 1541 CrossRef CAS.
- H. Fuchs, H.-P. Dorn, M. Bachner, B. Bohn, T. Brauers, S. Gomm, A. Hofzumahaus, F. Holland, S. Nehr, F. Rohrer, R. Tillmann and A. Wahner, Atmos. Meas. Tech., 2012, 5, 2077 CrossRef.
- D. J. Tanner and F. L. Eisele, J. Geophys. Res., 1995, 100, 2883 CrossRef CAS.
- F. L. Eisele and D. J. Tanner, J. Geophys. Res., [Atmos.], 1991, 96, 9295 CrossRef CAS.
- O. Welz, J. D. Savee, D. L. Osborn, S. S. Vasu, C. J. Percival, D. E. Shallcross and C. A. Taatjes, Science, 2012, 335, 204 CrossRef CAS.
- S. A. Penkett, J. M. C. Plane, F. J. Comes, K. C. Clemitshaw and H. Coe, J. Atmos. Chem., 1999, 33, 107 CrossRef CAS.
- O. Forberich, T. Pfeiffer, M. Spiekermann, J. Walter, F. J. Comes, R. Grigonis, K. C. Clemitshaw and R. A. Burgess, J. Atmos. Chem., 1999, 33, 155 CrossRef CAS.
- J. L. Grenfell, N. H. Savage, R. M. Harrison, S. A. Penkett, O. Forberich, F. J. Comes, K. C. Clemitshaw, R. A. Burgess, L. M. Cardenas, B. Davison and G. G. McFadyen, J. Atmos. Chem., 1999, 33, 183 CrossRef CAS.
- K. C. Clemitshaw, L. J. Carpenter, S. A. Penkett and M. E. Jenkin, J. Geophys. Res., [Atmos.], 1997, 102, 25405 CrossRef CAS.
- T. Brauers, M. Hausmann, A. Bister, A. Kraus and H. P. Dorn, J. Geophys. Res., [Atmos.], 2001, 106, 7399 CrossRef CAS.
- D. J. Creasey, Development and implementation of the FAGE technique for measurement of OH and HO2 in the troposphere, University of Leeds, Leeds, 1998 Search PubMed.
- D. J. Creasey, D. E. Heard and J. D. Lee, J. Geophys. Res., [Atmos.], 2002, 107, 4091 CrossRef.
- N. Carslaw, D. J. Creasey, D. E. Heard, A. C. Lewis, J. B. McQuaid, M. J. Pilling, P. S. Monks, B. J. Bandy and S. A. Penkett, J. Geophys. Res., [Atmos.], 1999, 104, 30241 CrossRef CAS.
- N. Carslaw, P. J. Jacobs and M. J. Pilling, J. Geophys. Res., 1999, 104(D23), 30257 CrossRef CAS.
- N. Carslaw, D. J. Creasey, D. E. Heard, P. J. Jacobs, J. D. Lee, A. C. Lewis, J. B. McQuaid, M. J. Pilling, S. Bauguitte, S. A. Penkett, P. S. Monks and G. Salisbury, J. Geophys. Res., [Atmos.], 2002, 107, 4190 CrossRef.
- F. D. Yin, D. Grosjean and J. H. Seinfeld, J. Atmos. Chem., 1990, 11, 309 CrossRef CAS.
- F. D. Yin, D. Grosjean, R. C. Flagan and J. H. Seinfeld, J. Atmos. Chem., 1990, 11, 365 CrossRef CAS.
- H. Berresheim, T. Elste, H. G. Tremmel, A. G. Allen, H. C. Hansson, K. Rosman, M. Dal Maso, J. M. Makela, M. Kulmala and C. D. O'Dowd, J. Geophys. Res., [Atmos.], 2002, 107, 8100 CrossRef.
- G. Salisbury, A. R. Rickard, P. S. Monks, B. J. Allan, S. Bauguitte, S. A. Penkett, N. Carslaw, A. C. Lewis, D. J. Creasey, D. E. Heard, P. J. Jacobs and J. D. Lee, J. Geophys. Res., [Atmos.], 2001, 106, 12669 CrossRef CAS.
- G. Salisbury, P. S. Monks, S. Bauguitte, B. J. Bandy and S. A. Penkett, J. Atmos. Chem., 2002, 41, 163 CrossRef CAS.
- D. J. Creasey, G. E. Evans, D. E. Heard and J. D. Lee, J. Geophys. Res., 2003, 108, 4475 CrossRef.
- R. Sommariva, A.-L. Haggerstone, L. J. Carpenter, N. Carslaw, D. J. Creasey, D. E. Heard, J. D. Lee, A. C. Lewis, M. J. Pilling and J. Zador, Atmos. Chem. Phys., 2004, 4, 839 CrossRef CAS.
- B. J. Allan, G. McFiggans and J. M. C. Plane, J. Geophys. Res., 2000, 105, 14363 CrossRef CAS.
- A. L. Haggerstone, L. J. Carpenter, N. Carslaw and G. McFiggans, J. Geophys. Res., 2005, 110 Search PubMed.
- H. Berresheim, C. Plass-Dulmer, T. Elste, N. Mihalopoulos and F. Rohrer, Atmos. Chem. Phys., 2003, 3, 639 CrossRef CAS.
- M. Vrekoussis, M. Kanakidou, N. Mihalopoulos, P. J. C. A. Lelieveld, D. P. H. Berresheim and E. Baboukas, Atmos. Chem. Phys., 2004, 4, 169 CrossRef CAS.
- Y. Kanaya, J. Matsumoto, S. Kato and H. Akimoto, J. Geophys. Res., [Atmos.], 2001, 106, 24209 CrossRef CAS.
- Y. Kanaya, J. Matsumoto and H. Akimoto, J. Geophys. Res., [Atmos.], 2002, 107, 4368 CrossRef.
- Y. Kanaya, K. Nakamura, S. Kato, J. Matsumoto, H. Tanimoto and H. Akimoto, Atmos. Environ., 2002, 36, 4929 CrossRef CAS.
- B. Qi, Y. Kanaya, A. Takami, S. Hatakeyama, S. Kato, Y. Sadanaga, H. Tanimoto and Y. Kajii, J. Geophys. Res., [Atmos.], 2007, 112 Search PubMed.
- C. C. Kircher and S. P. Sander, J. Phys. Chem., 1984, 88, 2082 CrossRef CAS.
- D. Stone and D. M. Rowley, Phys. Chem. Chem. Phys., 2005, 7, 2156 RSC.
- N. Kanno, K. Tonokura, A. Tezaki and M. Koshi, J. Phys. Chem. A, 2005, 109, 3153 CrossRef CAS.
- B. Alicke, K. Hebestreit, J. Stutz and U. Platt, Nature, 1999, 397, 572 CrossRef CAS.
- J. Stutz, K. Hebestreit, B. Alicke and U. Platt, J. Atmos. Chem., 1999, 34, 65 CrossRef CAS.
- R. M. Harrison, J. P. Shi and J. L. Grenfell, Atmos. Environ., 1998, 32, 2769 CrossRef CAS.
- J. Thornton and J. P. D. Abbatt, J. Geophys. Res., [Atmos.], 2005, 110 Search PubMed.
- J. A. Thornton, L. Jaeglé and V. F. McNeill, J. Geophys. Res., 2008, 113, D05303 CrossRef.
- H. L. Macintyre and M. J. Evans, Atmos. Chem. Phys., 2011, 11, 10965 CrossRef CAS.
- R. Wada, J. M. Beames and A. J. Orr-Ewing, J. Atmos. Chem., 2007, 58, 69 CrossRef CAS.
- D. E. Heard, K. Read, J. Methven, S. Al-Haider, W. J. Bloss, G. P. Johnson, M. J. Pilling, P. W. Seakins, S. C. Smith, R. Sommariva, J. C. Stanton, T. J. Still, B. Brooks, G. De Leeuw, A. V. Jackson and J. B. McQuaid, et al. , Atmos. Chem. Phys., 2006, 6, 2241 CrossRef CAS.
- R. Sommariva, M. J. Pilling, W. J. Bloss, D. E. Heard, J. D. Lee, Z. L. Fleming, P. S. Monks, J. M. C. Plane, A. Saiz-Lopez, S. M. Ball, M. Bitter, R. L. Jones, N. Brough, S. A. Penkett, J. R. Hopkins, A. C. Lewis and K. A. Read, Atmos. Chem. Phys., 2007, 7, 587 CrossRef CAS.
- A. Saiz-Lopez, J. A. Shillito, H. Coe and J. M. C. Plane, Atmos. Chem. Phys., 2006, 6, 1513 CrossRef CAS.
- M. Bitter, S. M. Ball, I. M. Povey and R. L. Jones, Atmos. Chem. Phys., 2005, 5, 2547 CrossRef CAS.
- J. D. Lee, G. McFiggans, J. D. Allan, A. R. Baker, S. M. Ball, A. K. Benton, L. J. Carpenter, R. Commane, B. D. Finley, M. Evans, E. Fuentes, K. Furneaux, A. Goddard, N. Good, J. F. Hamilton, D. E. Heard, H. Herrmann, A. Hollingsworth, J. R. Hopkins, T. Ingham, M. Irwin, C. E. Jones, R. L. Jones, W. C. Keene, M. J. Lawler, S. Lehmann, A. C. Lewis, M. S. Long, A. Mahajan, J. Methven, S. J. Moller, K. Mueller, T. Mueller, N. Niedermeier, S. O'Doherty, H. Oetjen, J. M. C. Plane, A. A. P. Pszenny, K. A. Read, A. Saiz-Lopez, E. S. Saltzman, R. Sander, R. von Glasow, L. Whalley, A. Wiedensohler and D. Young, Atmos. Chem. Phys., 2010, 10, 1031 CrossRef CAS.
- L. J. Carpenter, Z. L. Fleming, K. A. Read, J. D. Lee, S. J. Moller, J. R. Hopkins, R. M. Purvis, A. C. Lewis, K. Mueller, B. Heinold, H. Herrmann, K. W. Fomba, D. van Pinxteren, C. Mueller, I. Tegen, A. Wiedensohler, T. Mueller, N. Niedermeier, E. P. Achterberg, M. D. Patey, E. A. Kozlova, M. Heimann, D. E. Heard, J. M. C. Plane, A. Mahajan, H. Oetjen, T. Ingham, D. Stone, L. K. Whalley, M. J. Evans, M. J. Pilling, R. J. Leigh, P. S. Monks, A. Karunaharan, S. Vaughan, S. R. Arnold, J. Tschritter, D. Poehler, U. Friess, R. Holla, L. M. Mendes, H. Lopez, B. Faria, A. J. Manning and D. W. R. Wallace, J. Atmos. Chem., 2011, 67, 87 CrossRef CAS.
- V. Sinha, J. Williams, J. M. Diesch, F. Drewnick, M. Martinez, H. Harder, E. Regelin, D. Kubistin, H. Bozem, Z. Hosaynali-Beygi, H. Fischer, M. D. Andres-Hernandez, D. Kartal, J. A. Adame and J. Lelieveld, Atmos. Chem. Phys., 2012, 12, 4979 CrossRef.
- B. J. H. v. Stratum, J. V.-G. d. Arellano, H. G. Ouwersloot, K. v. d. Dries, T. W. v. Laar, M. Martinez, J. Lelieveld, J.-M. Diesch, F. Drewnick, H. Fischer, Z. H. Beygi, H. Harder, E. Regelin, V. Sinha, J. A. Adame, M. Sorgel, R. Sander, H. Bozem, W. Song, J. Williams and N. Yassaa, Atmos. Chem. Phys., 2012, 12, 6519 Search PubMed.
- W. H. Brune, D. Tan, I. F. Faloona, L. Jaegle, D. J. Jacob, B. G. Heikes, J. Snow, Y. Kondo, R. Shetter, G. W. Sachse, B. Anderson, G. L. Gregory, S. Vay, H. B. Singh, D. D. Davis, J. H. Crawford and D. R. Blake, Geophys. Res. Lett., 1999, 26, 3077 CrossRef CAS.
- L. Jaegle, D. Jacob, W. H. Brune, D. Tan, I. C. Faloona, A. J. Weinheimer, B. A. Ridley, T. L. Campos and G. W. Sachse, Geophys. Res. Lett., 1998, 25, 1709 CrossRef CAS.
- I. Faloona, D. Tan, W. H. Brune, L. Jaegle, D. J. Jacob, Y. Kondo, M. Koike, R. Chatfield, R. Pueschel, G. Ferry, G. Sachse, S. Vay, B. Anderson, J. Hannon and H. Fuelberg, J. Geophys. Res., [Atmos.], 2000, 105, 3771 CrossRef CAS.
- L. Jaegle, D. J. Jacob, W. H. Brune and P. O. Wennberg, Atmos. Environ., 2001, 25, 469 CrossRef.
- J. Crawford, D. Davis, J. Olson, G. Chen, S. Liu, G. Gregory, J. Barrick, G. Sachse, S. Sandholm, B. Heikes, H. Singh and D. Blake, J. Geophys. Res., [Atmos.], 1999, 104, 16255 CrossRef CAS.
- C. Mari, C. Saut, D. J. Jacob, F. Ravetta, B. Anderson, M. A. Avery, D. R. Blake, W. H. Brune, I. Faloona, G. L. Gregory, B. G. Heikes, G. W. Sachse, S. T. Sandholm, H. B. Singh, R. W. Talbot, D. Tan and S. Vay, J. Geophys. Res., [Atmos.], 2003, 108, 8229 CrossRef.
- M. Blitz, D. E. Heard, M. J. Pilling, S. R. Arnold and M. P. Chipperfield, Geophys. Res. Lett., 2004, 31, L06111 CrossRef.
- S. R. Arnold, M. P. Chipperfield, M. A. Blitz, D. E. Heard and M. J. Pilling, Geophys. Res. Lett., 2004, 31, L07110 CrossRef.
- S. R. Arnold, M. P. Chipperfield and M. A. Blitz, J. Geophys. Res., [Atmos.], 2005, 110, D22305 CrossRef.
- F. Ravetta, D. J. Jacob, W. H. Brune, B. G. Heikes, B. E. Anderson, D. R. Blake, G. L. Gregory, G. W. Sachse, S. T. Sandholm, R. E. Shetter, H. B. Singh and R. W. Talbot, J. Geophys. Res., [Atmos.], 2001, 106, 32709 CrossRef CAS.
- Y. H. Wang, S. C. Liu, P. H. Wine, D. D. Davis, S. T. Sandholm, E. L. Atlas, M. A. Avery, D. R. Blake, N. J. Blake, W. H. Brune, B. G. Heikes, G. W. Sachse, R. E. Shetter, H. B. Singh, R. W. Talbot and D. Tan, J. Geophys. Res., [Atmos.], 2001, 106, 32733 CrossRef CAS.
- R. L. Mauldin, F. L. Eisele, C. A. Cantrell, E. Kosciuch, B. A. Ridley, B. Lefer, D. J. Tanner, J. B. Nowak, G. Chen, L. Wang and D. Davis, J. Geophys. Res., [Atmos.], 2001, 106, 32657 CrossRef CAS.
- D. Davis, G. Grodzinsky, G. Chen, J. Crawford, F. Eisele, L. Mauldin, D. Tanner, C. Cantrell, W. Brune, D. Tan, I. Faloona, B. Ridley, D. Montzka, J. Walega, F. Grahek, S. Sandholm, G. Sachse, S. Vay, B. Anderson, M. Avery, B. Heikes, J. Snow, D. O'Sullivan, R. Shetter, B. Lefer, D. Blake, N. Blake, M. Carroll and Y. Wang, J. Geophys. Res., [Atmos.], 2001, 106, 32691 CrossRef CAS.
- G. Chen, D. Davis, J. Crawford, B. Heikes, D. O'Sullivan, M. Lee, F. Eisele, L. Mauldin, D. Tanner, J. Collins, J. Barrick, B. Anderson, D. Blake, J. Bradshaw, S. Sandholm, M. Carroll, G. Albercook and A. Clarke, J. Atmos. Chem., 2001, 38, 317 CrossRef CAS.
- J. R. Olson, J. H. Crawford, D. D. Davis, G. Chen, M. A. Avery, J. D. W. Barrick, G. W. Sachse, S. A. Vay, S. T. Sandholm, D. Tan, W. H. Brune, I. C. Faloona, B. G. Heikes, R. E. Shetter, B. L. Lefer, H. B. Singh, R. W. Talbot and D. R. Blake, J. Geophys. Res., [Atmos.], 2001, 106, 32749 CrossRef CAS.
- F. Eisele, L. Mauldin, C. Cantrell, M. Zondlo, E. Apel, A. Fried, J. Walega, R. Shetter, B. Lefer, F. Flocke, A. Weinheimer, M. Avery, S. Vay, G. Sachse, J. Podolske, G. Diskin, J. D. Barrick, H. B. Singh, W. Brune, H. Harder, M. Martinez, A. Bandy, D. Thornton, B. Heikes, Y. Kondo, D. Riemer, S. Sandholm, D. Tan, R. Talbot and J. Dibb, J. Geophys. Res., 2003, 108, 8791 CrossRef.
- R. L. Mauldin, C. A. Cantrell, M. Zondlo, E. Kosciuch, F. L. Eisele, G. Chen, D. Davis, R. Weber, J. Crawford, D. Blake, A. Bandy and D. Thornton, J. Geophys. Res., 2003, 108, 8796 CrossRef.
- C. A. Cantrell, G. D. Edwards, S. Stephens, R. L. Mauldin, M. A. Zondlo, E. Kosciuch, F. L. Eisele, R. E. Shetter, B. L. Lefer, S. Hall, F. Flocke, A. Weinheimer, A. Fried, E. Apel, Y. Kondo, D. R. Blake, N. J. Blake, I. J. Simpson, A. R. Bandy, D. C. Thornton, B. G. Heikes, H. B. Singh, W. H. Brune, H. Harder, M. Martinez, D. J. Jacob, M. A. Avery, J. F. Barrick, G. W. Sachse, J. R. Olson, J. H. Crawford and A. D. Clarke, J. Geophys. Res., 2003, 108, 8797 CrossRef.
- J. R. Olson, J. H. Crawford, G. Chen, A. Fried, M. J. Evans, C. E. Jordan, S. T. Sandholm, D. D. Davis, B. E. Anderson, M. A. Avery, J. D. Barrick, D. R. Blake, W. H. Brune, F. L. Eisele, F. Flocke, H. Harder, D. J. Jacob, Y. Kondo, B. L. Lefer, M. Martinez, R. L. Mauldin, G. W. Sachse, R. E. Shetter, H. B. Singh, R. W. Talbot and D. Tan, J. Geophys. Res., 2004, 109, S101 CrossRef.
- N. Carslaw, D. J. Creasey, D. Harrison, D. E. Heard, M. C. Hunter, P. J. Jacobs, M. E. Jenkin, J. D. Lee, A. C. Lewis, M. J. Pilling, S. M. Saunders and P. W. Seakins, Atmos. Environ., 2001, 35, 4725 CrossRef CAS.
- D. Tan, I. Faloona, J. B. Simpas, W. Brune, P. B. Shepson, T. L. Couch, A. L. Sumner, M. A. Carroll, T. Thornberry, E. Apel, D. Riemer and W. Stockwell, J. Geophys. Res., [Atmos.], 2001, 106, 24407 CrossRef CAS.
- M. Zhang, H. Akimoto and I. Uno, J. Atmos. Chem., 2006, 54, 233 CrossRef CAS.
- X. Ren, J. R. Olson, J. Crawford, W. H. Brune, J. Mao, R. B. Long, Z. Chen, G. Chen, M. A. Avery, G. W. Sachse, J. D. Barrick, G. S. Diskin, G. Huey, A. Fried, R. C. Cohen, B. Heikes, P. O. Wennberg, H. B. Singh, D. Blake and R. Shetter, J. Geophys. Res., [Atmos.], 2008, 113, D05310 CrossRef.
- H. B. Singh, W. H. Brune, J. H. Crawford, F. Flocke and D. J. Jacob, Atmos. Chem. Phys., 2009, 9, 2301 CrossRef CAS.
- J. Mao, X. Ren, W. H. Brune, J. R. Olson, J. H. Crawford, A. Fried, L. G. Huey, R. C. Cohen, B. Heikes, H. B. Singh, D. R. Blake, G. W. Sachse, G. S. Diskin, S. R. Hall and R. E. Shetter, Atmos. Chem. Phys., 2009, 9, 163 CrossRef CAS.
- A. Guenther, C. N. Hewitt, D. Erickson, R. Fall, C. G. a. Graedel, P. Harley, L. Klinger, M. Lerdau, W. A. M. a. Pierce, B. Scholes, R. Steinbrecher, R. Tallamraju and J. T. P. Zimmerman, J. Geophys. Res., 1995, 100, 8873 CrossRef CAS.
- F. L. Eisele, G. H. Mount, F. C. Fehsenfeld, J. Harder, E. Marovich, D. D. Parrish, J. Roberts and M. Trainer, J. Geophys. Res., [Atmos.], 1994, 99, 18605 CrossRef.
- G. H. Mount and E. J. Williams, J. Geophys. Res., [Atmos.], 1997, 102, 6171 CrossRef CAS.
- S. A. McKeen, G. Mount, F. Eisele, E. Williams, J. Harder, P. Goldan, W. Kuster, S. C. Liu, K. Baumann, D. Tanner, A. Fried, S. Sewell, C. Cantrell and R. Shetter, J. Geophys. Res., [Atmos.], 1997, 102, 6467 CrossRef CAS.
- M. Trainer, E.-Y. Hsie, S. A. McKeen, R. Tallamraju, D. D. Parrish, F. C. Fehsenfeld and S. C. Liu, J. Geophys. Res., [Atmos.], 1987, 92, 11879 CrossRef CAS.
- C. A. Cantrell, R. E. Shetter, J. G. Calvert, F. L. Eisele, E. Williams, K. Baumann, W. H. Brune, P. S. Stevens and J. H. Mather, J. Geophys. Res., [Atmos.], 1997, 102, 6369 CrossRef CAS.
- A. Fried, S. McKeen, S. Sewell, J. Harder, B. Henry, P. Goldan, W. Kuster, E. Williams, K. Baumann, R. Shetter and C. Cantrell, J. Geophys. Res., 1997, 102, 6283 CrossRef CAS.
- N. Carslaw, D. J. Creasey, D. Harrison, D. E. Heard, M. C. Hunter, P. J. Jacobs, M. E. Jenkin, J. D. Lee, A. C. Lewis, M. J. Pilling, S. M. Saunders and P. W. Seakins, Atmos. Environ., 2001, 35, 4725 CrossRef CAS.
- J. Lelieveld, T. M. Butler, J. N. Crowley, T. J. Dillon, H. Fischer, L. Ganzeveld, H. Harder, M. G. Lawrence, M. Martinez, D. Taraborrelli and J. Williams, Nature, 2008, 452, 737 CrossRef CAS.
- T. M. Butler, D. Taraborrelli, C. B. H. Fischer, H. Harder, M. Martinez, J. Williams, M. G. Lawrence and J. Lelieveld, Atmos. Chem. Phys., 2008, 8, 4529 CrossRef CAS.
- T. A. M. Pugh, A. R. MacKenzie, C. N. Hewitt, B. Langford, P. M. Edwards, K. L. Furneaux, D. E. Heard, J. R. Hopkins, C. E. Jones, A. Karunaharan, J. Lee, G. Mills, P. Misztal, S. Moller, P. S. Monks and L. K. Whalley, Atmos. Chem. Phys., 2010, 10, 279 CrossRef CAS.
- D. Kubistin, H. Harder, M. Martinez, M. Rudolf, R. Sander, H. Bozem, G. Eerdekens, H. Fischer, C. Gurk, T. Klupfel, R. Konigstedt, U. Parchatka, C. L. Schiller, A. Stickler, D. Taraborrelli, J. Williams and J. Lelieveld, Atmos. Chem. Phys., 2010, 10, 9705 CrossRef CAS.
- D. Stone, M. J. Evans, P. M. Edwards, R. Commane, T. Ingham, A. R. Rickard, D. M. Brookes, J. Hopkins, R. J. Leigh, A. C. Lewis, P. S. Monks, D. Oram, C. E. Reeves, D. Stewart and D. E. Heard, Atmos. Chem. Phys., 2011, 11, 6749 CrossRef CAS.
- L. K. Whalley, P. M. Edwards, K. L. Furneaux, A. Goddard, T. Ingham, M. J. Evans, D. Stone, J. R. Hopkins, C. E. Jones, A. Karunaharan, J. D. Lee, A. C. Lewis, P. S. Monks, S. Moller and D. E. Heard, Atmos. Chem. Phys., 2011, 11, 7223 CrossRef CAS.
- D. J. Creasey, D. E. Heard and J. D. Lee, Atmos. Environ., 2001, 35, 4713 CrossRef CAS.
- D. Stone, M. J. Evans, R. Commane, T. Ingham, C. F. A. Floquet, J. B. McQuaid, D. M. Brookes, P. S. Monks, R. Purvis, J. F. Hamilton, J. Hopkins, J. Lee, A. C. Lewis, D. Stewart, J. G. Murphy, G. Mills, D. Oram, C. E. Reeves and D. E. Heard, Atmos. Chem. Phys., 2010, 10, 9415 CrossRef CAS.
- I. Faloona, D. Tan, W. Brune, J. Hurst, D. Barket, T. L. Couch, P. Shepson, E. Apel, D. Riemer, T. Thornberry, M. A. Carroll, S. Sillman, G. J. Keeler, J. Sagady, D. Hooper and K. Paterson, J. Geophys. Res., [Atmos.], 2001, 106, 24315 CrossRef CAS.
- X. R. Ren, W. H. Brune, A. Oliger, A. R. Metcalf, J. B. Simpas, T. Shirley, J. J. Schwab, C. H. Bai, U. Roychowdhury, Y. Q. Li, C. X. Cai, K. L. Demerjian, Y. He, X. L. Zhou, H. L. Gao and J. Hou, J. Geophys. Res., [Atmos.], 2006, 111 Search PubMed.
- Y. Kanaya, A. Hofzumahaus, H.-P. Dorn, T. Brauers, H. Fuchs, F. Holland, F. Rohrer, B. Bohn, R. Tillmann, R. Wegener, A. Wahner, Y. Kajii, K. Miyamoto, S. Nishida, K. Watanabe, A. Yoshino, D. Kubistin, M. Martinez, M. Rudolf, H. Harder, H. Berresheim, T. Elste, C. Plass-Dulmer, G. Stange, J. Kleffmann, Y. Elshorbany and U. Schurath, Atmos. Chem. Phys., 2011, 11, 28851 Search PubMed.
- E. Schlosser, T. Brauers, H. P. Dorn, H. Fuchs, R. Haseler, A. Hofzumahaus, F. Holland, A. Wahner, Y. Kanaya, Y. Kajii, K. Miyamoto, S. Nishida, K. Watanabe, A. Yoshino, D. Kubistin, M. Martinez, M. Rudolf, H. Harder, H. Berresheim, T. Elste, C. Plass-Dulmer, G. Stange and U. Schurath, Atmos. Chem. Phys., 2009, 9, 7923 CrossRef CAS.
- J. Lelieveld, W. Peters, F. Dentener and M. C. Krol, J. Geophys. Res., [Atmos.], 2002, 107 Search PubMed.
- J. Lelieveld, F. Dentener, W. Peters and M. C. Krol, Atmos. Chem. Phys., 2004, 4, 2337 CrossRef CAS.
- I. Bey, B. Aumont and G. Toupance, J. Geophys. Res., 2001, 106, 9991 CrossRef CAS.
- A. Guenther, T. Karl, P. Harley, C. Wiedinmyer, P. I. Palmer and C. Geron, Atmos. Chem. Phys., 2006, 6, 3181 CrossRef CAS.
- C. N. Hewitt, J. D. Lee, A. R. MacKenzie, M. P. Barkley, N. Carslaw, G. D. Carver, N. A. Chappell, H. Coe, C. Collier, R. Commane, F. Davies, B. Davison, P. Di Carlo, C. F. Di Marco, J. R. Dorsey, P. M. Edwards, M. J. Evans, D. Fowler, K. L. Furneaux, M. Gallagher, A. Guenther, D. E. Heard, C. Helfter, J. Hopkins, T. Ingham, M. Irwin, C. Jones, A. Karunaharan, B. Langford, A. C. Lewis, S. F. Lim, S. M. MacDonald, A. S. Mahajan, S. Malpass, G. McFiggans, G. Mills, P. Misztal, S. Moller, P. S. Monks, E. Nemitz, V. Nicolas-Perea, H. Oetjen, D. E. Oram, P. I. Palmer, G. J. Phillips, R. Pike, J. M. C. Plane, T. Pugh, J. A. Pyle, C. E. Reeves, N. H. Robinson, D. Stewart, D. Stone, L. K. Whalley and X. Yin, Atmos. Chem. Phys., 2010, 10, 169 CrossRef CAS.
- D. E. Heard, L. K. Whalley, M. A. Blitz and P. W. Seakins, Fall Meeting, AGU, San Francisco, California, 2011 Search PubMed.
- T. J. Dillon and J. N. Crowley, Atmos. Chem. Phys., 2008, 8, 4877 CrossRef CAS.
- A. S. Hasson, G. S. Tyndall and J. J. Orlando, J. Phys. Chem. A, 2004, 108, 5979 CrossRef CAS.
- J. P. Le Crane, M. T. Rayez, J. C. Rayez and E. Villenave, Phys. Chem. Chem. Phys., 2006, 8, 2163 RSC.
- M. E. Jenkin, M. D. Hurley and T. J. Wallington, Phys. Chem. Chem. Phys., 2007, 9, 3149 RSC.
- M. E. Jenkin, M. D. Hurley and T. J. Wallington, Phys. Chem. Chem. Phys., 2008, 10, 4274 RSC.
- M. E. Jenkin, M. A. Hurley and T. J. Wallington, J. Phys. Chem. A, 2010, 114, 408 CrossRef CAS.
- F. Paulot, J. D. Crounse, H. G. Kjaergaard, A. Kurten, J. M. St Clair, J. H. Seinfeld and P. O. Wennberg, Science, 2009, 325, 730 CrossRef CAS.
- G. Da Silva, C. Graham and Z.-F. Wang, Environ. Sci. Technol., 2010, 44, 250 CrossRef CAS.
- J. Peeters, T. L. Nguyen and L. Vereecken, Phys. Chem. Chem. Phys., 2009, 11, 5935 RSC.
- J. Peeters and J.-F. Muller, Phys. Chem. Chem. Phys., 2010, 12, 14227 RSC.
- T. L. Nguyen, L. Vereecken and J. Peeters, ChemPhysChem, 2010, 11, 3996 CrossRef CAS.
- G. M. Wolfe, J. D. Crounse, J. D. Parrish, J. M. St. Clair, M. R. Beaver, F. Paulot, T. P. Yoon, P. O. Wennberg and F. N. Keutsch, Phys. Chem. Chem. Phys., 2012, 14, 7276 RSC.
- T. Stavrakou, J. Peeters and J. F. Muller, Atmos. Chem. Phys., 2010, 10, 9863 CrossRef CAS.
- A. T. Archibald, M. C. Cooke, S. R. Utembe, D. E. Shallcross, R. G. Derwent and M. E. Jenkin, Atmos. Chem. Phys., 2010, 10, 8097 CrossRef CAS.
- G. M. Wolfe, J. A. Thornton, N. C. Bouvier-Brown, A. H. Goldstein, J. H. Park, M. McKay, D. M. Matross, J. Mao, W. H. Brune, B. W. LaFranchi, E. C. Browne, K. E. Min, P. J. Wooldridge, R. C. Cohen, J. D. Crounse, I. C. Faloona, J. B. Gilman, W. C. Kuster, J. A. de Gouw, A. Huisman and F. N. Keutsch, Atmos. Chem. Phys., 2011, 11, 1269 CrossRef CAS.
- D. Taraborrelli, M. G. Lawrence, J. N. Crowley, T. J. Dillon, S. Gromov, C. B. M. Groß, L. Vereecken and J. Lelieveld, Nat. Geosci., 2012, 5, 190 CrossRef CAS.
- J. D. Crounse, F. Paulot, H. G. Kjaergaard and P. O. Wennberg, Phys. Chem. Chem. Phys., 2011, 13, 13607 RSC.
- T. Karl, A. Guenther, A. Turnipseed, G. Tyndall, P. Artaxo and S. Martin, Atmos. Chem. Phys., 2009, 9, 7753 CrossRef CAS.
- T. A. M. Pugh, A. R. MacKenzie, B. Langford, E. Nemitz, P. K. Misztal and C. N. Hewitt, Atmos. Chem. Phys., 2011, 11, 4121 CrossRef CAS.
- A. J. Huisman, J. R. Hottle, M. M. Galloway, J. P. DiGangi, K. L. Coens, W. Choi, I. C. Faloona, J. B. Gilman, W. C. Kuster, J. de Gouw, N. C. Bouvier-Brown, A. H. Goldstein, B. W. LaFranchi, R. C. Cohen, G. M. Wolfe, J. A. Thornton, K. S. Docherty, D. K. Farmer, M. J. Cubison, J. L. Jimenez, J. Mao, W. H. Brune and F. N. Keutsch, Atmos. Chem. Phys., 2011, 11, 8883 CrossRef CAS.
- B. W. LaFranchi, G. M. Wolfe, J. A. Thornton, E. C. Browne, K.-E. Min, P. J. Wooldridge, M. McKay, A. H. Goldstein, J. B. Gilman, D. Welsh-Bon, W. C. Kuster, J. A. deGouw, J. Mao, Z. Chen, X. Ren, W. H. Brune and R. C. Cohen, Abstracts of Papers of the American Chemical Society, 2009, 237, 289 Search PubMed.
- J. Williams, J. Crowley, H. Fischer, H. Harder, M. Martinez, T. Petaja, J. Rinne, J. Back, M. Boy, M. D. Maso, J. Hakala, M. Kajos, P. Keronen, P. Rantala, J. Aalto, H. Aaltonen, J. Paatero, T. Vesala, H. Hakola, J. Levula, T. Pohja, F. Herrmann, J. Auld, E. Mesarchaki, W. Song, N. Yassaa, A. Nolscher, A. M. Johnson, T. Custer, V. Sinha, J. Thieser, N. Pouvesle, D. Taraborrelli, M. J. Tang, H. Bozem, Z. Hosaynali-Beygi, R. Axinte, R. Oswald, A. Novelli, D. Kubistin, K. Hens, U. Javed, K. Trawny, C. Breitenberger, P. J. Hidalgo, C. J. Ebben, F. M. Geiger, A. L. Corrigan, L. M. Russell, H. G. Ouwersloot, J. V.-G. d. Arellano, L. Ganzeveld, A. Vogel, M. Beck, A. Bayerle, C. J. Kampf, M. Bertelmann, F. Kollner, T. Hoffmann, J. Valverde, D. Gonzalez, M.-L. Riekkola, M. Kulmala and J. Lelieveld, Atmos. Chem. Phys., 2011, 11, 10599 CrossRef CAS.
- S. M. MacDonald, H. Oetjen, A. S. Mahajan, L. K. Whalley, P. M. Edwards, D. E. Heard, C. E. Jones and J. M. C. Plane, Atmos. Chem. Phys., 2012, 12, 5903 CrossRef.
- UN, State of World Population Reports 2011, United Nations.
- M. Martinez, H. Harder, T. A. Kovacs, J. B. Simpas, J. Bassis, R. Lesher, W. H. Brune, G. J. Frost, E. J. Williams, C. A. Stroud, B. T. Jobson, J. M. Roberts, S. R. Hall, R. E. Shetter, B. Wert, A. Fried, B. Alicke, J. Stutz, V. L. Young, A. B. White and R. J. Zamora, J. Geophys. Res., 2003, 108, 4617 CrossRef.
- R. M. Harrison, J. Yin, R. M. Tilling, X. Cai, P. W. Seakins, J. R. Hopkins, D. L. Lansley, A. C. Lewis, M. C. Hunter, D. E. Heard, L. J. Carpenter, D. J. Creasey, J. D. Lee, M. J. Pilling, N. Carslaw, K. M. Emmerson, A. Redington, R. G. Derwent, D. Ryall, G. Mills and S. A. Penkett, Sci. Total Environ., 2006, 360, 5 CrossRef CAS.
- D. E. Heard, L. J. Carpenter, D. J. Creasey, J. R. Hopkins, J. D. Lee, A. C. Lewis, M. J. Pilling, P. W. Seakins, N. Carslaw and K. M. Emmerson, Geophys. Res. Lett., 2004, 31, L18112 CrossRef.
- K. M. Emmerson, N. Carslaw, L. J. Carpenter, D. E. Heard, J. D. Lee and M. J. Pilling, J. Atmos. Chem., 2005, 52, 143 CrossRef CAS.
- K. M. Emmerson, N. Carslaw and M. J. Pilling, J. Atmos. Chem., 2005, 52, 165 CrossRef CAS.
- Y. Sadanaga, A. Yoshino, S. Kato, A. Yoshioka, K. Watanabe, Y. Miyakawa, I. Hayashi, M. Ichikawa, J. Matsumoto, A. Nishiyama, N. Akiyama, Y. Kanaya and J. Kajii, Geophys. Res. Lett., 2004, 31 Search PubMed.
- X. Ren, H. Harder, M. Martinez, R. Lesher, A. Oliger, T. Shirley, J. Adams, J. B. Simpas and W. H. Brune, Atmos. Environ., 2003, 37, 3627 CrossRef CAS.
- X. Ren, H. Harder, M. Martinez, R. Lesher, A. Oliger, J. B. Simpas, W. H. Brune, J. J. Schwab, K. L. Demerjian, Y. He, X. Zhou and H. Gao, Atmos. Environ., 2003, 37, 3639 CrossRef CAS.
- X. Ren, W. H. Brune, J. Mao, M. J. Mitchell, R. Lesher, J. B. Simpas, A. R. Metcalf, J. J. Schwab, C. Cai, Y. Li, K. L. Demerjian, H. D. Felton, G. Boynton, A. Adams, J. Perry, Y. He, X. Zhou and J. Hou, Atmos. Environ., 2006, 40, S525 Search PubMed.
- C. Cai, C. Hogrefe, P. Katsafados, G. Kallos, M. Beauharnois, J. J. Schwab, X. Ren, W. H. Brune, X. Zhou, Y. He and K. L. Demerjian, Atmos. Environ., 2008, 42, 8585 CrossRef CAS.
- J. R. Hopkins, A. C. Lewis and P. W. Seakins, Atmos. Environ., 2005, 39, 535 CrossRef CAS.
- J. D. Lee, A. C. Lewis, P. S. Monks, M. Jacob, J. F. Hamilton, J. R. Hopkins, N. M. Watson, J. E. Saxton, C. Ennis, L. J. Carpenter, N. Carslaw, Z. L. Fleming, A. Bandy, D. E. Oram, S. A. Penkett, J. Slemr, E. G. Norton, A. R. Rickard, L. K. Whalley, D. E. Heard, W. J. Bloss, T. Gravestock, S. C. Smith, J. Stanton, M. J. Pilling and M. E. Jenkin, Atmos. Environ., 2006, 40, 7598–7613 CrossRef CAS.
- K. M. Emmerson, N. Carslaw, D. C. Carslaw, J. D. Lee, G. McFiggans, W. J. Bloss, T. Gravestock, D. E. Heard, J. Hopkins, T. Ingham, M. J. Pilling, S. C. Smith, M. Jacob and P. S. Monks, Atmos. Chem. Phys., 2007, 7, 167–181 CrossRef CAS.
- K. M. Emmerson and N. Carslaw, Atmos. Environ., 2009, 43, 3220 CrossRef CAS.
- T. R. Shirley, W. H. Brune, X. Ren, J. Mao, R. Lesher, B. Cardenas, R. Volkamer, L. T. Molina, M. J. Molina, B. Lamb, E. Velasco, T. Jobson and M. Alexander, Atmos. Chem. Phys., 2006, 6, 2753 CrossRef CAS.
- L. A. George, T. M. Hard and R. J. O'Brien, J. Geophys. Res., [Atmos.], 1999, 104, 11643 CrossRef CAS.
- S. Dusanter, D. Vimal, P. S. Stevens, R. Volkamer, L. T. Molina, A. Baker, S. Meinardi, D. Blake, P. Sheehy, A. Merten, R. Zhang, J. Zheng, E. C. Fortner, W. Junkermann, M. Dubey, T. Rahn, B. Eichinger, P. Lewandowski, J. Prueger and H. Holder, Atmos. Chem. Phys., 2009, 9, 6655 CrossRef CAS.
- L. K. Emmons, E. C. Apel, J. F. Lamarque, P. G. Hess, M. Avery, D. Blake, W. Brune, T. Campos, J. Crawford, P. F. DeCarlo, S. Hall, B. Heikes, J. Holloway, J. L. Jimenez, D. J. Knapp, G. Kok, M. Mena-Carrasco, J. Olson, D. O'Sullivan, G. Sachse, J. Walega, P. Weibring, A. Weinheimer and C. Wiedinmyer, Atmos. Chem. Phys., 2010, 10, 6195 CrossRef CAS.
- L. T. Molina, S. Madronich, J. S. Gaffney, E. Apel, B. de Foy, J. Fast, R. Ferrare, S. Herndon, J. L. Jimenez, B. Lamb, A. R. Osornio-Vargas, P. Russell, J. J. Schauer, P. S. Stevens, R. Volkamer and M. Zavala, Atmos. Chem. Phys., 2010, 10, 8697 CrossRef CAS.
- B. Adhikary, G. R. Carmichael, S. Kulkarni, C. Wei, Y. Tang, A. D'Allura, M. Mena-Carrasco, D. G. Streets, Q. Zhang, R. B. Pierce, J. A. Al-Saadi, L. K. Emmons, G. G. Pfister, M. A. Avery, J. D. Barrick, D. R. Blake, W. H. Brune, R. C. Cohen, J. E. Dibb, A. Fried, B. G. Heikes, L. G. Huey, D. W. O'Sullivan, G. W. Sachse, R. E. Shetter, H. B. Singh, T. L. Campos, C. A. Cantrell, F. M. Flocke, E. J. Dunlea, J. L. Jimenez, A. J. Weinheimer, J. D. Crounse, P. O. Wennberg, J. J. Schauer, E. A. Stone, D. A. Jaffe and D. R. Reidmiller, Atmos. Chem. Phys., 2010, 10, 2091 CrossRef CAS.
- P. M. Sheehy, R. Volkamer, L. T. Molina and M. J. Molina, Atmos. Chem. Phys., 2010, 10, 6993 CrossRef CAS.
- R. Volkamer, P. Sheehy, L. T. Molina and M. J. Molina, Atmos. Chem. Phys., 2010, 10, 6969 CrossRef CAS.
- G. Li, W. Lei, M. Zavala, R. Volkamer, S. Dusanter, P. Stevens and L. T. Molina, Atmos. Chem. Phys., 2010, 10, 6551 CrossRef CAS.
- J. Mao, X. Ren, S. Chen, W. H. Brune, Z. Chen, M. Martinez, H. Harder, B. Lefer, B. Rappengluck, J. Flynn and M. Leuchner, Atmos. Environ., 2010, 44, 4107 CrossRef CAS.
- S. Chen, X. Ren, J. Mao, Z. Chen, W. H. Brune, B. Lefer, B. Rappenglueck, J. Flynn, J. Olson and J. H. Crawford, Atmos. Environ., 2010, 44, 4116 CrossRef CAS.
- A. Hofzumahaus, U. Aschmutat, M. Hessling, F. Holland and D. H. Ehhalt, Geophys. Res. Lett., 1996, 23, 2541 CrossRef CAS.
- A. Hofzumahaus, T. Brauers, U. Aschmutat, U. Brandenburger, H. P. Dorn, M. Hausmann, M. Hessling, F. Holland, C. PlassDulmer, M. Sedlacek, M. Weber and D. H. Ehhalt, Geophys. Res. Lett., 1997, 24, 3039 CrossRef CAS.
- B. Plass-Dulmer and J. Rudolph, J. Atmos. Chem., 1998, 31, 5 CrossRef.
- U. Platt, B. Alicke, R. Dubois, A. Geyer, A. H. a. Holland, M. Martinez, D. Mihelcic, T. Klupfel, B. L. W. Patz, D. Perner, F. Rohrer, J. Schafer and J. Stutz, J. Atmos. Chem., 2002, 42, 359 CrossRef CAS.
- A. Volz-Thomas, H. W. Pätz, N. Houben, S. Konrad, D. Mihelcic, T. Klüpfel and D. Perner, J. Geophys. Res., [Atmos.], 2003, 108, 8248 CrossRef.
- F. Holland, A. Hofzumahaus, R. Schafer, A. Kraus and H. W. Patz, J. Geophys. Res., 2003, 108, 8246 CrossRef.
- S. Konrad, T. Schmitz, H. J. Buers, N. Houben, K. Mannschreck, D. Mihelcic, P. Musgen, H. W. Patz, F. Holland, A. Hofzumahaus, H. J. Schafer, S. Schroder, A. Volz-Thomas, K. Bachmann, S. Schlomski, G. Moortgat and D. Grossmann, J. Geophys. Res., [Atmos.], 2003, 108 Search PubMed.
- B. Alicke, A. Geyer, A. Hofzumahaus, F. Holland, S. Konrad, H. W. Patz, J. Schafer, J. Stutz, A. Volz-Thomas and U. Platt, J. Geophys. Res., 2003, 108, 8247 CrossRef.
- A. Geyer, K. Bachmann, A. Hofzumahaus, F. Holland, S. Konrad, T. Klupfel, H. W. Patz, D. Perner, D. Mihelcic, H. J. Schafer, A. Volz-Thomas and U. Platt, J. Geophys. Res., [Atmos.], 2003, 108, 8249 CrossRef.
- S. Sillman, M. A. Carroll, T. Thornberry, B. K. Lamb, H. Westberg, W. H. Brune, I. Faloona, D. Tan, P. B. Shepson, A. L. Sumner, D. R. Hastie, C. M. Mihele, E. C. Apel, D. D. Riemer and R. G. Zika, J. Geophys. Res., 2002, 107, 4043 CrossRef.
- S. Vaughan, C. E. Canosa-Mas, C. Pfrang, D. E. Shallcross, L. Watson and R. P. Wayne, Phys. Chem. Chem. Phys., 2006, 8, 3749 RSC.
- X. R. Ren, W. H. Brune, C. A. Cantrell, G. D. Edwards, T. Shirley, A. R. Metcalf and R. L. Lesher, J. Atmos. Chem., 2005, 52, 231 CrossRef CAS.
- W. Birmili, H. Berresheim, C. Plass-Dulmer, T. Elste, S. Gilge, A. Wiedensohler and U. Uhrner, Atmos. Chem. Phys., 2003, 3, 361 CrossRef CAS.
- G. M. Handisides, C. Plass-Dulmer, S. Gilge, H. Bingemer and H. Berresheim, Atmos. Chem. Phys., 2003, 3, 1565 CrossRef CAS.
- K. Acker, D. Moller, W. Wieprecht, F. X. Meixner, B. Bohn, S. Gilge, C. Plass-Dulmer and H. Berresheim, Geophys. Res. Lett., 2006, 33 Search PubMed.
- Y. Kanaya, A. Hofzumahaus, H.-P. Dorn, T. Brauers, H. Fuchs, F. Holland, F. Rohrer, B. Bohn, R. Tillmann, R. Wegener, A. Wahner, Y. Kajii, K. Miyamoto, S. Nishida, K. Watanabe, A. Yoshino, D. Kubistin, M. Martinez, M. Rudolf, H. Harder, H. Berresheim, T. Elste, C. Plass-Dulmer, G. Strange, J. Kleffmann, Y. Elshorbany and U. Schurath, Atmos. Chem. Phys., 2012, 12, 2567 CrossRef CAS.
- Y. F. Elshorbany, J. Kleffmann, A. Hofzumahaus, R. Kurtenbach, P. Wiesen, T. Brauers, B. Bohn, H.-P. Dorn, H. Fuchs, F. Holland, F. Rohrer, R. Tillmann, R. Wegener, A. Wahner, Y. Kanaya, A. Yoshino, S. Nishida, Y. Kajii, M. Martinez, D. Kubistin, H. Harder, J. Lelieveld, T. Elste, C. Plass-Dulmer, G. Stange, H. Berresheim and U. Schurath, J. Geophys. Res., [Atmos.], 2012, 117 Search PubMed.
- F. Paulot, J. D. Crounse, H. G. Kjaergaard, A. Kurten, J. M. St. Clair, J. H. Seinfeld and P. O. Wennberg, Science, 2009, 325, 730 CrossRef CAS.
- A. Jefferson, D. J. Tanner, F. L. Eisele, D. D. Davis, G. Chen, J. Crawford, J. W. Huey, A. L. Torres and H. Berresheim, J. Geophys. Res., [Atmos.], 1998, 103, 1647 CrossRef CAS.
- R. L. Mauldin, F. L. Eisele, D. J. Tanner, E. Kosciuch, R. Shetter, B. Lefer, S. R. Hall, J. B. Nowak, M. Buhr, G. Chen, P. Wang and D. Davis, Geophys. Res. Lett., 2001, 28, 3629 CrossRef CAS.
- R. E. Honrath, M. C. Peterson, M. P. Dziobak, J. E. Dibb, M. A. Arsenault and S. A. Green, Geophys. Res. Lett., 2000, 27, 2237 CrossRef CAS.
- A. M. Grannas, A. E. Jones, J. Dibb, M. Ammann, C. Anastasio, H. J. Beine, M. Bergin, J. Bottenheim, C. S. Boxe, G. Carver, G. Chen, J. H. Crawford, F. Dominé, M. M. Frey, M. I. Guzmán, D. E. Heard, D. Helmig, M. R. Hoffmann, R. E. Honrath, L. G. Huey, M. Hutterli, H. W. Jacobi, P. Klán, B. Lefer, J. McConnell, J. Plane, R. Sander, J. Savarino, P. B. Shepson, W. R. Simpson, J. R. Sodeau, R. von Glasow, R. Weller, E. W. Wolff and T. Zhu, Atmos. Chem. Phys., 2007, 7, 4329 CrossRef CAS.
- G. Chen, D. Davis, J. Crawford, J. B. Nowak, F. Eisele, R. L. Mauldin, D. Tanner, M. Buhr, R. Shetter, B. Lefer, R. Arimoto, A. Hogan and D. Blake, Geophys. Res. Lett., 2001, 28, 3633 CrossRef CAS.
- A. L. Sumner and P. B. Shepson, Nature, 1999, 298, 230 Search PubMed.
- J. McConnell, R. C. Bales, R. W. Stewart, A. M. Thompson, M. R. Albert and R. Ramos, J. Geophys. Res., [Atmos.], 1997, 103, 10561 CrossRef.
- R. E. Honrath, Y. Lu, M. C. Peterson, J. E. Dibb, M. A. Arsenault, N. J. Cullen and K. Steffen, Atmos. Environ., 2002, 36, 2629 CrossRef CAS.
- R. Mauldin, E. Kosciuch, F. Eisele, G. Huey, D. Tanner, S. Sjostedt, D. Blake, G. Chen, J. Crawford and D. Davis, Atmos. Environ., 2010, 44, 572 CrossRef CAS.
- G. Chen, D. Davis, J. Crawford, L. M. Hutterli, L. G. Huey, D. Slusher, L. Mauldin, F. Eisele, D. Tanner, J. Dibb, M. Buhr, J. McConnell, B. Lefer, R. Shetter, D. Blake, C. H. Song, K. Lombardi and J. Arnoldy, Atmos. Environ., 2004, 38, 5451 CrossRef CAS.
- J. E. Dibb, L. G. Huey, D. L. Slusher and D. J. Tanner, Atmos. Environ., 2004, 38, 5399 CrossRef CAS.
- W. Liao, A. T. Case, J. Mastromarino, D. Tan and J. E. Dibb, Geophys. Res. Lett., 2006, 33, L09810 CrossRef.
- J. Yang, R. E. Honrath, M. C. Peterson, J. E. Dibb, A. L. Sumner, P. B. Shepson, M. Frey, H. W. Jacobi, A. Swanson and N. Blake, Atmos. Environ., 2002, 36, 2523 CrossRef CAS.
- C. A. Cantrell, G. D. Edwards, S. Stephens, L. Mauldin, E. Kosciuch, M. Zondlo and F. Eisele, J. Geophys. Res., [Atmos.], 2003, 108 Search PubMed.
- G. Chen, L. G. Huey, J. H. Crawford, J. R. Olson, M. A. Hutterli, S. Sjostedt, D. Tanner, J. Dibb, B. Lefer, N. Blake, D. Davis and A. Stohl, Atmos. Environ., 2007, 41, 7806 CrossRef CAS.
- A. Swanson, N. Blake, D. Blake, F. S. Rowland and J. Dibb, Atmos. Environ., 2002, 36, 2671 CrossRef CAS.
- M. J. Evans, D. J. Jacob, E. Atlas, C. A. Cantrell, F. Eisele, F. Flocke, A. Fried, R. L. Mauldin, B. A. Ridley, B. Wert, R. Talbot, D. Blake, B. Heikes, J. Snow, J. G. Walega, A. J. Weinheimer and J. Dibb, J. Geophys. Res., [Atmos.], 2003, 108 Search PubMed.
- W. J. Bloss, J. D. Lee, D. E. Heard, R. A. Salmon, S. J. B. Bauguitte, H. K. Roscoe and A. E. Jones, Atmos. Chem. Phys., 2007, 7, 4171 CrossRef CAS.
- A. Saiz-Lopez, A. S. Mahajan, R. A. Salmon, S. J. B. Bauguitte, A. E. Jones, H. K. Roscoe and J. M. C. Plane, Science, 2007, 317, 348 CrossRef CAS.
- R. L. Mauldin, E. Kosciuch, B. Henry, F. L. Eisele, R. Shetter, B. Lefer, G. Chen, D. Davis, G. Huey and D. Tanner, Atmos. Environ., 2004, 38, 5423 CrossRef CAS.
- W. J. Bloss, M. Camredon, J. D. Lee, D. E. Heard, J. M. C. Plane, A. Saiz-Lopez, S. J. B. Bauguitte, R. A. Salmon and A. E. Jones, Atmos. Chem. Phys., 2010, 10, 10187 CrossRef CAS.
- J. Mao, D. J. Jacob, M. J. Evans, J. R. Olson, X. Ren, W. H. Brune, J. M. St. Clair, J. D. Crounse, K. M. Spencer, M. R. Beaver, P. O. Wennberg, M. J. Cubison, J. L. Jimenez, A. Fried, P. Weibring, J. G. Walega, S. R. Hall, A. J. Weinheimer, R. C. Cohen, G. Chen, J. H. Crawford, C. McNaughton, A. D. Clarke, L. Jaegle, J. A. Fisher, R. M. Yantosca, P. Le Sager and C. Carouge, Atmos. Chem. Phys., 2010, 10, 5823 CrossRef CAS.
- E. Scheuer, R. Talbot, J. Dibb, G. K. Seid, L. DeBell and B. Lefer, J. Geophys. Res., [Atmos.], 2003, 108, 8370 CrossRef.
- I. J. George, P. S. Matthews, B. Brooks, A. Goddard, L. K. Whalley and M. T. Baeza-Romero, Fall Meeting, AGU, San Francisco, California, 2011 Search PubMed.
- C. E. Kolb, D. R. Worsnop, M. S. Zahniser, P. Davidovits, L. F. Keyser, M.-T. Leu, M. J. Molina, D. R. Hanson and A. R. Ravishankara, in ‘Laboratory studies of atmospheric heterogeneous chemistry’, ed. J. Baker, 1995 Search PubMed.
- F. Taketani, Y. Kanaya and H. Akimoto, J. Phys. Chem. Lett., 2010, 1, 1701–1704 CrossRef CAS.
- J. R. Olson, J. H. Crawford, W. Brune, J. Mao, X. Ren, A. Fried, B. Anderson, E. Apel, M. Beaver, D. Blake, G. Chen, J. Crounse, J. Dibb, G. Diskin, S. R. Hall, L. G. Huey, D. Knapp, D. Richter, D. Riemer, J. St. Clair, K. Ullmann, J. Walega, P. Weibring, A. Weinheimer, P. Wennberg and A. Wisthaler, Atmos. Chem. Phys., 2012, 12, 9377 CrossRef.
- P. M. Edwards, M. J. Evans, R. Commane, T. Ingham, D. Stone, A. S. Mahajan, H. Oetjen, J. Dorsey, J. R. Hopkins, J. D. Lee, S. Moller, R. Leigh, J. M. C. Plane, L. J. Carpenter and D. E. Heard, J. Geophys. Res., [Atmos.], 2011, 116, D016390 Search PubMed.
- J. A. Thornton, J. P. Kercher, T. P. Riedel, N. L. Wagner, J. Cozic, J. S. Holloway, W. P. Dubé, G. M. Wolfe, P. K. Quinn, A. M. Middlebrook, B. Alexander and S. S. Brown, Nature, 2010, 464, 271 CrossRef CAS.
- J. Matthews, A. Sinha and J. S. Francisco, Proc. Natl. Acad. Sci. U. S. A., 2005, 102, 7449 CrossRef CAS.
- S. Li, J. Matthews and A. Sinha, Science, 2008, 319, 1657 CrossRef CAS.
- J. N. Crowley and S. A. Carl, J. Phys. Chem. A, 1997, 101, 4178 CrossRef CAS.
- S. Carr, D. E. Heard and M. A. Blitz, Science, 2009, 324, 336 CrossRef CAS.
- D. Cariolle, M. J. Evans, M. P. Chipperfield, N. Butkovskaya, A. Kukui and G. L. Bras, Atmos. Chem. Phys., 2008, 8, 4061 CrossRef CAS.
- N. I. Butkovskaya, A. Kukui, N. Pouvesle and G. L. Bras, J. Phys. Chem. A, 2005, 109, 6509 CrossRef CAS.
- N. Butkovskaya, A. Kukui and G. L. Bras, J. Phys. Chem. A, 2007, 111, 9047 CrossRef CAS.
- N. Butkovskaya, M.-T. Rayez, J.-C. Rayez, A. Kukui and G. L. Bras, J. Phys. Chem. A, 2009, 113, 11327 CrossRef CAS.
- C. Murray, E. L. Derro, T. D. Sechler and M. I. Lester, J. Phys. Chem. A, 2007, 111, 4727 CrossRef CAS.
- S. D. L. Picard, M. Tizniti, A. Canosa, I. R. Sims and I. W. M. Smith, Science, 2010, 328, 1258 CrossRef.
- N. Kanno, K. Tonokura and M. Koshi, J. Geophys. Res., [Atmos.], 2006, 111, D20312 CrossRef.
- M. Djehiche, A. Tomas, C. Fittshcen and P. Coddeville, Z. Physiol. Chem., 2011, 225, 983 CAS.
- N. Carslaw, N. Bell, A. C. Lewis, J. B. McQuaid, M. J. Pilling and P. J. Jacobs, Atmos. Environ., 2000, 34, 2827 CrossRef CAS.
- Z. Hosaynali Beygi, H. Fischer, H. D. Harder, M. Martinez, R. Sander, J. Williams, D. M. Brookes, P. S. Monks and J. Lelieveld, Atmos. Chem. Phys., 2011, 11, 8497 CrossRef.
- W. H. Brune, I. C. Faloona, D. Tan, A. J. Weinheimer, T. Campos, B. A. Ridley, S. A. Vay, J. E. Collins, G. W. Sachse, L. Jaegle and D. J. Jacob, Geophys. Res. Lett., 1998, 25, 1701 CrossRef CAS.
- L. Jaegle, D. J. Jacob, W. H. Brune, I. Faloona, D. Tan, B. G. Heikes, Y. Kondo, G. W. Sachse, B. Anderson, G. L. Gregory, H. B. Singh, R. Pueschel, G. Ferry, D. R. Blake and R. E. Shetter, J. Geophys. Res., [Atmos.], 2000, 105, 3877 CrossRef CAS.
- J. Crawford, J. Olson, D. Davis, G. Chen, J. Barrick, R. Shetter, B. Lefer, C. Jordan, B. Anderson, A. Clarke, G. Sachse, D. Blake, H. Singh, S. Sandolm, D. Tan, Y. Kondo, M. Avery, F. Flocke, F. Eisele, L. Mauldin, M. Zondlo, W. Brune, H. Harder, M. Martinez, R. Talbot, A. Bandy and D. Thornton, J. Geophys. Res., 2003, 108, 8818 CrossRef.
- G. H. Mount and F. L. Eisele, Science, 1992, 256, 1187 CAS.
- P. S. Stevens, J. H. Mather, W. H. Brune, F. Eisele, D. Tanner, A. Jefferson, C. Cantrell, R. Shetter, S. Sewall, A. Fried, B. Henry, E. Williams, K. Baumann, P. Goldan and W. Kuster, J. Geophys. Res., [Atmos.], 1997, 102, 6379 CrossRef CAS.
- A. T. Archibald, J. G. Levine, N. L. Abraham, M. C. Cooke, P. M. Edwards, D. E. Heard, M. E. Jenkin, A. Karunaharan, R. C. Pike, P. S. Monks, D. E. Shallcross, P. J. Telford, L. K. Whalley and J. A. Pyle, Geophys. Res. Lett., 2011, 38 Search PubMed.
- J. A. Thornton, P. J. Wooldridge, R. C. Cohen, M. Martinez, H. Harder, W. H. Brune, E. J. Williams, J. M. Roberts, F. C. Fehsenfeld, S. R. Hall, R. E. Shetter, B. P. Wert and A. Fried, J. Geophys. Res., [Atmos.], 2002, 107, 4146 CrossRef.
- Y. Kanaya, M. Fukuda, H. Akimoto, N. Takegawa, Y. Komazaki, Y. Yokouchi, M. Koike and Y. Kondo, J. Geophys. Res., 2008, 113 Search PubMed.
- F. Holland, U. Aschmutat, M. Hessling, A. Hofzumahaus and D. H. Ehhalt, J. Atmos. Chem., 1998, 31, 205 CrossRef CAS.
- E. J. Lanzendorf, T. F. Hanisco, N. M. Donahue and P. O. Wennberg, Geophys. Res. Lett., 1997, 24, 3037 CrossRef CAS.
- U. Brandenburger, T. Brauers, H. P. Dorn, M. Hausmann and D. H. Ehhalt, J. Atmos. Chem., 1998, 31, 181 CrossRef CAS.
- A. Volz-Thomas, H. W. Patz, N. Houben, S. Konrad, D. Mihelcic, T. Klupfel and D. Perner, J. Geophys. Res., [Atmos.], 2003, 108 Search PubMed.
- A. Volz-Thomas, H. Geiss, A. Hofzumahaus and K.-H. Becker, J. Geophys. Res., 2003, 108, 8252 CrossRef.
- W. Birmili, H. Berresheim, C. Plass-Dulmer, T. Elste, S. Gilge, A. Wiedensohler and U. Uhrner, Atmos. Chem. Phys., 2003, 2, 361 CrossRef.
- S. C. Smith, Atmospheric Measurements of OH and HO2 using the FAGE technique: Instrument development and data analysis, University of Leeds, 2007 Search PubMed.
- K. L. Furneaux, PhD thesis, University of Leeds, 2009.
- R. L. Mauldin, C. A. Cantrell, M. A. Zondlo, E. Kosciuch, B. A. Ridley, R. Weber and F. E. Eisele, J. Geophys. Res., [Atmos.], 2003, 108 Search PubMed.
- L. K. Whalley, I. J. George, D. Stone and D. E. Heard, Abstract A43D-0174, The impact of clouds on radical concentrations: Observations of OH and HO2 during HCCT-2010, Proceedings Fall Meeting AGU, 2011 Search PubMed.
Footnote |
| † Part of the atmospheric chemistry themed issue. |
| This journal is © The Royal Society of Chemistry 2012 |