Checking the quality of contracted-out analysis
Analytical Methods Committee, AMCTB No 54
First published on 27th September 2012
Abstract
Contracting-out is currently a popular method of getting analysis done. It is regarded as conferring two benefits: high quality, because you can select a firm that specialises in the type of analysis required; and low cost because the firm will be permanently set up for that kind of analysis and able to make savings of quantity. But how can you tell if the results you receive are of the quality required, that is, if the uncertainty associated with the results is as small as the level specified by the contractor?
The usual procedure is to examine the results obtained by the laboratory in their quality control activities: (i) control materials or even certified reference materials analysed in each run of analysis and the results shown to be in statistical control; or (ii) z-scores from successive rounds of a proficiency test. Such results, however important in themselves, can be misleading both to the customer and the contractor unless interpreted with full awareness of their shortcomings.
Results from internal quality control
Firstly we have to consider the composition of the control materials used. Are they closely similar to the customer's samples in bulk composition? They could be nominally the same, for example ‘soil’, but quite different mineralogically. If so, they may respond differently to the chemical decomposition used, for instance by affecting the recovery of the analyte. Another aspect of this requirement for matching is the concentration of the analyte. Precision varies markedly with concentration, so we need to be sure that the control materials are typical of the test samples.Control materials are usually (and CRMs always) prepared with the utmost care to ensure a sufficiently close approach to stability and heterogeneity. For solids this involves very fine grinding and thorough mixing. Such treatment reduces both the within-run and between-run variation in the results to a minimum. That is appropriate for QC activities, which ensure that the factors affecting uncertainty have not changed significantly since validation time. But the dispersion thus observed will not represent that likely in relation to the customer's samples. The fine grinding of the control materials ensures that the test portions will be very similar in composition and maximises the efficacy of any chemical decomposition. These conditions will seldom apply equally to the routine samples submitted.
A second factor will sometimes further reduce the dispersion of results on control materials, and that is their position in the sequence of test materials in a run of analysis. It is a common practice to analyse the control material as the first item in a run, that is, immediately after recalibration. This is seen as a sensible check on correct calibration, so that the run can be aborted with little loss of time if a problem is encountered. However, as small within-run drifts are ubiquitous in instrumental measurement, the deviation of these first-item results will be smaller than that of results from test materials situated randomly in the sequence, which would be more typical of the customer's samples. A cognate effect can be found in duplicated results, depending on whether they are adjacent or separated in the sequence.
Information from proficiency tests
Scores from proficiency tests are independently obtained. When the PT scheme calculates scores relative to a consistent, independent criterion of uncertainty acceptable for the application area, and the PT materials are of appropriate composition, the scores should be resistant to overly optimistic interpretation. However, this is not always the case. PT schemes have to cater for the needs of a variety of participants, so the material distributed may not be exactly matched to a participant's routine work. PT schemes tend to avoid distributing materials with concentrations near detection limits to avoid an undue proportion of ‘less than’ results, so the concentration may not be relevant to the customer's needs. Furthermore, PT materials are often spiked with pure analyte, but the recovery of the spike may be different from that of the native (incurred) analyte. The materials are also subjected to the usual fine grinding to ensure homogeneity. In addition to all of these concerns, the analyst will normally be aware of handling a PT material and unconsciously pay more attention to detail than usual.What can the customer do?
The first thing is to ensure that the contractor understands the customer's requirements. After consultation, they should draw up a clear specification of the type of test material and the sample size to be submitted. An essential item is the required upper limit to the uncertainty of the result. It must be specified whether or not this includes uncertainty from physical preparation by the contractor of the submitted material. If a wide range of concentrations is likely, the uncertainty should be specified as a function of the analyte concentration. The customer should obtain a written description of the laboratory's routine procedures and IQC, check that they are appropriate, and ask for access to relevant outcomes. The customer could also reasonably ask to see the laboratory's recent PT scores and records of action taken in response to any regarded as unsatisfactory.Covert checking
Having done all that was possible in advance, the customer should also resort to blind checking. This is by no means an unfair or ‘sneaky’ procedure. Responsible contractors would encourage customers to do it. It is probably better to inform the laboratory that such checking will occur. In any event, if a problem occurred, the laboratory would have to be informed about the checking. The covert method should not be based on control materials or CRMs—they are easily recognised as such by appearance and often by the necessarily small quantity submitted. In addition, there is no point employing methods that the laboratory itself should be doing as routine at no extra cost.The best method is for the customer, in each batch of samples, to submit blind duplicate portions of some or all of the test materials. Each duplicate pair should comprise properly made splits of the primary samples in the state that they are normally submitted. (Thus the outcome will include uncertainty resulting from any physical preparation preceding analysis.) The duplicates must not be recognisable as such.
This method will not address the true standard uncertainty (u) directly, but rather the repeatability standard deviation σr. To put that in perspective, we would usually expect σr ≈ u/2. If we found that σr was substantially greater than u*/2 (u* being the standard uncertainty specified in the contract) we would have grounds for suspecting that the uncertainty requirement was not being fulfilled. Such measures are not perfect, but still provide an essential check.
Statistical approach
The key variable is the signed difference d = x1 − x2 between the two results x1, x2 from corresponding splits. The standard deviation of d is derived from the repeatability standard deviation σr as (assuming that both duplicates are analysed in the same run). Given enough values of d and a narrow concentration range (implying an invariant σr), we could estimate σd directly (Fig. 1).
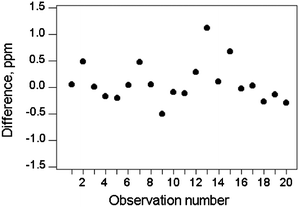 | ||
| Fig. 1 Differences between duplicated results, Cd in soils and sediments. σd = 0.38 so σr = 0.27. (‘ppm’ refers to mass fraction in this paper.) | ||
If there is a wide concentration range encountered, we would expect the median absolute difference median|d| ≈ σr in any one narrow concentration range. (The exact value is median|d| = 0.954σr for a normal distribution. Use of the median robustifies the estimate against outlying differences.) A plot of median|d| versus c = median(mean(x1, x2)) should therefore tend to the functional relationship σr = f(c) (Fig. 2), given a sufficient number of observations.
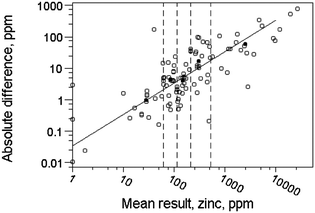 | ||
| Fig. 2 Absolute differences (concentration of zinc) from 100 different materials (open circles) binned by concentration range (dashed lines), showing the median results (solid circles) in each bin. The fitted relationship (solid line) shows a constant relative standard deviation of 0.028. (Note: logarithmic axes were used to illustrate this example to accommodate the wide concentration range.) | ||
In default of sufficient observations to allow a relationship to be estimated, a plot of absolute difference versus mean, showing various quantiles of the normal distribution, should act like a Shewhart chart (but not showing the temporal sequence of course). The median of the expected relationship should on average divide compliant observations equally (Fig. 3). (For a required relationship σr = f(c) the quantiles of the absolute differences will be as follows: the 50th percentile (i.e., the median) will be at 0.954f(c); the 95th percentile at 2.77f(c); the 99th at 3.64f(c).)
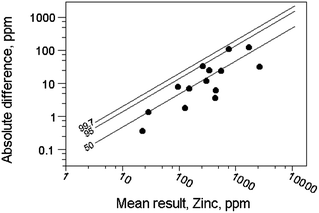 | ||
| Fig. 3 Absolute differences between duplicate results versus mean results for Zn in soils and sediments (solid circles). The diagonal lines are quantiles of a normal distribution, calculated for an independent requirement for a relative repeatability standard deviation of 0.05, i.e., σr = 0.05c. The results seem to fulfill requirements. | ||
Alternatively, in instances where a constant relative standard deviation is a reasonable assumption, individual values of d could be ‘normalised’ as d/c and the relative standard deviation calculated directly (Fig. 4).
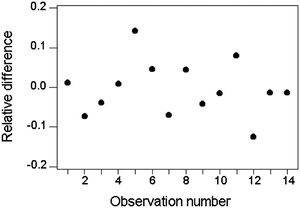 | ||
| Fig. 4 Relative differences between duplicate results for Zn in soils and sediments (same data as in Fig 3). The standard deviation of d/c is 0.068, implying a repeatability relative standard deviation of 0.048 (= 0.068/1.414). | ||
This Technical Brief was prepared for the Statistical Subcommittee and approved by the Analytical Methods Committee.
| This journal is © The Royal Society of Chemistry 2012 |


