Direct determination of nickel in xylene solutions of raw material for catalytic cracking with application of graphite furnace atomic absorption spectrometry
Zofia
Kowalewska
*
Research–Development Center for Refinery Industry S.A., Chemików 5, 09-411 Płock, Poland. E-mail: zofia.kowalewskah@gmail.com; zofia.kowalewska@obr.pl
First published on 24th October 2012
Abstract
Nickel is a severe poison to cracking catalysts, therefore its content in raw material for cracking (which is a mixture of heavier oils boiling in the range 330–550 °C) has to be controlled at levels below mg kg−1. A reliable, simple and fast method of Ni determination in this kind of material is proposed with a detection limit of 1.2 μg kg−1 in the initial sample at 1![[thin space (1/6-em)]](https://www.rsc.org/images/entities/char_2009.gif) :5 dilution m/v. The method relies just on sample dilution in xylene and Ni determination using graphite furnace atomic absorption spectrometry, with palladium acetylacetonate and air ashing as a double modifier. The method was successfully validated using mineralization as an alternative sample preparation procedure. The following commonly used methods failed as tools for verification of analysis accuracy: Ni in the investigated cracking feed behaved completely differently than in the available certified reference materials; recovery of standard added to samples was close to 100%, while results were up to 10 times too low; pyrolysis curves did not reveal a decrease of integrated absorbance appearing in the entire investigated temperature range. Decreased evaporation of Ni porphyrins due to interaction with graphite, and increased Ni binding in the solid phase in the presence of asphaltenic matrix, should be taken into account in interpretation of technologically important information on speciation of Ni (volatile and non-volatile Ni forms).
:5 dilution m/v. The method relies just on sample dilution in xylene and Ni determination using graphite furnace atomic absorption spectrometry, with palladium acetylacetonate and air ashing as a double modifier. The method was successfully validated using mineralization as an alternative sample preparation procedure. The following commonly used methods failed as tools for verification of analysis accuracy: Ni in the investigated cracking feed behaved completely differently than in the available certified reference materials; recovery of standard added to samples was close to 100%, while results were up to 10 times too low; pyrolysis curves did not reveal a decrease of integrated absorbance appearing in the entire investigated temperature range. Decreased evaporation of Ni porphyrins due to interaction with graphite, and increased Ni binding in the solid phase in the presence of asphaltenic matrix, should be taken into account in interpretation of technologically important information on speciation of Ni (volatile and non-volatile Ni forms).
1. Introduction
Nickel, apart from vanadium, is the most abundant metal in crude oil, present at concentrations from around 0.2 up to about 200 mg kg−1. During crude oil distillation Ni concentrates in heavy fractions and residues.1–23One of the major processes of petroleum upgrading is fluid catalytic cracking (FCC), which enables more than 70% conversion of some less valuable heavy oils into the most valuable products of crude oil refinery, gasoline and diesel oil.1,3,24–26 The main raw material for FCC is heavy oil from vacuum distillation, boiling in the range of 330–550 °C (gas oil).4,24 The feedstock can contain significant amounts of metals, which irreversibly accumulate on the catalysts and poison them. Of various metals considered, Ni is the most harmful in catalytic cracking operations.2,3,24–26 The deleterious effect of Ni lies in efficient catalysis and enhancement of side reactions, leading to coke and gaseous product formation at the cost of gasoline or diesel oil. A FCC feedstock is characterized by a “metals factor”, which is a sum of concentrations of metals multiplied by coefficients expressing their relative effect. In various equations, the Ni coefficient is up to 14 times higher than coefficients of other metals. This fact has implications for analytical methods, as the requirements for Ni determination in terms of detection limit are more severe than for other metals. In the case of a “metals factor” admissible value at a few mg kg−1 level, the analytical method should enable reliable Ni determination at the level of tens–hundreds μg kg−1. It is necessary to point out that typical cracking raw material is viscous and has to be dissolved prior to analysis with spectrometers designed for liquid samples.
For routine determination of Ni in crude oil and petroleum products, standard normalized procedures are usually used with application of spectrometric techniques, for example: wavelength dispersive X-ray fluorescence spectrometry,27 inductively coupled plasma optical emission spectrometry28,29 and atomic absorption spectrometry with flame atomization.29,30 Samples are analyzed after dilution in an organic solvent27–29 or in an aqueous solution after ashing.29 Detection limits of the whole analytical procedures are degraded due to dilution of the initial sample, and in the case of these less sensitive techniques are rather high (for example 5 mg kg−1,27,30 4 mg kg−1.28). To fulfill requirements for FCC raw material it can be necessary to mineralize tens or hundreds of grams of a sample.29
Determination of metals, including Ni, has been a topic of many works with application of inductively coupled plasma mass spectrometry,4–6,13 which is a sensitive and powerful technique of multi-elemental capabilities. After elimination of interferences it is possible to reach even ng kg−1 detection limit for Ni in an organic solution.13 The detection limit for the initial sample would be worsened due to necessary dilution of the sample, for example by two orders of magnitude.4,13
Another sensitive technique with instrumental detection limits at μg kg−1 or sub μg kg−1 levels is atomic absorption spectrometry with electrothermal atomization in graphite furnace (GFAAS). The important advantages of the technique include relative ease of use of organic solvents and tolerance to large amounts of dissolved (or even non-dissolved) matrix. Powerful tools, available in GFAAS to improve analysis, are programmable heating of the graphite tube and possibility of application of a wide variety of chemical modifiers. Important also is the automation of GFAAS analysis. The aim of this work was to apply GFAAS for sensitive, reliable, fast and automatic (autosampler utilization) Ni determination in cracking raw materials.
GFAAS has been used for Ni determination in petroleum and its products since the early 70s.7–12,14–23,31–36 A wide range of materials has been analysed (from gasoline up to residual oil, asphaltenes and lubricating oil), having various contents of Ni (<0.001–850 mg kg−1). Only a few studies were devoted to the analysis of oils of the cracking raw material type.16,19,20,31 The Ni determination was carried out in an aqueous solution after mineralization31–33 or extraction,18 as well as in some intermediate systems as emulsions7,8,10,12,17,34 or microemulsions.14 However, the simplest method of petroleum products analysis was direct analysis, using solid sampling accessories,9,11,23 or after dissolution in an organic solvent.15,16,19–21,35,36 The dissolution of crude oil in xylene (an efficient solvent for most petroleum products, also those containing asphaltenes) prior to GFAAS analysis was applied already in the work of Omang.35 Since that time new facts have been discovered regarding the possible difficulties of GFAAS analysis of crude oil or its products.
First of all, the possibility of losses of volatile Ni forms before the atomization phase turned out to be obvious.7–12,16,19,20,37 Ni porphyrins, the best known group of Ni compounds naturally occurring in crude oil, can be volatilized at about 300 °C. On the other hand, the pyrolysis temperature should be sufficiently high to remove the petroleum matrix. To increase the thermal stability of the analyte before atomization, chemical modifiers were applied. The most commonly used modifier was Pd in the form of nitrate,8–10,36 usually manually injected and thermally pre-reduced before a sample injection. In analyses with application of HNO3 for emulsion or microemulsion formation, the acid itself could have worked as a modifier by decomposition of volatile organic Ni compounds.12,34 It prevented losses by volatility and carbide formation.12 It was also used for in situ oil digestion.23 In the experiments with a special graphite furnace type, filter furnace, the interaction with graphite filter material could decrease the volatilization of Ni.15 Permanent modifiers have rarely been applied for Ni determination, as the atomization temperature of Ni is relatively close to atomization temperature of potential modifiers.9,14,17
One of the reasons for thermal stabilization of the analyte, and the application of pyrolysis temperatures of at least 500 °C, is high background (mainly light scattering) caused by un-decomposed matrix at lower temperatures. A high-resolution continuum source atomic absorption spectrometer enabled effective correction of the background coming from crude oil using a pyrolysis temperature of 300 °C.7 Apart from losses of volatile Ni compounds, the opposite effect can occur, as the fuel oil matrix can form a carbonaceous buildup, blocking Ni and preventing its atomization through formation of stable Ni carbides.21 Substitution of argon with air enables oxidation and removal of the heavy oil matrix.21 In the case of nitrogen containing compounds, refractory carbonitrides can be formed in the graphite furnace.22
One of the main difficulties of either direct analysis or analysis in an organic solution by various techniques is the possible analyte speciation effect, that is, the dependence of the measurement result on the chemical form of the analyte due to differing behaviours of various analyte forms during analysis.38,39 The effect was mainly attributed to the step of sample introduction into a flame or a plasma, and GFAAS seemed to be free from the problem.7–9 However, when xylene solutions of a few particular Ni compounds, including porphyrins, were investigated using GFAAS, the differences in analytical results without chemical modification were up to 400%.37 Fortunately, some rules that govern the behavior of various Ni forms were found. Air ashing and organic Pd modifier injected into the graphite furnace with the sample solution turned out to be necessary for effective decomposition and thermal stabilization of Ni, contained in Ni porphyrins. For organic compounds containing oxygen-bound Ni atoms, the pretreatment with iodine, followed by pretreatment with methyltrioctylammonium chloride (MTOACl), was crucial to prevent volatile Ni carbonyl formation. Application of triple chemical modification (Pd, air ashing, I2 + MTOACl) was the most universal.
The previous work37 was thought to be a first step leading to development of analytical procedures for Ni determination in “real” samples of petroleum products. The determination of Ni in xylene solutions of catalytic cracking raw material using GFAAS was the task of the present work.
2. Experimental
2.1. Instrumentation and its operation
A Solaar M atomic absorption spectrometer (Thermo Electron, Walham, USA) with longitudinally heated graphite furnace and dual background correction (Zeeman system or deuterium background correction of Quadline type) was used in this work. A Ni hollow cathode lamp was applied at 232.0 nm using a 0.1 nm bandpass. Graphite tubes used as an atomizer were 28 mm long with an outer diameter of 5.5 mm. Three types of tubes were used: the uncoated tubes and the pyrolytically coated extended-life tubes (a thick pyrolytic layer of 120 μm) have two ridges inside (to prevent spreading of the solution) and do not have any platform. The tubes of the third type contained a pyrolytically coated and shaped platform of the Omega type. All the graphite tubes were heated according to the program given in Table 1.| Step | Temperature (°C) | Ramp (°C s−1) | Hold time (s) | Internal gas | Internal gas flow rate (mL min−1) |
|---|---|---|---|---|---|
| a Omitted when air ashing was not applied. b Read step. c More than 2000 °C s−1. | |||||
| Injection | 70 | ||||
| 1 | 130 | 30 | 20 | Argon | 200 |
| 2 | 270 | 20 | 20 | Argon | 200 |
| 3a | 550 | 50 | 15 | Air | 200 |
| 4a | 550 | 50 | 25 | Argon | 200 |
| 5 | 900 | 50 | 30 | Argon | 200 |
| 6b | 2800 | Maximumc | 3 | Argon | 0 |
| 7 | 2800 | Maximum | 3 | Argon | 300 |
To improve injection, the tubes were preheated up to 70 °C. In some cases air was applied as the internal gas instead of argon in step “3” (air ashing). For the analysis modes without air ashing, steps “3” and “4” were omitted. All experiments were carried out using the FS90 autosampler and polypropylene sample cups. The volume of sample solution was 8 μL. Unless indicated otherwise, the volume of Pd modifier solution was also 8 μL. The modifier was used in “wet” or in “dry first” mode, as in the previous work.37 In the “wet” case (further abbreviation “Pdw”), the modifier (as the first) and the sample (as the second) solutions were taken into the autosampler capillary and injected into the graphite furnace together. After that the whole heating program was executed (the steps “1–2, 5–7” without air ashing and “1–7” with air ashing). In the “dry first” case (further abbreviation “Pddf”) injection of the sample solution was preceded by injection and thermal pretreatment (steps “1–2, 5” without air ashing or steps “1–5” with air ashing) of the modifier solution. Afterwards the whole heating program (as in “wet” mode) was performed.
For mineralization, platinum dishes or crucibles, and a muffle furnace (Carbolite CWF 1200, Sheffield, USA) were used.
2.2. Reagents, standards and solutions
The organic solvent was xylene p.a. (Research–Development Center for Refinery Industry S.A., Poland). S21 multielement oil Conostan standard containing 500 mg kg−1 of Ni in the form of alkylarylsulfonate was from Conoco Speciality Products (USA). Nickel(II) 2,3,7,8,12,13,17,18-octaethyl-21H,23H-porphine (abbreviation NiPh), nickel(II) 5,10,15,20-tetraphenyl-21H,23H-porphine (NiPt) and palladium(II) acetylacetonate (PdA) were from Aldrich (Germany). The compounds were used as xylene solutions. To improve dissolution, 2-ethylhexanoic acid from Sigma Chemicals Co., USA (for NiPh, NiPt and PdA) and pyridine from Sigma Aldrich, Germany (for NiPh and NiPt) were added and the dissolution was carried out under gentle heating on a heating plate at 60 °C. The obtained oversaturated solution of PdA, prepared to contain 0.2% of Pd, was used throughout. The Pd solution was prepared on a daily basis. The obtained NiPh and NiPt solutions were filtered and the filtrates were used throughout the experiments. The stock solutions of S21, NiPh and NiPt were prepared to contain 100 mg kg−1 of Ni. The working solutions were prepared daily by dilution of the stock solutions. Iodine and methyltrioctylammonium chloride (MTOACl) were from POCh (Poland) and were used as 1% m/v solutions in xylene.The inorganic chemicals were: Ni nitrate containing 1000 mg L−1 (GUM, Poland), sulfuric acid p.a. (d = 1.84 kg L−1) and n-butanol p.a. (POCh, Gliwice, Poland), hydrochloric acid, Aristar, d = 1.19 g mL−1 (BDH, Great Britain), magnesium nitrate as Mg(NO3)2 in 17% HNO3 aqueous solution (Merck, Germany). Deionized water of conductivity lower than 0.1 mS cm−1 was from KB 5522A system (Cobrabid-Aqua, Poland).
2.3. Samples
Certified reference materials (CRMs), 1634b, 1634c and 1618 residual fuel oils and containing wear-metals 1085b lubricating oil were from the National Institute of Standards and Technology (Gaithersburg, USA). The CRM HU-1 used oil, fortified with metals, was from SCP-Science (Clark Graham, Canada). The “real” samples of stock material for catalytic cracking were heavy oils from the vacuum distillation of crude oil, boiling in the temperature range 330–550 °C. The target samples contained ∼0.4 to 4 mg kg−1 of V and had micro-carbon residues (a property correlated with increased coke formation, determined according to EN 10370) at the level from 0.3 up to around 2. There were two distinctly defined types of cracking feed: type “1” (samples A1 and B1) and type “2” (samples C2 and D2). Type “1” comprises oils with lower metal content (Ni concentration up to 0.5 mg kg−1 and V concentration up to 1.5 mg kg−1) and lower value of micro-carbon residues (0.3–0.5% m/m) while type “2” is modified cracking stock material and comprises oils with greater metal content (Ni concentration up to around 1 mg kg−1 and V concentration up to 4 mg kg−1) and greater value of micro-carbon residue (1.3–1.4% m/m). Other cracking feed samples (E-K) were of a non-identified type.2.4. Sample preparation
Cracking raw material and residual oils (NIST) were preliminary warmed up in a dryer at 40 and 60 °C, respectively. These samples as well as S21 Conostan standard and lubricating oils were thoroughly mixed and weighed. Their solutions were prepared as follows:• Analysis in an organic solution: 0.5–2 g of a sample was diluted in 10–50 mL of xylene; cracking feed of type “1” was diluted in the ratio 1:5 (m/v), while the ratio for cracking feed of type “2” was 1:20 and for CRMs was 1:50 (m/v); the CRMs solutions were further diluted prior to analysis according to Ni concentration;
• Mineralization in open Pt vessels: 5–10 g of a cracking raw material was mineralized using 2 mL of a mixture of sulfuric acid with n-butanol (1:4; v/v) and then with 2 mL of sulfuric acid, according to a procedure precisely described elsewhere;40 mineralization was continued in a muffle furnace at the temperature of 500 °C; the ash was dissolved in 1 mL of HCl and then diluted with water to 10 mL; the solutions were further diluted prior to analysis according to Ni concentration;
• Chemical modification with I2 + MTOACl: 940 μL of xylene solution of a sample was shaken with 10 μL of iodine solution; after at least 5 minutes 50 μL of MTOACl solution was added and the obtained solution was shaken again and poured into an autosampler cup.
3. Results and discussion
3.1. Preliminary discussion on investigated materials
There is a very limited number of petroleum products with certified Ni content and there are not any CRMs of the cracking feed type. Therefore, lubricating oils and residual oils were applied as CRMs in this work. Apart from some rare doubts,7 the CRMs have been widely and successfully applied by other authors for validation purposes for the analysis of various petroleum product samples using various sample preparation methods and detection techniques. The CRMs contain much greater Ni content (17.5 up to 297.8 mg kg−1) than the target samples of cracking feed (below or about 1 mg kg−1). The target samples seemed to be somehow intermediate, between lubricating oils and residual oils, in terms of heavy petroleum matrix presence. The next difference between the CRMs and cracking feed may be in the chemical forms of Ni. It can be important to take into account that 1085b oil contains “wear” metals and HU-1 was fortified with metals. Other samples are expected to contain Ni forms naturally occurring in crude oil. It was discovered that <1 up to 24% (ref. 7–9 and 12) of Ni in 1634c oil is in a volatile (probably porphyrin) form. Nothing more was known of the forms of Ni in the investigated samples. It is also worth adding that 1085b and HU-1 oil contain some other “wear” metals at the hundreds of mg kg−1 level.3.2. Experiments without chemical modifiers
For evaluation of the thermal behaviour of Ni compounds and the matrix of investigated samples during the graphite furnace heating cycle, pyrolysis and atomization curves were obtained. In the first experiments, chemical modification was not applied and pyrolytically coated graphite tubes without platform as well as deuterium background correction were used. The graphite furnace was heated according to the program in Table 1. Some of the curves obtained for CRMs and selected cracking raw material samples are presented in Fig. 1–3. Fig. 2 and 3 show, additionally, data obtained with application of chemical modifiers, which will be interpreted in the following sections. | ||
| Fig. 1 Pyrolysis and atomization curves for various samples, obtained without chemical modifiers. | ||
 | ||
Fig. 2 Pyrolysis curves for 1634c and 1085b oils using various chemical modifiers: analysis without modifier (*), with Pdw (○), with Pddf (△), using air ashing (![[thick line, graph caption]](https://www.rsc.org/images/entities/char_e117.gif) ), with Pdw + air ashing (●) and with Pddf + air ashing (▲). ), with Pdw + air ashing (●) and with Pddf + air ashing (▲). | ||
 | ||
| Fig. 3 Pyrolysis and atomization curves for cracking raw material C2 using various chemical modifiers: analysis without modifier (*), with Pdw (○), with Pddf (△), using air ashing (), with Pdw + air ashing (●), with Pddf + air ashing (▲) and using Pdw + air ashing followed by I2 + MTOACl pretreatment (◆). | ||
As can be seen (Fig. 1 and 3), the atomization curves measured without chemical modifiers for various samples have similar shapes, with plateaus beginning from about 2600 °C, but pyrolysis curves for various samples differ significantly from each other. The maximum admissible pyrolysis temperature is usually about 1300 °C. For all the CRMs as well as A1 and B1 samples, a plateau or some increase of integrated absorbance with the increase of pyrolysis temperature is observed between 300 and 1300 °C. The increase can be a result of more efficient decomposition of Ni compounds. The integrated absorbance for C2 and D2 samples was much smaller than expected, and measurements were imprecise in the whole range of pyrolysis and atomization temperatures. In other cases, relative standard deviation was usually at the satisfactory level of a few percent.
For all the cracking feed samples investigated in the current work, the background signal for 300 °C pyrolysis temperature was too high to be properly corrected by the deuterium background correction system. The Zeeman system was much more efficient, but using a pyrolysis temperature of 300 °C, a part of Ni (small peak, prior to the proper peak) could have been evaporated with the matrix, before atomization of the majority of Ni. For higher pyrolysis temperatures (500 °C or more) the background can be easily corrected for all samples also with the deuterium background correction, which would be preferred to the Zeeman system due to a better linearity of the calibration curve.
An interesting pyrolysis curve can be observed for C2 sample (Fig. 3, the curve for measurements without modifiers), where after a sharp decrease of Ni signal with the increase of pyrolysis temperature in the range 300–700 °C, some Ni stabilization (or lower decrease) in the range of 700–1300 °C is observed. A pyrolysis curve with two plateaus, at 300–400 and at 800–1400 °C, was reported by other authors.7 It could have been interpreted (according to ref. 7), as a result of the presence of two types of Ni compounds in the sample, volatile porphyrins and non volatile non-porphyrins. The porphyrins would have evaporated below 700 °C from the graphite furnace, while the non-porphyrins would remain up to about 1300 °C. Unexpectedly, in our previous investigations,37 the plateau between 700 and 1300 (1400) °C was observed on the pyrolysis curve also when single Ni porphyrins were analysed. Thus, the porphyrins were not lost or were only partially lost at temperatures above 700 °C. This phenomenon was also observed using transverse-heating of graphite furnace, atomization from platform as well as with application of high-resolution continuum-source spectrometer, therefore, gas-phase interferences or any unknown spectral events could have been excluded as the cause. It was assumed37 that volatile porphyrins interact with graphite, and can remain in the graphite furnace even though the actual temperature is higher than their boiling points. In this work, a chance for verification of this hypothesis appeared, as graphite tubes without pyrolytic coating were available. Therefore, NiPh and NiPt were added to the group of CRMs and cracking feed samples for some experiments.
It was found that integrated absorption of Ni using uncoated graphite was 49–74% lower than by using pyrolytically coated graphite for most of the samples. The pyrolytic coating prevents formation of refractory carbides of Ni and other metals and improves efficiency of atomization. However, using uncoated graphite the integrated absorbance was much higher for NiPh and NiPt (by 140% and 390%, respectively). Examples of the different influence of the graphite surface on pyrolysis curves of 1085b oil and NiPh are shown in Fig. 4.
 | ||
Fig. 4 Comparison of pyrolysis curves in experiments with uncoated (□,![[dash dash, graph caption]](https://www.rsc.org/images/entities/char_e091.gif) ) and pyrolytically coated graphite (■,) for 1085b and NiPh. ) and pyrolytically coated graphite (■,) for 1085b and NiPh. | ||
The experiments with uncoated graphite confirm the earlier presumptions related to porphyrin stabilization on the graphite in the pyrolysis temperature range of 700–1300 °C.37 Perhaps adsorption takes place or intercalation compounds are formed. The interactions should be taken into account in the fractionation studies,7,8,10,12 otherwise the evaluation of volatile compounds (porphyrins) content could be underestimated and the evaluation of non-volatile compounds could be overestimated.
In comparative experiments with atomization from wall and from platform (both pyrolytically coated graphite) it was found that more homogenous temperatures in the furnace, achieved owing to platform application, has no significant influence on integrated absorbance of Ni in 1634b, 1634c, 1085b, HU, S21, NiPh, NiPt, B1, C2 and D2 samples.
3.3. Chemical modifier selection
In GFAAS, a typical way to decrease the volatility of the analyte or to unify behavior of various analyte forms is by application of chemical modifiers. A popular modifier, Pd nitrate,8,14,20,36,37 is not soluble in xylene and other solvents dissolving petroleum products. Therefore, Pd acetylacetonate, as in earlier studies,20,37,41 was selected for analysis in the present work. The Pd modifier was investigated in two modes: as pre-injected and pre-reduced Pd (mode Pddf) and as injected together with the sample (mode Pdw). The second modifier selected previously was air, introduced to the gas phase.33,41 This gas-phase modifier is cheap, not-Ni contaminated, does not require any pretreatment and can play many roles such as: matrix decomposition, analyte compound decomposition, and changes of atomization mechanism (for example through NiO formation).The results of the application of Pd and air ashing as single modifiers or together as a mixed modifier are presented in Fig. 2 and 3 (influence of modifiers on pyrolysis and/or atomization curves), Fig. 5 (examples of influence of modifiers on Ni peak shape, size and position) and Table 2 (effects of modifiers on integrated absorbance for all the investigated samples and some previously investigated Ni compounds).
 | ||
| Fig. 5 Influence of modifiers on signal of Ni present in: 1085 oil and D2 sample. Pyrolysis temperature 900 °C. Pyrolytically coated graphite furnace. | ||
| Application of | Ratio of integrated absorbance using modifier relative to integrated absorbance without modifier | |||||||||||||||||
|---|---|---|---|---|---|---|---|---|---|---|---|---|---|---|---|---|---|---|
| Pdw | Air ashing | 1634b | 1634c | A1 | B1 | C2 | D2 | E | F | G | H | I | J | K | 1085b | S-2137 | NiPh37 | NiPt37 |
| + | − | 1.3 | 1.3 | 1.5 | 1.5 | 5 | 4 | 7 | 7 | 8 | 5 | 3 | 5 | 6 | 1.0 | 1.0 | 1.6 | 2.4 |
| − | + | 1.3 | 1.3 | 1.6 | 1.5 | 6 | 4 | 12 | 12 | 10 | 7 | 6 | 11 | 10 | 1.0 | 1.0 | 1.4 | 1.9 |
| + | + | 1.4 | 1.4 | 1.9 | 1.9 | 10 | 8 | 21 | 20 | 17 | 11 | 9 | 17 | 19 | 1.0 | 1.0 | 2.2 | 4.0 |
It was discovered that:
• Application of Pd modifier always changes Ni peak shape, making it sharper (faster atomization); it was observed for all the modes of Pd usage and all the samples investigated;
• Air ashing does not change Ni peak shape in comparison to a measurement without modifiers;
• Pd and air ashing applied independently or applied together do not have any influence on the pyrolysis curves and integrated absorbance of Ni in 1085b oil;
• Both modifiers increase integrated absorbance of Ni in the case of 1634b and 1634c residual oils, as well as in the case of cracking raw material samples; the influence for cracking raw material is higher than for the CRMs; the effect for cracking feed of type “2” is higher than for cracking feed of type “1”; the greatest effect (up to about 21 times) is observed for E-K samples;
• The greatest improvement of integrated absorbance takes place in the Pdw + air ashing mode; the course of pyrolysis curves obtained in other analysis variants may not reveal losses of Ni and the integrated absorbance decrease if the losses occur in the entire range of investigated pyrolysis temperatures (for example Pdw variant relative to Pdw + air ashing variant in Fig. 3).
The influence of volume of Pd modifier solution (equivalent to the effect of amount of Pd, as in all the experiments the same oversaturated Pd solution was used) on the integrated absorbance of some samples is presented in Fig. 6.
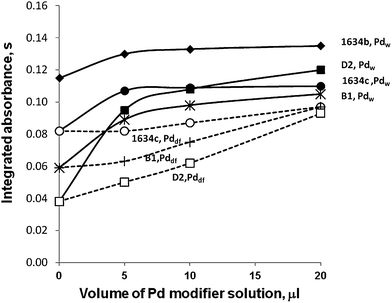 | ||
| Fig. 6 Influence of volume of the Pd modifier solution (prepared to contain 0.2% Pd) on the integrated absorbance of various samples. | ||
It can be seen that with the increase of volume of Pd modifier solution, the integrated absorbance increases or achieves a maximum for a given mode and a given sample. It is always more beneficial to inject a sample solution and a modifier solution together (Pdw) than to use the pre-reduced Pd (Pddf) mode. Probably this is caused by better contact between analyte and modifier. Fig. 6 generally shows a shortage of Pd, the biggest for D2 sample, which forces application of an additional modifier (air ashing).
The decreasing signal of Ni in the Pddf variant with the increase of pyrolysis temperature in the 300–700 °C range shows losses by evaporation of unaffected Ni forms (Fig. 3). It must be mentioned that in a previous work,20 where only PdA was used as a modifier, the omitting pyrolysis phase resulted in a significant increase of the Ni signal. It seems that, in the case of cracking raw material samples, two effects take place. Losses of volatile Ni compounds (for example porphyrins) are obvious, which can be diminished due to some (beneficial) interactions with graphite (greater for uncoated graphite). The fact that the effect of modifiers for real samples (increase of up to 21-times, Table 2) can be greater than for porphyrins (increase of up to 4 times, Table 2 (ref. 37)), indicates the existence of another effect, responsible for the decreased signal of Ni in cracking feed samples. Probably, the Ni atoms are confined in the asphaltenic matrix of the samples, therefore the contact with Pd is impeded. Air ashing played two roles here: it helped to decompose analyte compounds and helped to release analyte atoms by decomposition and removal of the matrix.
Finally, the double modifier was selected for analysis, Pdw + air ashing mode. Pd modifier volume established for further investigation was 10 μL, which should correspond to 20 μg of Pd. A similar amount of Pd was established in other work devoted to Ni determination.8 Some kind of Pd shortage was also observed in the work devoted to analysis of crude oil using a solid sampling mode.9 It was important to use 40 μL of 0.5 g L−1 Pd modifier instead of 20 μL of 1.0 g L−1, on the other hand, a part of the sample was not in the contact with the modifier, resulting in losses of volatile Ni compounds.9
In the previous study,37 the pretreatment of investigated solutions with iodine, followed by pretreatment with MTOACl, turned out to be indispensable for Ni compounds containing a Ni atom bonded with an O atom. The effect of I2 + MTOACl pretreatment on the results of measurements of various petroleum products was investigated in this work. It was found that it causes a significant decrease of integrated absorbance in all measurements with Pdw application for cracking feed samples (it decreases the beneficial effect of Pd), which can be, for instance, observed in Fig. 3. The effect is higher for cracking raw material of type “2”, where the shortage of Pd is higher, than for type “1”. The decrease does not appear for CRM samples. In further experiments the I2 + MTOACl pretreatment was not applied.
It is interesting that very similar behavior to the behavior of Ni and similar effects of modifiers were stated in a work devoted to the determination of V,41 where vacuum distillates as catalytic cracking feed were the investigated materials, among other samples.
3.4. Validation of the method and analytical application
The following conditions have been chosen for analysis of cracking raw material: pyrolytically coated graphite tubes without platforms, 900 °C pyrolysis temperature and 2800 °C atomization temperature, deuterium background correction system, Pd modifier injected with the sample (Pdw), air ashing and S21 Conostan oil as a standard.For accuracy verification, recovery of S21 standard, added to the investigated solution, was evaluated. Apart from the chosen analysis mode, analyses without modifiers, only with Pdw and only with air ashing were also performed (Table 3). The second method of accuracy verification was a comparison of analysis results with certified values or results of analysis by an alternative method (Table 4).
| Sample | Chemical modification | Ratio of the result obtained for sample relative to the original Ni content (%) | Evaluation of recovery of S21 Conostan oil standard | Recovery (%) | ||
|---|---|---|---|---|---|---|
| Ni concentration (μg kg−1) | ||||||
| Determined in original sample solution | Determined in sample + spikea solution | Calculated for sample + spike solution | ||||
| a 50 μg kg−1 of Ni as S21 Conostan standard was added to samples. | ||||||
| B1 | Without modifier | 60 | 24.1 | 71.9 | 74.1 | 97 |
| Pdw | 85 | 34.3 | 79.3 | 84.3 | 94 | |
| Air ashing | 74 | 29.8 | 75.3 | 79.8 | 94 | |
| Pdw + air ashing | 103 | 40.2 | 91.8 | 90.2 | 102 | |
| C2 | Without modifier | 8 | 2.9 | 54.5 | 52.9 | 103 |
| Pdw | 50 | 17.5 | 67.7 | 67.5 | 100 | |
| Air ashing | 59 | 20.9 | 67.8 | 70.9 | 96 | |
| Pdw + air ashing | 96 | 35.2 | 86.9 | 85.2 | 102 | |
| D2 | Without modifier | 11 | 6.4 | 56.3 | 56.4 | 100 |
| Pdw | 49 | 27.7 | 76.6 | 77.7 | 99 | |
| Air ashing | 51 | 29.3 | 76.0 | 79.3 | 96 | |
| Pdw + air ashing | 95 | 54.1 | 102.1 | 104.1 | 98 | |
| Sample | Reference Ni content (mg kg−1) | Result of Ni determination ± standard deviation (n = 3, mg kg−1) |
|---|---|---|
| a Certificate for CRM with uncertainty. b Mean result with standard deviation for 3 parallel analysis by an alternative method (mineralization and GFAAS determination. | ||
| 1634b | 28 ± 2a | 26.8 ± 0.6 |
| 1634c | 17.54 ± 0.21a | 18.2 ± 0.6 |
| 1618 | 75.2 ± 0.4a | 78 ± 2 |
| 1085b | 297.8 ± 4.6a | 291 ± 6 |
| HU1 | 45 ± 3a | 41 ± 2 |
| A1 | 0.142 ± 0.015b | 0.140 ± 0.010 |
| B1 | 0.390 ± 0.018b | 0.402 ± 0.015 |
| C2 | 0.64 ± 0.03b | 0.62 ± 0.02 |
| D2 | 0.98 ± 0.06b | 0.93 ± 0.02 |
| E | 0.69 ± 0.04b | 0.73 ± 0.01 |
| F | 0.80 ± 0.05b | 0.77 ± 0.01 |
| G | 1.02 ± 0.10b | 0.93 ± 0.03 |
| H | 1.00 ± 0.06b | 0.98 ± 0.02 |
The alternative method relied on sample mineralization and GFAAS analysis with magnesium nitrate as a chemical modifier. For cracking feed samples, the agreement of Ni determination results by both methods was statistically evaluated using paired comparison. The calculated “t” value was 1.427 while the critical “t” value at the 95% confidence level was 2.365. Also, the calculated values of “t” in the Student’s t test for Ni determination in CRMs were lower than the critical “t” value at the 95% confidence level. Thus, all the accuracy verification tests quoted in Tables 3 and 4 gave satisfactory results and proved that the selected modifier and the developed method of analysis are appropriate. However, the results of analysis with single modifiers or without modifiers were significantly decreased, as can be seen in Table 3. This shows that good recovery of standard added to a solution of a sample does not guarantee good accuracy. The added Ni form behaves differently than the “native” Ni, although both are present in the same homogenous solution. Standard addition calibration would not improve accuracy when single modifiers are applied.
The characteristic mass of Ni determined for S21 Conostan standard was 6.6 pg.37 The detection limit of the proposed analytical procedure was determined as three standard deviations of analysis results of ten xylene solutions, previously stored in 10 mL flasks for one day. The detection limit was equal to 0.24 μg L−1 for the measured solution, which corresponds to 1.2 μg kg−1 in the initial sample for the dilution ratio 1:5 m/v and 4.8 μg kg−1 in the initial sample for the dilution ratio 1:20 m/v. The concentration of Ni in the investigated cracking raw material turned out to be relatively high (∼0.14 to ∼1 mg kg−1). The proposed GFAAS method has potential for making detection limits lower, as a greater volume of sample (greater than 8 μL) and multiple injections can be applied.
One of the difficulties of working with petroleum products can be the instability of samples and solutions. Xylene solutions of cracking feed samples were stored for at least 5 months, and during that time Ni was determined once a month. As shown in Fig. 7, no systematic changes were observed. The stability of sample solutions is an important advantage of the proposed method.
 | ||
| Fig. 7 Results of Ni determination in xylene solutions of various petroleum products stored for a few months. Stock material for cracking: () and (△). Fuel oil: (■) and (●). | ||
In another experiment (unpublished results) it was noticed that repeated preheating of cracking raw material during sample preparation can lead to changes of Ni concentration due to evaporation of some components of samples. It should be taken into account in preparation of desirable CRMs.
A parallel analysis with the selected Pdw + air ashing modifier and without modifiers could be used as fractionation by differential volatilization with GFAAS detection.7,8 According to this interpretation, about 40% of Ni in B1 cracking raw material and about 90% of Ni in the case of cracking raw material of type “2” (C2 and D2 samples) is in a volatile form. The amount of volatile Ni forms in cracking raw material of type “2” is higher than has been reported to date in the literature (20–50%7,42). However, the results can be influenced by two additional effects, an interaction with graphite as in the case of NiPh (which would lead to an apparent decrease in results of volatile Ni compounds) and the effect of asphaltenic matrix (which would lead to an apparent increase in of results of volatile Ni compounds). In spite of all the doubts, this kind of fractionation analysis can provide technologically important information on speciation of Ni in a simple and fast way. The fractionation by differential volatilization would need standardization. The addition of a third step of evaluation (Pdw) could be also considered to show the effect of only air ashing, as it seems to indicate influence of asphaltenic matrix. For example, the difference of results for Pdw + air ashing and for only Pdw is about 15% in the case of B1 sample and about 50% in the case of C2 and D2 samples (Table 3). This corresponds well to other properties of cracking feed samples of both kinds, such as micro-carbon residues (Section 2.3).
4. Conclusions
The reliable determination of Ni in xylene solutions of cracking raw material can be carried out using GFAAS with application of palladium acetylacetonate and air ashing as a double chemical modifier.The reliable method for verification of analysis accuracy turned out to be comparison with the results obtained by another analytical procedure. The following commonly used methods failed as tools for verification of analysis accuracy:
• Analysis of certified reference materials: lubricating oils and residual fuel oils, which are the only available CRMs, are not appropriate CRMs for cracking raw materials analysis as their analysis does not reveal existing difficulties;
• Recovery studies: recovery of S21 Conostan standard added to sample solution was about 100%, while the obtained results of Ni determination were up to around 10 times too low;
• Analysis using low pyrolysis temperature: no pyrolysis temperature turned out to be “safe”, losses of volatile Ni forms took place over the entire investigated pyrolysis temperature range; the decrease of Ni integrated absorbance would have also been caused by binding of Ni in the solid phase.
Direct GFAAS analysis of a solution of petroleum products can lead to enormous analytical error, of order/orders of magnitude. Spectral interferences and gas-phase interferences were excluded as the cause of decreased signals of Ni in cracking feed. The volatility of some Ni compounds (losses by evaporation without decomposition before atomization phase) and the blocking effect of the asphaltenic matrix (which impeded Ni compound decomposition) turned out to be the main difficulties. GFAAS offers the possibility of fast and simple fractionation of Ni compounds by differential volatilization,7,8,10,12 however, it is necessary to take into account the mentioned effects. For example, the results of determination of the volatile Ni forms can be underestimated, and that of non-volatile forms overestimated due to interactions of the volatile Ni forms with graphite, which results in their presence in the graphite furnace at temperatures higher than their boiling points.
Acknowledgements
The author is very grateful to Teresa Terebus for technical assistance. The work was partially supported by the Polish Ministry of Science in the frame of statutory funds for the Research–Development Center for Refinery Industry S.A.References
- J. G. Reynolds, Pet. Sci. Technol., 2001, 19(7–8), 979–1007 CrossRef CAS.
- J. W. McCoy, The Inorganic Analysis of Petroleum, Chemical Publishing Company, Inc, New York, 1962 Search PubMed.
- J. Surygała and T. Stokłosa, Catalytic Cracking, in: Crude Oil. Properties, Processing, Products. Vademecum of Refiner, ed. J. Surygała, Wydawnictwa Naukowo-Techniczne, Warszawa, 2006, in Polish Search PubMed.
- Ch. Duyck, N. Miekeley, C. L. P. da Silveira and P. Szatmari, Spectrochim. Acta, Part B, 2002, 57, 1979–1990 CrossRef.
- Ch. Duyck, N. Miekeley, C. L. P. da Silveira, R. Q. Aucelio, R. C. Campos, P. Grinberg and G. P. Brandao, Spectrochim. Acta, Part B, 2007, 62, 939–951 CrossRef.
- C. P. Lienemann, S. Dreyfus, C. Pecheyran and O. F. X. Donard, Oil Gas Sci. Technol., 2007, 62, 69–77 CrossRef CAS.
- M. G. R. Vale, I. C. F. Damin, A. Klassen, M. M. Silva, B. Welz, A. F. Silva, F. G. Lepri, A. F. Silva, D. L. G. Borges and U. Heitmann, Microchem. J., 2004, 77, 131–140 CrossRef CAS.
- I. C. F. Damin, M. G. R. Vale, M. M. Silva, B. Welz, F. G. Lepri, W. N. L. Santos and S. L. C. Ferreira, J. Anal. At. Spectrom., 2005, 20, 1332–1336 RSC.
- M. M. Silva, I. C. F. Damin, M. G. R. Vale and B. Welz, Talanta, 2007, 71, 1877–1885 CrossRef CAS.
- M. G. R. Vale, M. M. Silva, I. C. F. Damin, P. J. S. Filho and B. Welz, Talanta, 2008, 24, 1385–1391 CrossRef.
- G. B. Brandao, R. C. Campos, E. V. R. Castro and H. C. Jesus, Anal. Bioanal. Chem., 2006, 386, 2249–2253 CrossRef CAS.
- D. P. C. Quadros, E. S. Chaves, F. G. Lepri, D. L. G. Borges, B. Welz, H. Becker-Ross and A. J. Curtius, Energy Fuels, 2010, 24, 5907–5911 CrossRef CAS.
- P. Pohl, N. Vorapalawut, B. Bouyssiere, H. Carrier and R. Łobiński, J. Anal. At. Spectrom., 2010, 25, 704–709 RSC.
- M. N. M. Reyes and R. C. Campos, Spectrochim. Acta, Part B, 2005, 60, 615–624 CrossRef.
- A. Anselmi, P. Tittarelli and D. A. Katskov, Spectrochim. Acta, Part B, 2002, 57, 403–411 CrossRef.
- M. C. Gonzalez, A. R. Rodriquez and V. Gonzalez, Microchem. J., 1987, 35, 94–106 CrossRef CAS.
- N. N. Meeravali and S. J. Kumar, J. Anal. At. Spectrom., 2001, 16, 527–532 RSC.
- R. J. Cassella, D. M. Brun, C. E. R. De Paula and C. F. Lima, J. Anal. At. Spectrom., 2010, 25, 1704–1711 RSC.
- F. Bruhn and V. G. Cabalin, Anal. Chim. Acta, 1983, 147, 193–203 CrossRef.
- Z. Kowalewska, in Contemporary State, Development and Applications of Spectroscopic Methods. Proceedings of 4th European Furnace Symposium and XVth Slovak Spectroscopic Conference, ed. E. Krakowska, Kosice-High, Tatras-Slovakia, 2000, pp. 245–248 Search PubMed.
- A. Anselmi and P. Tittarelli, Riv. Combust., 1994, 48, 435–441 CAS , in Italian.
- V. Sychra, I. Lang and G. Seborg, Prog. Anal. At. Spectrosc., 1981, 4, 341–426 CAS.
- D. I. Polidorio, J. Naozuka, E. C. Vieira and P. V. Oliveira, Anal. Lett., 2008, 41, 1547–1554 CrossRef CAS.
- R. Sadeghbeigi, Fluid Catalytic Cracking Handbook: Design, Operation and Troubleshooting of FCC Facilities, Gulf Publishing Company, Huston, 2000 Search PubMed.
- L. L. Upson, Hydrocarbon Process., 1981, 253–258 CAS.
- J. F. Branthaver, in Metal Complexes in Fossil Fuels: Geochemistry, Characterization and Processing, ed. R. H. Filby, J. F. Brathaver and H. Filby, ACS Symposium Series 344, New York, 1986 Search PubMed.
- EN ISO 14597:1999. Liquid petroleum products. Determination of vanadium and nickel vanadium content. Wavelength dispersive X-ray fluorescence spectrometry.
- EN 15944:2010. Liquid petroleum products. Determination of nickel and vanadium content. Inductively coupled plasma optical emission spectrometry method (ICP OES).
- IP PM-CW/04. Determination of low level metallic elements in vacuum gas oil/waxy distillates and crude oils. Flame atomic absorption spectrophotometry (AAS) or inductively coupled plasma – optical emission spectrophotometry (ICP-OES) method.
- EN ISO 13131:2000. Liquid petroleum products. Determination of nickel and vanadium content. Atomic absorption spectrometric method.
- UOP Method 848-84, Nickel, vanadium, iron, lead, cooper and sodium in gas oil by AAS, 1984.
- M. Turunen, S. Paraniemi, M. Ahlgren and H. Westerholm, Anal. Chim. Acta, 1995, 311, 85–91 CrossRef CAS.
- J. Alvarado, A. R. Picon and C. M. De Vecchi, Acta Cient. Venez., 1990, 41, 306–310 CAS.
- S. Carballo-Paradelo, R. M. Soto-Ferreiro, S. Amor-Pastoriza, A. Carlosena-Zubieta, F. Fernandez-Fernandez, S. Muniategui-Lorenzo, P. Lopez-Mahia and D. Prada Rodriquez, At. Spectrosc., 2009, 30, 129–138 CAS.
- S. H. Omang, Anal. Chim. Acta, 1971, 56, 470–473 CrossRef CAS.
- N. B. Iwanienko, A. A. Iwanienko, E. V. Molodkina, E. B. Nosova, A. E. Zeimal and Yu. A. Zavoda, Russ. J. Appl. Chem., 2006, 79, 1546–1549 CrossRef.
- Z. Kowalewska, Spectrochim. Acta, Part B, 2012, 67, 31–39 CrossRef.
- Z. Kowalewska, Spectrochim. Acta, Part B, 2011, 66, 546–556 CrossRef CAS.
- R. Sanchez, J.-L. Todoli, Ch.-P. Lienemann and J. M. Mermet, J. Anal. At. Spectrom., 2009, 24, 391–401 RSC.
- Z. Kowalewska, Chem. Anal., 1996, 41, 809–820 CAS.
- Z. Kowalewska, Spectrochim. Acta, Part B, 2007, 62, 273–282 CrossRef.
- G. Caumette, Ch.-P. Lienemann, I. Merdignac, B. Bouyssiere and R. Łobiński, J. Anal. At. Spectrom., 2009, 24, 263–276 RSC.
| This journal is © The Royal Society of Chemistry 2013 |