Strong size-dependent photoacoustic effect on gold nanoparticles: a sensitive tool for aggregation-based colorimetric protein detection†
Xiangjiang
Liu
,
Martín G.
González
,
Reinhard
Niessner
and
Christoph
Haisch
*
Chair for Analytical Chemistry, Technische Universität München, Marchioninistrasse 17, Munich, D-81377, Germany. E-mail: christoph.haisch@ch.tum.de; Fax: +49 89 2180 99 78242; Tel: +49 89 2180 78242
First published on 20th October 2011
Abstract
Based on measuring the change of the photoacoustic (PA) signal generated by laser-induced nanobubbles, a new way to detect gold nanoparticles (GNPs) aggregation is demonstrated and applied to selective protein detection.
In the past decades, intense research was devoted to the development of analytical methods for rapid, low-cost, and sensitive detection of proteins, DNA and other biologically relevant small molecules. Currently, fluorophore label-based detection methods are dominating the market. Nanomaterials such as quantum dots, carbon nanotubes, silicon nanowires, and metallic nanoparticles are proposed as alternative signaling probes for the detection.1 Among them, gold nanoparticles (GNPs) have attracted enormous attention due to their unique size- and distance-dependent optical properties. A common sensing mechanism is based on aggregation of receptor-conjugated GNPs in the presence of the target molecule, which leads to a color change of the GNP suspension. This phenomenon can be detected by naked eyes or a UV-vis absorption spectrometer. This technique has been applied for different purposes such as duplex DNA formation,2,3protein–ligand interactions,4,5 immunological recognitions,6,7 and metal ion–ligand complexation.8–11 The main problem of these aggregation-based colorimetric methods is their limited sensitivity. A UV-vis spectrometer can detect aggregation only if the aggregation level is high enough to cause a color change. In order to enhance the sensitivity, many signal amplification strategies have been proposed.12 However, these improvements often involve complicated multistep procedures that are not only time consuming but also can reduce the reproducibility of the results significantly. As a new tool for monitoring GNP aggregation, dynamic light scattering has been introduced recently.13–15 This technique has achieved a much higher sensitivity than UV-vis absorbance spectrometry.
In this work, we present a new tool to monitor GNP aggregation. This tool is based on the strong size-dependent photoacoustic (PA) effect on GNPs. Generally, the PA effect is generated via the absorption of pulsed or modulated light by the sample. The absorbed energy leads to local warming of the sample matrix, and in consequence, to a thermal expansion. When a GNP is irradiated by intense laser pulses, the temperature of the GNP can exceed the boiling point of the surrounding medium, and a vapor layer forms on the surface of the GNP (laser-induced nanobubbles). This vapor layer expands rapidly and produces an intense PA signal. In a previous work, we found that the amplitude of this PA signal generated by laser-induced nanobubbles (PA-LINB) strongly depends on the GNP size.16 Since GNP aggregation can be understood as a particle size changing process, it can be hypothesized that the aggregation can cause a significant change of the PA-LINB amplitude. Therefore, the PA-LINB can be used to measure GNP aggregation for the purpose of analytical detections. To demonstrate the feasibility of this assumption, we present here the realization of the concept by target-triggered aggregation of GNPs for protein detection.
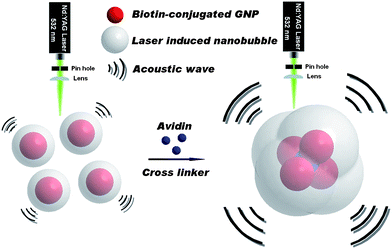
As shown in Fig. 1, the binding of avidin with two biotin-conjugated GNPs will cause GNPs to form dimers, trimers, and larger aggregates. This GNP aggregation will increase the average diameter of the whole nanoparticle population. The subsequent change of PA-LINB can be measured by our photoacoustic setup16 and correlated to the avidin concentration. The biotin-conjugated GNP sample was prepared by the classic thiol–gold method.1–3 The –SH bonds were first modified by the reaction of N-(+)-biotinyl-6-aminocaproic acid, N-succinimidyl ester and cysteamine. Afterwards, biotin is bound to the GNP surface by the high affinity of –SH and gold (see ESI†).
 | ||
| Fig. 1 Schematic illustration of target-triggered GNP aggregation enhancing the amplitude of PA-LINB for sensitive avidin detection. | ||
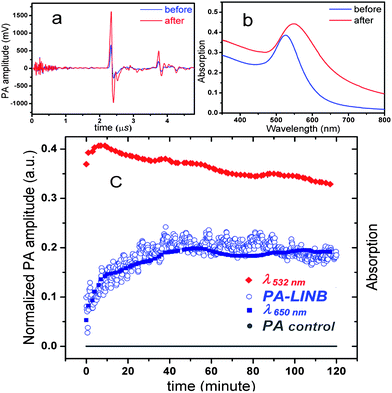
As we expected, the amplitude PA-LINB shown in Fig. 2a increased significantly after the addition of avidin. For comparison, UV-vis spectra of the GNP probe before and after the addition of avidin (all measurements represent values averaged over 50 laser pulses) were also collected under the same experimental conditions. The broadening and red-shift of spectra shown in Fig. 2b can be considered as the evidence of aggregation after the introduction of avidin. Fig. 2c shows a typical evolution of the PA-LINB over the time after the addition of avidin. The PA-LINB raises significantly when aggregation starts and then gradually saturates until the action reaches equilibrium.
 | ||
| Fig. 2 PA amplitude (a) and the corresponding UV-vis absorption spectra (b) before and after the addition of avidin. (c) Time-dependent evolution of the PA amplitude (PA-LINB), absorption at 532 nm (λ532nm) and 650 nm (λ650nm) after addition of avidin (biotin-conjugated GNP size: 12.5 nm, concentration: 1.5 × 10¹² particles per mL, avidin concentration: 30 nM). For control test, time-dependent evolution of the PA amplitude (PA control) of mixing 30 nM biotin and 30 nM avidin was also measured by our PA setup. | ||
A control test was performed in order to confirm that the increment of the PA signal is indeed due to the aggregation of GNP probes. We measured the mixing process of avidin and biotin (not biotin-conjugated GNP) by our PA setup. Since the solutions of avidin, biotin, and their reaction product are transparent in the visible spectral range and do not absorb laser energy, there is no detectable PA signal during the mixing process, as it can be seen in Fig. 2c (PA control). Hence it can be followed that the change of the PA signal was not induced by the binding of avidin and biotin.
Another important observation is the lack of correlation between the PA-LINB signal and the absorbance at 532 nm (λ532nm). Due to the gradual red-shift of the absorption maximum at ∼520 nm, λ532nm was decreasing constantly after a short initial increase. This excludes the possibility that the increment of PA-LINB was due to the increment of absorbance of the solution at the laser wavelength. On the other hand, PA-LINB shows a similarity to λ650nm, and λ650nm is generally regarded as an indicator of aggregation level of the GNPs. Based on the above discussion, the change of PA-LINB can certainly be related to aggregation.
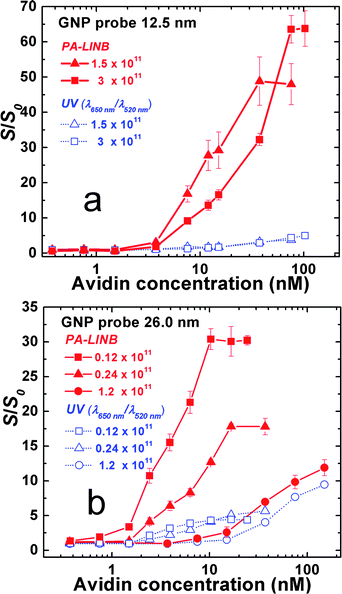
To evaluate the sensitivity of this approach for protein quantification, the PA-LINB responses to different avidin concentrations are measured. The results are plotted in Fig. 3.
 | ||
| Fig. 3 Comparison of the experimental results obtained from PA and UV-vis at different concentrations of avidin. The biotin-conjugated GNP size is (a) 12.5 nm and (b) 26 nm; S0: response of the blank sample. Each of the data points in this figure was averaged from the measurements of consecutive 50 laser pluses. | ||
Probes using different diameters of GNP (12.5 and 26.0 nm) were prepared and then were diluted to different concentrations by water. For comparison, the UV-vis response ratios (α650nm/α520nm) under the same conditions are also shown in Fig. 3. The ratio of signals after and before aggregation, S/S0, was calculated as an indicator of the sensitivity. As demonstrated in Fig. 3 and respectively Table 1, the PA response is significantly more sensitive than a UV-vis signal. This conclusion is confirmed by both sizes of biotin-conjugated GNPs found in this study. Table 1 summarizes the limit of detection (LOD) and linear working range of above experiments. The results in the table indicate that the PA technique can detect avidin concentrations as low as 0.20 nM.
| PA-LINB | UV-vis | ||||
|---|---|---|---|---|---|
| GNP size | Concentration of probe | Linear range | LOD | Linear range | LOD |
| (nm) | (particles/mL) | (nM) | (nM) | (nM) | (nM) |
| 12.5 | 3 × 10¹¹ | 2.5–70 | 2.5 | 12–100 | 12 |
| 1.5 × 10¹¹ | 2.0–30 | 2 | 10–30 | 10 | |
| 1.2 × 10¹¹ | 7.5–160 | 5 | 10–160 | 7 | |
| 26.0 | 0.24 × 10¹¹ | 1.6–20 | 0.5 | 2–16 | 2 |
| 0.12 × 10¹¹ | 1.5–10 | 0.20 | 4–10 | 4 | |
| 83.3 | 0.012 × 10¹¹ | 0.4–10 | 0.4 | 3–10 | 3 |
The results shown in Table 1 indicate that the improvement of the LOD is inversely proportional to the probe concentration. Therefore, a possible way to enhance the LOD is to use a probe concentration as low as our PA setup can detect. We also tried to use larger GNP (83.3 nm) to prepare the probe, because larger particles generally generate stronger PA signals.16 Thus, a lower probe concentration can be used to perform the assay. But all measurements from large GNP probes (83.3 nm) display large standard deviations (data not shown). This effect can be explained by the statistic distribution of the particles in the focal zone of the laser beam, leading to large inhomogeneities for very low particle concentrations. For this reason, the larger probe cannot improve the LOD of our PA assay in this case.
On the other hand, it can also been seen from Table 1 that the working range decreases with a decreasing probe concentration. A possible explanation for this phenomenon is that there are less binding sites available for avidin in the solution, and therefore the response saturates. However, it should be noted that an excess of avidin will hinder GNP aggregation and causes a decrease of the signal. This is a common problem for this type of cross-linking aggregation-based assay.
Additionally, PA spectroscopy offers several more advantages compared to UV-vis in detecting aggregation. PA-LINB is an absolute measure of aggregation, which is quite different from UV-vis spectroscopy, where a ratio of absorbance at different wavelengths is normally used to determine the degree of aggregation. The PA technique is significantly less sensitive to light scattering17 than UV/vis, which makes it more accurate than UV-vis in light scattering medium. Hence, it would be possible to introduce scattering materials (magnetic nanoparticles, silica and polystyrene nano/microspheres,18etc.) into the experiment, for the further improvement.
Conclusions
In summary, we have opened a new way to detect GNPs aggregation, based on measuring the change of the PA signal generated by the laser-induced nanobubble. To our knowledge this work is the first application of this technique in selective molecule quantification. A LOD for avidin was obtained as low as 0.20 nM. In principle, the method presented here could be extended to detect other interesting target, using different GNP probes. Hence, it is worth mentioning that as a sensitive aggregation detection tool, PA-LINB holds a great potential in aggregation-based colorimetric protein detection.Acknowledgements
Grants from China Scholarship Council (CSC), Deutscher Akademischer Austauschdienst (DAAD), and Facultad de Ingeniería Universidad de Buenos Aires (FIUBA) for two of the authors are gratefully acknowledged.Notes and references
- N. L. Rosi and C. A. Mirkin, Chem. Rev., 2005, 105, 1547–1562 CrossRef CAS.
- R. Elghanian, J. J. Storhoff, R. C. Mucic, R. L. Letsinger and C. A. Mirkin, Science, 1997, 277, 1078–1081 CrossRef CAS.
- C. A. Mirkin, R. L. Letsinger, R. C. Mucic and J. J. Storhoff, Nature, 1996, 382, 607–609 CrossRef CAS.
- S. Cobbe, S. Connolly, D. Ryan, L. Nagle, R. Eritja and D. Fitzmaurice, J. Phys. Chem. B, 2002, 107, 470–477 CrossRef.
- S.-J. Park, A. A. Lazarides, C. A. Mirkin and R. L. Letsinger, Angew. Chem., Int. Ed., 2001, 40, 2909–2912 CrossRef CAS.
- L. R. Hirsch, J. B. Jackson, A. Lee, N. J. Halas and J. L. West, Anal. Chem., 2003, 75, 2377–2381 CrossRef CAS.
- N. T. K. Thanh and Z. Rosenzweig, Anal. Chem., 2002, 74, 1624–1628 CrossRef CAS.
- T. B. Norsten, B. L. Frankamp and V. M. Rotello, Nano Lett., 2002, 2, 1345–1348 CrossRef CAS.
- S.-Y. Lin, S.-W. Liu, C.-M. Lin and C.-H. Chen, Anal. Chem., 2001, 74, 330–335 CrossRef.
- S. O. Obare, R. E. Hollowell and C. J. Murphy, Langmuir, 2002, 18, 10407–10410 CrossRef CAS.
- J. Liu and Y. Lu, J. Am. Chem. Soc., 2003, 125, 6642–6643 CrossRef CAS.
- J.-M. Nam, S. I. Stoeva and C. A. Mirkin, J. Am. Chem. Soc., 2004, 126, 5932–5933 CrossRef CAS.
- Q. Dai, X. Liu, J. Coutts, L. Austin and Q. Huo, J. Am. Chem. Soc., 2008, 130, 8138–8139 CrossRef CAS.
- H. Jans, X. Liu, L. Austin, G. Maes and Q. Huo, Anal. Chem., 2009, 81, 9425–9432 CrossRef CAS.
- J. R. Kalluri, T. Arbneshi, S. Afrin Khan, A. Neely, P. Candice, B. Varisli, M. Washington, S. McAfee, B. Robinson, S. Banerjee, A. K. Singh, D. Senapati and P. C. Ray, Angew. Chem., Int. Ed., 2009, 48, 9668–9671 CAS.
- M. G. Gonzalez, X. Liu, R. Niessner and C. Haisch, Appl. Phys. Lett., 2010, 96, 174104 CrossRef.
- T. Schmid, U. Panne, R. Niessner and C. Haisch, Anal. Chem., 2009, 81, 2403–2409 CrossRef CAS.
- M. G. González, X. Liu, R. Niessner and C. Haisch, Sens. Actuators, B, 2010, 150, 770–773 CrossRef.
Footnote |
| † Electronic supplementary information (ESI) available: Photoacoustic setup and PA signal analysis, synthesis and characterization of gold nanoparticles, preparation of biotin-conjugated GNP sample, protocols about aggregation of biotin-conjugated GNP in the presence of avidin. See DOI: 10.1039/c1ay05497j |
| This journal is © The Royal Society of Chemistry 2012 |
