Ligandless-ultrasound-assisted emulsification-microextraction combined with inductively coupled plasma-optical emission spectrometry for simultaneous determination of heavy metals in water samples
Hassan
Sereshti
*,
Vahid
Khojeh
,
Maryam
Karimi
and
Soheila
Samadi
Department of Chemistry, Faculty of Science, University of Tehran, Tehran, Iran. E-mail: sereshti@khayam.ut.ac.ir; Fax: +98 21 66495291; Tel: +98 21 61113632
First published on 23rd November 2011
Abstract
In the present study, the simple and efficient method of ligandless-ultrasound-assisted emulsification-microextraction (LL-USAEME) has been developed for the simultaneous preconcentration and determination of chromium and zinc in water samples by inductively coupled plasma-optical emission spectrometry (ICP-OES). Tetrachloroethylene was selected as the extraction solvent. A fractional factorial design (25−1) and a Box–Behnken design (BBD) were used to identify and optimize the most important parameters that influence the ultrasound microextraction process. The optimum levels of the effective parameters were: 190 μL for volume of extraction solvent, 11.4 for pH, 15% (w/v) for the salt concentration and 5 min for sonication time. Under the optimum conditions, the relative standard deviations (RSDs, C = 100 μg L−1, n = 7) were 2.5% and 3.1% for Cr and Zn respectively. The calibration graphs were linear in the range of 0.5–1500 μg L−1 for both the metal ions with determination coefficients (R2) of 0.997. The limits of detection (LODs) for Cr and Zn were 0.20 and 0.28 μg L−1, respectively. The proposed method was successfully applied to the analysis of three real environmental water samples and satisfactory recoveries (90–109%) were achieved.
Introduction
The inductively coupled plasma optical emission spectrometry (ICP-OES) technique which offers fast multi-elemental analysis, suffers from poor sensitivity, because the concentration of some metals in environmental samples is below the detection limit of ICP-OES. To solve this problem, preconcentration separation procedures have been proposed. Thus, preconcentration is a very important issue for achievement of low detection limits.1–4 Several different methods have been proposed for pre-concentration and separation of trace levels of Cr and Zn, such as liquid–liquid extraction (LLE),5co-precipitation,6solid phase extraction (SPE),7cloud point extraction (CPE),8liquid phase microextraction (LPME)9 and dispersive liquid–liquid microextraction (DLLME).10 The principal advantages of DLLME are low cost, high enrichment factor, and the use of simple equipment, but it is difficult to automate and requires a disperser solvent which usually decreases the partition coefficient of analytes into the extraction solvent.11,12In 2008, Reguerio et al. developed a new method of ultrasound-assisted emulsification-microextraction (USAEME), which overcomes the DLLME problems. This method is a combination of of micro-extracting systems and ultrasound radiation that provides an efficient preconcentration technique,13 for separation of organic and inorganic compounds.14–21 Two processes occur during ultrasonic emulsification: (a) interfacial instability of the oil–water interface and (b) transient cavitation bubbles that generate micro streaming, high-pressure shock waves and a high local temperature during their collapse. These phenomena accelerate the mass transfer process between two immiscible phases by generating a smaller droplet size of the dispersed phase.22,23
To the best of our knowledge, this study describes the first application of USAEME for the simultaneous preconcentration of Cr+3 and Zn+2 from water samples without the addition of a chelating agent. ICP-OES was used for determination of the analytes. After selection of the most suitable extraction solvent, a fractional factorial design 25−1 (FFD) and a Box–Behnken design (BBD) was applied to investigate and optimize the main parameters such as volume of the extraction solvent, pH, salt concentration, extraction temperature and sonication time that affect the LL-USAEME efficiency. The most important advantages of LL-USAEME combined with ICP-OES are minimum use of toxic organic solvents, extraction at room temperature, simplicity, low cost, enhanced sensitivity, low sample volume (10 mL) and low extraction time. To demonstrate the applicability of this method, several real water samples including mineral water, tap water and sea water were analyzed.
Experimental
Instrumentation
An Eurosonic 4D ultrasonic water bath with temperature control and a digital timer to control the time of sonication was used to emulsify the organic solvent (Euronda, Montecchio Precalcino (Vicenza) Italy). A Vista-MPX ICP-OES (Varian Inc., Melbourne, Victoria 3170, Australia) coupled to a slurry nebulizer and equipped with a charge coupled device detector was used for determination of the analytes. The instrumental parameters of ICP-OES and emission lines of the metal ions are shown in Table 1. The pH values were measured with a Metrohm pH-meter Model: 691 (CH-9100 Herisau, Switzerland) with a combined glass electrode. A Hermel-Z 200 A centrifuge (Wehingen-Germany) was applied to assist the phase separation. A 100 μL Hamilton microsyringe (Bonaduz, Switzerland) was used to inject the organic solvent into aqueous samples.| Parameter | Value |
|---|---|
| RF generator power (kW) | 1.3 |
| Plasma gas flow rate (L min−1) | 15 |
| Auxiliary gas flow rate (L min−1) | 1.5 |
| Nebulizer pressure (kPa) | 150 |
| Torch mode | Axial |
| Wavelength of zinc (nm) | 213.857 |
| Wavelength of chromium (nm) | 267.716 |
Materials and solutions
The chemicals such as chloroform, carbon tetrachloride, 1,1,2,2-tetrachloroethylene, 1,1,2- trichloroethylene, chlorobenzene,1,2-dichloroethylene, Cr(NO3)3·5H2O, ZnO and sodium chloride with a purity higher than 99% and HNO3 (65%, extra pure) were purchased from Merck (Darmstadt, Germany). Stock standard solutions (1000 mg L−1) of Cr+3 and Zn+2 were prepared by the direct dissolution of suitable amounts of Cr(NO3)3·5H2O and ZnO salts in a 10 mL solution of HNO3 (1 mol L−1) and were diluted to 50 mL in a standard volumetric flask and stored in the dark at 4 °C. The standard solutions were diluted with double distilled water to prepare the mixed standard solutions. Working solutions were prepared daily by a suitable dilution of the mixed standard solutions. Phosphate buffer (0.2 mol L−1), nitric acid (1 mol L−1) and/or sodium hydroxide solutions (1 mol L−1) were used for adjusting the pH of the solutions. The laboratory glassware was kept for 24 h in a 1 mol L−1HNO3 solution and subsequently washed with double distilled water before using. Water standard reference material of CRM-TMDW-500 drinking water (High-Purity Standards Inc, Charleston, SC, USA), CASS.4 seawater and river water reference material SLRS-4 (National Research Council of Canada, Ottawa, Ontario, Canada) were employed for validation of the proposed method.Ligandless ultrasound-assisted emulsification-microextraction procedure
Firstly, 10 mL of sample solution containing 100 μg L−1 of Cr and Zn was adjusted to pH 11.4 and placed in a 12 mL screw cap glass test tube with a conical bottom, then 1 mL of a solution of NaCl 15% (w/v) was added to it. The tube was immersed into an ultrasonic water bath. Then, 190 μL of tetrachloroethylene (extraction solvent) was injected slowly into the sample solution by using a micro syringe. Thereby, a cloudy solution was formed in the test tube. In this step, Cr and Zn reacted with hydroxide ions and were extracted into the fine droplets of the extraction solvent. Extraction was performed under ultrasonic radiation for 7 min at laboratory temperature (25 °C). The emulsion was disrupted by centrifugation at 4000 rpm for 5 min causing the organic phase to deposit at the bottom of the conical tube. The sedimented phase was transferred to another test tube and dried in an oven at 120 °C. Finally, the residue was dissolved in 0.5 mL (1 mol L−1) HNO3 and the concentration of the metal ions was determined by ICP-OES.Results and discussion
In this study, a combination of LL-USAEME with experimental design followed by ICP-OES was developed for preconcentration and determination of trace amounts of Cr and Zn in water samples.After selection of the most suitable extraction solvent, the effective parameters of LL-USAEME were investigated by a half-fractional factorial design (25−1). The results demonstrated that the extraction temperature was not significant. In the next step, a BBD was applied to obtain the optimal conditions. Finally, the calibration and validation of the method was performed and the linear dynamic range, limit of detection and repeatability were determined.
Selection of extraction solvent
The selection of a suitable extraction solvent in the USAEME method is limited by several characteristics. It has to be denser than water with high extraction capability of the compounds of interest and has to have low solubility in water.16 Therefore, chloroform (CHCl3), carbon tetrachloride (CCl4), 1,1,2,2-tetrachloroethylene (C2Cl4), 1,1,2-trichloroethylene (C2HCl3), chlorobenzenes (C6H5Cl) and 1,2-dichloroethylene (C2H2Cl2) were examined during the extraction of Cr and Zn. 10 mL aliquots of distilled water including 100 μg L−1 of Cr and Zn, adjusted to pH 10, were extracted by using 100 μL of each solvent under ultrasonic radiation for 5 min. Emulsification was observed in all cases except with C2H2Cl2 and CHCl3 which completely dissolved in the aqueous solution. Similar observations have been reported for the USAEME from aqueous solutions of synthetic musk fragrances, phthalate esters and lindane,13 polybrominated biphenyl ethers16 and polychlorinated biphenyls. 11 The total ICP-OES intensities (including the net signal of Cr and Zn) for C2Cl4, C2HCl3, C6H5Cl and CCl4 were 25654, 23252, 21347 and 23129, respectively. Based on these results, C2Cl4 was selected as the extraction solvent for subsequent experiments (Fig. 1).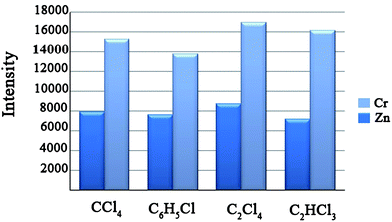 | ||
| Fig. 1 Effect of type of extraction solvent on the intensities of metal ions. Extraction conditions: sample volume, 10 mL; volume of extraction solvent; 100 μL, pH = 10; sonication time, 5 min; concentration of metal ions, 100 μg L−1. | ||
Factorial design
The most popular two level full or (fractional) factorial designs, are described as 2k designs where the base 2 stands for the number of factor levels and k is the number of factors. The number of experiments for full and fractional designs are equal to 2k and 2k−1, respectively, where p describes the size of the fraction of the full factorial used. In cases where the number of factors increases, a fractional factorial design is preferred.24,25 In order to evaluate the method, the average recovery of Cr and Zn was considered to be the experimental response. Based on the preliminary studies, five factors including volume of extraction solvent, pH, salt concentration, extraction temperature and sonication time were considered. The factors, their symbols and levels are shown in Table 2. Therefore, a half-fraction factorial design (25−1) with 16 experiments was executed to explore the important factors and their interactions. In order to minimize the effect of uncontrolled variables, the experiments were randomized, and since the run time of experiments are relatively long they were divided into two blocks with eight experiments in each.26 The design matrix and the responses are shown in Table 3.| Variable | Symbol | Variable levels | |
|---|---|---|---|
| −1 | +1 | ||
| Volume of extraction solvent (μL) | E | 100 | 200 |
| pH | P | 4 | 11 |
| Salt concentration (%w/v) | S | 0 | 15 |
| Extraction temperature (°C) | T | 25 | 45 |
| Sonication time (min) | t | 10 | 20 |
| Block | Run no. | E | P | S | T | t | Recovery (%) |
|---|---|---|---|---|---|---|---|
| 1 | 1 | 1 | −1 | −1 | 1 | 1 | 4 |
| 1 | 2 | −1 | −1 | −1 | −1 | −1 | 8 |
| 1 | 3 | −1 | −1 | 1 | −1 | 1 | 9 |
| 1 | 4 | 1 | 1 | 1 | −1 | 1 | 95 |
| 1 | 5 | 1 | 1 | −1 | −1 | −1 | 37 |
| 1 | 6 | 1 | −1 | 1 | 1 | −1 | 8 |
| 1 | 7 | −1 | 1 | −1 | 1 | −1 | 29 |
| 1 | 8 | −1 | 1 | 1 | 1 | −1 | 86 |
| 2 | 9 | −1 | −1 | −1 | 1 | −1 | 13 |
| 2 | 10 | 1 | −1 | −1 | −1 | 1 | 9 |
| 2 | 11 | 1 | 1 | 1 | −1 | −1 | 45 |
| 2 | 12 | −1 | 1 | 1 | −1 | −1 | 83 |
| 2 | 13 | 1 | −1 | 1 | −1 | −1 | 16 |
| 2 | 14 | −1 | 1 | −1 | −1 | 1 | 14 |
| 2 | 15 | 1 | 1 | 1 | 1 | 1 | 73 |
| 2 | 16 | −1 | −1 | 1 | 1 | 1 | 15 |
To find the most important effects and their interaction, analysis of variance (ANOVA) was obtained by using a trial version of the software package “Design-expert 7.1.6”, and the following information was achieved. The F-value of the model was 29.78, therefore the model is significant and the probability that a “model F-value” this large could occur due to noise is only 0.87%. Model terms with probability > F values of less than 0.0500 are significant. Therefore, two main effects P (pH), S (salt concentration) and one two-factor interaction effect Et (volume of extraction solvent–sonication time) were the most significant model terms. The results of fractional factorial design showed that by increasing the extraction temperature from 25 °C to 50 °C the response is constant, thus, the following experiments were performed at 25 °C. Therefore, four factors including volume of extraction solvent, pH, salt concentration and sonication time were considered in the next step of the experimental design.
Box–Behnken design
The optimization step of the USAEME method was executed by using a BBD. The number of experiments (N) required for BBD development is defined as N = 2k (k − 1) + C0, where k is the number of factors and C0 is the number of center points. All factor levels have to be adjusted only at three levels, coded with +1, 0, −1 for high, intermediate and low value.27In this study, k and C0 were 4 and 6, respectively. Therefore, a total of 30 experiments had to be run, out of which 6 were replicated experiments carried out in the center of the design. The main factors, their symbols and levels are shown in Table 4 and the design matrix with the related responses are given in Table 5.
| Variables | Symbol | Levels | ||
|---|---|---|---|---|
| -1 | 0 | 1 | ||
| Volume of extraction solvent (μL) | E | 50 | 125 | 200 |
| pH | P | 8 | 10 | 12 |
| Salt concentration (%w/v) | S | 5 | 15 | 25 |
| Sonication time (min) | t | 5 | 15 | 25 |
| Run | Block | E | P | S | t | Recovery (%) |
|---|---|---|---|---|---|---|
| 1 | 1 | 50 | 8 | 15 | 15 | 54 |
| 2 | 1 | 200 | 8 | 15 | 15 | 36 |
| 3 | 1 | 200 | 12 | 15 | 15 | 85 |
| 4 | 1 | 125 | 10 | 15 | 15 | 63 |
| 5 | 1 | 125 | 10 | 25 | 25 | 44 |
| 6 | 1 | 125 | 10 | 5 | 5 | 61 |
| 7 | 1 | 125 | 10 | 25 | 5 | 55 |
| 8 | 1 | 125 | 10 | 5 | 25 | 43 |
| 9 | 1 | 50 | 12 | 15 | 15 | 52 |
| 10 | 1 | 125 | 10 | 15 | 15 | 72 |
| 11 | 2 | 125 | 12 | 5 | 15 | 58 |
| 12 | 2 | 200 | 10 | 15 | 5 | 83 |
| 13 | 2 | 50 | 10 | 15 | 25 | 65 |
| 14 | 2 | 125 | 8 | 25 | 15 | 33 |
| 15 | 2 | 125 | 10 | 15 | 15 | 72 |
| 16 | 2 | 50 | 10 | 15 | 5 | 67 |
| 17 | 2 | 125 | 8 | 5 | 15 | 26 |
| 18 | 2 | 125 | 12 | 25 | 15 | 53 |
| 19 | 2 | 200 | 10 | 15 | 25 | 56 |
| 20 | 2 | 125 | 10 | 15 | 15 | 73 |
| 21 | 3 | 125 | 10 | 15 | 15 | 61 |
| 22 | 3 | 50 | 10 | 25 | 15 | 58 |
| 23 | 3 | 125 | 12 | 15 | 25 | 65 |
| 24 | 3 | 50 | 10 | 5 | 15 | 54 |
| 25 | 3 | 200 | 10 | 5 | 15 | 66 |
| 26 | 3 | 200 | 10 | 25 | 15 | 64 |
| 27 | 3 | 125 | 8 | 15 | 25 | 26 |
| 28 | 3 | 125 | 8 | 15 | 5 | 58 |
| 29 | 3 | 125 | 12 | 15 | 5 | 62 |
| 30 | 3 | 125 | 10 | 15 | 15 | 63 |
The software package “Design-expert 7.1.6” was used to analyze the experimental data. The ANOVA table was used to evaluate the significance of the model and model terms (Table 6). An “F-value” equal to 31.95 shows that the model is significant. The “lack of fit (LOF) F-value” of 1.29 is not significant relative to the pure error and confirms the validity of the model. The model in terms of coded factors is shown in eqn (1), it consists of four main effects, three two-factor interaction effects and four curvature effects, where b0 is the intercept and the b terms are the coefficient of the effects.
| Sqrt(R) = +68.11 + 3.45A + 11.79B − 0.12C − 7.26D + 12.83AB − 6.00AD + 8.99BD + 3.63A2 − 13.07B2 − 12.26C2 − 3.30D2 | (1) |
The determination coefficients (R2, adjusted-R2 and adequate precision) are used to express quality of the model. An R2 that is equal to 0.9565, shows the amount of variation around the mean. In this case, this value indicates that 95.65% of the variability in the response could be explained by the model. The adjusted-R2 is a measure of the number of terms in the model and changes with the number of terms of the model inversely. It is equal to 0.9265. Adequate precision is a ratio of the range of the predicted values at the design points to the average prediction error. For ratios greater than 4 the model is significant. Here it is equal to 22.43.
In the next step, to interprete the important interactions and visualize the relationship between the response and levels of each factor, three-dimensional (3D) plots were used. The response model is mapped against two experimental factors while the others are held constant at their central levels.26
Fig. 2a shows the effect of pH (P) and volume of extraction solvent (E) interaction on the response while the sonication time (t) and salt amount (S) are fixed at their central values. In this figure, it can be seen that at a high volume of extraction solvent, by increasing the pH from 8 to 12, the response increases which indicates the formation of the metal hydroxides and their subsequent extraction. On the other hand, at high pH values, by increasing the volume of extraction solvent the response increases, which indicates that a low volume of extraction solvent is not sufficient for extraction of heavy metals. Fig. 2b shows the effect of sonication time (t) and volume of extraction solvent (E) interaction on the response while the pH (P) and salt amount (S) are fixed at their central values. Maximum recoveries were obtained with higher volumes of extraction solvent and at low sonication times, showing high distribution coefficients of heavy metals under these conditions.
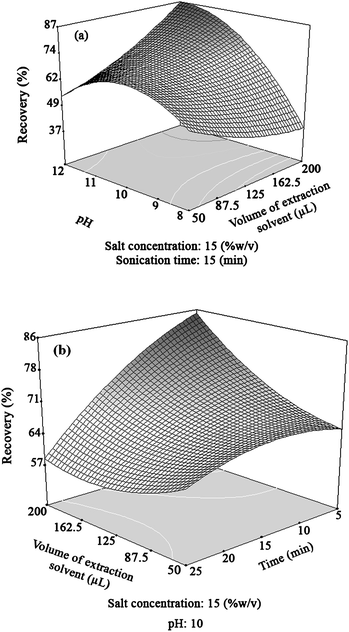 | ||
| Fig. 2 Three-dimensional (3D) response surface graphs for: (a) pH and volume of extraction solvent (μL); (b) time (min) and volume of extraction solvent (μL). | ||
Analytical figures of merit
A series of experiments under optimal conditions were designed for obtaining the linear dynamic range (LDR), preconcentration factor (PF), determination coefficient (R2), limit of detection (LOD) and relative standard deviation (RSD). The RSDs, (C = 100 μg L−1) for seven replicate measurements were 2.5% and 3.1% for Cr and Zn, respectively. The LDR was obtained by simultaneous preconcentration of 10 mL of twelve different standard sample solutions. The LDRs were 0.5–1500 μg L−1 for Cr and Zn with an R2 of 0.997. The LODs based on CLOD = 3Sd/m (where CLOD, Sd and m are the limit of detection, standard deviation of the blank, and slope of the calibration graph, respectively) obtained were 0.20 for Cr and 0.28 μg L−1 for Zn. The preconcentration factor (PF) was defined as the ratio of concentration of analyte in the final solution to its concentration in the aqueous sample. The analytical characteristics of the proposed method are summarized in Table 6.Comparison of LL-USAEME with other methods
The results of simultaneous preconcentration and determination of Cr and Zn by the developed LL-USAEME-ICP-OES method were compared with those of the other reported methods in Table 7. As is shown, the proposed method offers a considerably more extensive LDR, a better RSD of Cr and a similar RSD for Zn compared with those of the other methods. Furthermore, the LOD for Cr and Zn are better than those of DLLME-ICP-OES and CPE-UV-Vis method, respectively.| Analyte | Method | Chelating agent | LDR (μg L−1) | LOD (μg L−1) | RSD (%) | Detection | Ref. |
|---|---|---|---|---|---|---|---|
| a Sodium diethyldithiocarbamate. b Ammonium pyrrolidinedithiocarbamate. c 2-(5-Bromo-2-pyridyazo)-5-(diethyl amino) phenol. d 1-(2-Pyridylazo)2-naphthol. e 4-(2-Pyridylazo)-resorcinol. | |||||||
| Cr | DLLME | Na-DDTC a | 1–750 | 0.27 | 3.0 | ICP-OES | 29 |
| Cr | DLLME | APDC b | 0.5–8.0 | 0.07 | 9.2 | ET-AAS | 30 |
| Cr | DLLME | PADAP c | 1.0–25 | 0.20 (ng L−1) | 6.2 | GF-AAS | 28 |
| Cr | LL-USAEME | Ligandless | 0.5–1500 | 0.20 | 2.5 | ICP-OES | This work |
| Zn | DLLME | Na-DDTC | 1–1000 | 0.55 | 2.1 | ICP-OES | 29 |
| Zn | CPE | PAN d | 2–150 | n.r. | 4.38 | UV-vis | 31 |
| Zn | CPE | PAR e | 10–700 | 1.1 | 1.7 | ICP-OES | 32 |
| Zn | LL-USAEME | Ligandless | 0.5–1500 | 0.87 | 3.1 | ICP-OES | This work |
Influence of coexisting ions
Under the obtained optimum conditions of the methods, the influence of the common coexisting ions in real water samples on the recovery of Cr and Zn were investigated. In the related experiments, 10 mL of solution containing 100 μg L−1 of each analyte with different interference-to-analyte ratios was treated according to the recommended procedure. The results in Table 8 show that the presence of common cations and anions in natural water samples has no significant effect on the determination of Cr and Zn by LL-USAEME-ICP-OES method.Validation of the method and analysis of real water samples
The accuracy of the method was tested for the determination of Cr and Zn in three different real water samples: tap, sea and mineral water. The results showed that Cr was not detectable in real water samples. In the next step, the samples were spiked with a standard mixture solution of heavy metal ions (20 μg L−1). Table 9 shows that the relative recoveries of heavy metal ions from the spiked samples are in the range of 91–109%. The results indicate that a matrix of real water had no considerable effect on the determination of heavy metal ions. Also, in order to investigate the accuracy of the presented procedure, it was applied to the determination of Cr and Zn in three different reference materials (CASS4 nearshore seawater, SLRS-4 riverine water and CRM-TMDW-500 drinking water) (Table 9). The results showed a good agreement between the analyzed and certified values.| Sample | Cr | Zn |
|---|---|---|
| a The water was taken from the University of Tehran (Iran). b Standard deviation (n = 3). c The sample was collected from the Caspian sea (Babolsar city, Mazandaran province, north of Iran). d Mineral water was prepared from Damash Guilan mineral water (Rudbar, Guilan province, north of Iran). e Not detected. f Certified reference material. | ||
| Tap watera ± S.D.b (μg L−1) | n.d.e | 53.1 ± 2.1 |
| Added (μg L−1) | 20 | 20 |
| Found ± S.D. (μg L−1) | 19.3 ± 0.6 | 71.3 ± 1.7 |
| Relative recovery (%) | 96 | 91 |
| Sea waterc ± S.D. (μg L−1) | n.d. | 76.2 ± 1.2 |
| Added (μg L−1) | 20 | 20 |
| Found ± S.D. (μg L−1) | 19.7 ± 0.3 | 98 ± 1.3 |
| Relative recovery (%) | 98 | 109 |
| Mineral water d ± S.D. (μg L−1) | n.d. | 92 ± 1.8 |
| Added (μg L−1) | 20 | 20 |
| Found ± S.D. (μg L−1) | 19.9 ± 1.8 | 110 ± 1.2 |
| Relative recovery (%) | 99 | 90 |
| CASS–4 (Nearshore Seawater) | ||
| fCertified value (μg L−1) | 0.144 ± 0.029 | 0.381 ± 0.057 |
| Added (μg L−1) | 10.00 | 10.00 |
| Found ± S.D. (μg L−1) | 10.102 ± 0.037 | 10.414 ± 0.042 |
| Recovery (%) | 99.56 | 100.38 |
| SLRS–4 (Riverine Water) | ||
| Certified value (μg L−1) | 0.33 ± 0.02 | 0.93 ± 0.10 |
| Found ± S.D. (μg L−1) | 0.34 ± 0.05 | 0.95 ± 0.08 |
| Recovery (%) | 103.03 | 102.15 |
| CRM - TMDW - 500 | ||
| Certified value (μg L−1) | 20 ± 0.1 | 70 ± 0.4 |
| Found ± S.D. (μg L−1) | 19.8 ± 0.3 | 68 ± 0.2 |
| Recovery (%) | 99.00 | 97.14 |
Conclusion
This study describes the application of an optimized LL-USAEME method coupled with an ICP-OES technique for the simultaneous determination of Cr and Zn in real water samples with the aid of chemometrics. The main parameters affecting the extraction process were investigated to identify the significant main and interaction effects by a half-fraction factorial design. The results indicated that the volume of extraction solvent, pH, salt effect and sonication time were significant. Then, response surface methodology (Box–Behnken design) was applied to achieve optimal conditions. Compared to the traditional optimization methods, experimental design provided more useful information, modeled the data with less ambiguity and helped to interpret the results in more detail. Moreover, simplicity, consumption of low volume of organic solvents, high recovery, good enrichment factor and satisfactory analytical figures of merits were the main advantages of the proposed method.References
- E. A. Takara, S. D. Pasini-Cabello, S. Cerutti, J. A. Gasquez and L. D. Martinez, J. Pharm. Biomed. Anal., 2005, 39, 735–739 CrossRef CAS.
- M. Tuzen, M. Soylak, D. Citak, H. S. Ferreira, M. G. A. Korn and M. A. Bezerra, J. Hazard. Mater., 2009, 162, 1041–1045 CrossRef CAS.
- M. Soylak, L. Elci and M. Dogan, Anal. Lett., 1997, 30, 623–631 CrossRef CAS.
- M. H. Karbasi, B. Jahanparast, M. Shamsipur and J. Hassan, J. Hazard. Mater., 2009, 170, 151–155 CrossRef CAS.
- Y. Boukraa, D. Barkat, T. Benabdellah, A. Tayeb and M. Kameche, Phys. Chem. Liq., 2006, 44, 693–700 CrossRef CAS.
- S. Saracoglu, M. Soylak, D. S. K. Peker, L. Elci, W. N. L. dos Santos, V. A. Lemos and S. L. C. Ferreira, Anal. Chim. Acta, 2006, 575, 133–137 CrossRef CAS.
- N. Tokman and S. Akman, Anal. Chim. Acta, 2004, 519, 87–91 CrossRef CAS.
- N. Dallali, M. M. Zahedi and Y. Yamini, Scientia Iranica, 2007, 14, 291–296 CAS.
- L. Xia, Y. Wu and B. Hu, J. Mass Spectrom., 2007, 42, 803–810 CrossRef CAS.
- S. Berijani, Y. Assadi, M. Anbia, M. R. M. Hosseini and E. Aghaee, J. Chromatogr., A, 2006, 1123, 1–9 CrossRef CAS.
- S. Ozcan, A. Tor and M. E. Aydin, Anal. Chim. Acta, 2009, 647, 182–188 CrossRef CAS.
- F. Pena-Pereira, I. Lavilla and C. Bendicho, Spectrochim. Acta, Part B, 2009, 64, 1–15 CrossRef.
- J. Regueiro, M. Llompart, C. Garcia-Jares, J. C. Garcia-Monteagudo and R. Cela, J. Chromatogr., A, 2008, 1190, 27–38 CrossRef CAS.
- J. F. Wu, B. R. Xiang and J. Xia, Microchim. Acta, 2009, 166, 157–162 CrossRef CAS.
- S. Ozcan, A. Tor and M. E. Aydin, Anal. Chim. Acta, 2010, 665, 193–199 CrossRef CAS.
- A. R. Fontana, R. Wuilloud, L. D. Martinez and J. C. Altamirano, J. Chromatogr., A, 2009, 1216, 147–153 CrossRef CAS.
- A. R. Fontana, S. H. Patil, K. Banerjee and J. C. Altamirano, J. Agric. Food Chem., 2010, 58, 4576–4581 CrossRef CAS.
- A. Saleh, Y. Yamini, M. Faraji, M. Rezaee and M. Ghambarian, J. Chromatogr., A, 2009, 1216, 6673–6679 CrossRef CAS.
- J. J. Ma, X. Du, J. W. Zhang, J. C. Li and L. Z. Wang, Talanta, 2009, 80, 980–984 CrossRef CAS.
- J. Regueiro, M. Llompart, E. Psillakis, J. C. Garcia-Monteagudo and C. Garcia-Jares, Talanta, 2009, 79, 1387–1397 CrossRef CAS.
- Q. H. Wu, Q. Y. Chang, C. X. Wu, H. Rao, X. Zeng, C. Wang and Z. Wang, J. Chromatogr., A, 2010, 1217, 1773–1778 CrossRef CAS.
- M. D. L. de Castro and F. Priego-Capote, Talanta, 2007, 72, 321–334 CrossRef.
- I. Lavilla, N. Cabaleiro, M. Costas, I. de la Calle and C. Bendicho, Talanta, 2009, 80, 109–116 CrossRef CAS.
- M. Jalali-Heravi, H. Parastar and H. Ebrahimi-Najafabadi, J. Chromatogr., A, 2009, 1216, 6088–6097 CrossRef CAS.
- M. Soylak, I. Narin, M.d. A. Bezerra and S. L. C. Ferreira, Talanta, 2005, 65, 895–899 CrossRef CAS.
- H. Sereshti, M. Karimi and S. Samadi, J. Chromatogr., A, 2009, 1216, 198–204 CrossRef CAS.
- C. R. T. Tarley, G. Silveira, W. N. L. dos Santos, G. D. Matos, E. G. P. da Silva, M. A. Bezerra, M. Miro and S. L. C. Ferreira, Microchem. J., 2009, 92, 58–67 CrossRef CAS.
- M. Mirzaei, M. Behzadi, N. Mahmoud-Abadi and A. Beizaei, J. Hazard. Mater., 2011, 186, 1739–1743 CrossRef CAS.
- H. Sereshti, V. Khojeh and S. Samadi, Talanta, 2011, 83, 885–890 CrossRef CAS.
- H. Chen, P. Du, J. Chen, S. H. Hu, S. Q. Li and H. L. Liu, Talanta, 2010, 81, 176–179 CrossRef CAS.
- A. Afkhami and M. Bahram, Microchim. Acta, 2006, 155, 403–408 CrossRef CAS.
- E. L. Silva, P.d.S. Roldan and M. F. Gine, J. Hazard. Mater., 2009, 171, 1133–1138 CrossRef CAS.
| This journal is © The Royal Society of Chemistry 2012 |