Validity of particle size analysis techniques for measurement of the attrition that occurs during vacuum agitated powder drying of needle-shaped particles
Peter
Hamilton
a,
David
Littlejohn
*a,
Alison
Nordon
*a,
Jan
Sefcik
b and
Paul
Slavin
c
aWestCHEM, Department of Pure and Applied Chemistry and CPACT, University of Strathclyde, 295 Cathedral Street, Glasgow, G1 1XL. E-mail: d.littlejohn@strath.ac.uk; alison.nordon@strath.ac.uk
bDepartment of Chemical and Process Engineering, University of Strathclyde, 75 Montrose Street, Glasgow, G1 1XJ
cGlaxoSmithKline, Gunnels Wood Road, Stevenage, Hertfordshire SG1 2NY
First published on 9th November 2011
Abstract
Analysis of needle-shaped particles of cellobiose octaacetate (COA) obtained from vacuum agitated drying experiments was performed using three particle size analysis techniques: laser diffraction (LD), focused beam reflectance measurements (FBRM) and dynamic image analysis. Comparative measurements were also made for various size fractions of granular particles of microcrystalline cellulose. The study demonstrated that the light scattering particle size methods (LD and FBRM) can be used qualitatively to study the attrition that occurs during drying of needle-shaped particles, however, for full quantitative analysis, image analysis is required. The algorithm used in analysis of LD data assumes the scattering particles are spherical regardless of the actual shape of the particles under evaluation. FBRM measures a chord length distribution (CLD) rather than the particle size distribution (PSD), which in the case of needles is weighted towards the needle width rather than their length. Dynamic image analysis allowed evaluation of the particles based on attributes of the needles such as length (e.g. the maximum Feret diameter) or width (e.g. the minimum Feret diameter) and as such, was the most informative of the techniques for the analysis of attrition that occurred during drying.
Introduction
Powder drying is a common unit process in pharmaceutical manufacturing and is one of the final steps in active pharmaceutical ingredient (API) production.1 The impact of the drying process on crystal particulate properties is of great importance as dissolution rate, bioavailability, and content and dose uniformity can all be affected by a change in the particle size characteristics of a given powder product.2 Complications can arise during drying processes owing to particle attrition, agglomeration and over drying which can lead to chemical degradation, and hydrate or solvate changes. The processes which lead to particle attrition have been studied extensively by Ghadiri et al.,3–8 and the impact of powder drying on particulate properties has also been investigated.6,9–13 Various procedures have been devised to monitor solvent removal in real-time, including methods based on near infrared spectrometry and mid infrared spectrometry.14–16 In a previous study,9 methods were developed to monitor the drying of cellobiose octaacetate (COA) directly in a vacuum agitated drier using non-invasive in situRaman spectrometry. A design of experiments (DoE) approach was used to investigate the effects of process variables on the drying time and degree of attrition suffered by the needle-shaped COA particles. Off-line particle size measurements (volume distribution curves and d(0,5) values) based on laser diffraction (LD) were made to assess the degree of attrition and permit comparison with the trends revealed by the Raman drying curves. Although the particle size data proved helpful in interpreting the changes to the Raman spectra, no attempt was made to assess the efficacy of LD measurements for particle size analysis of the COA needles.LD has known limitations for anisotropic particles, where the analysis of irregular-shaped particles can lead to inaccuracies in the particle size distribution. The fundamental influence of particle shape on LD measurements has featured extensively in the literature.17–20 Gabas et al. used LD to analyse the surface area weighted mean size for three common particle geometries of known shape and size: cubic, tablet (platelets), and cylinders.19 The LD data analysis software, strictly valid for spheres, considerably underestimated the surface areas of tablets and cylinders by 31% and 70%, respectively. Other known problems include multiple scattering effects.21 Although the issues associated with LD are well documented, they are more than often compensated by the simplicity of use of the instruments and as such, LD is a popular choice for particle analysis.22–26
Focused beam reflectance measurement (FBRM) is another light scattering technique, where, backscattered light from a circulating laser beam focused just outside a sapphire window is measured (from a probe immersed in a suspension of particles). The backscatter is generated by the laser light being reflected from particles near the measurement window, and the duration of the backscattered light signal is measured and translated to give a chord length distribution (CLD) for the particles. All particles passing in front of the probe window are thus analysed in terms of their CLD, irrespective of shape.27 However, although the CLD generated is related to, it is not a direct measurement of the particle size distribution (PSD).28 Also, as in LD, for anisotropic particles, well known issues exist and the chord length measured is dependent on the orientation of the particle as it passes through the laser beam.29–32 Nonetheless, FBRM has featured extensively in the pharmaceutical particle analysis literature, particularly for crystallisation monitoring.33–37
Dynamic image analysis is an alternative procedure to light scattering techniques, where a stroboscopic light source is used to “arrest” particle motion while a fast camera records digital images of the particles. Proprietary algorithms are then used to analyse the images based on user defined statistics. Dispersion of the particles can be achieved either in solution as with LD and FBRM, or using compressed air to generate an aerosol that passes by the imaging window. There are many pharmaceutical examples in the literature where image analysis (both traditional and dynamic) has been applied to powders.38–44 Yu et al. performed a comparison of LD and dynamic image analysis for rod-shaped and spherical microcrystalline cellulose particles.45 The authors found that dynamic image analysis and LD measurements were in good agreement for spherical particles, but not for rod-shaped particles.
In this study, samples of COA that had been subjected to different drying conditions (agitation strategy, % solvent loss on drying (% SLOD) and oil jacket temperature) were analysed by LD, FBRM and dynamic image analysis (Sympatec QICPIC) to assess their relative merits for the study of attrition of needle-shaped particles. The drier operating conditions were altered to ensure that a range of particle sizes would be produced and this was confirmed using imaging microscopy. Various particle size fractions of granular microcrystalline cellulose (Avicel) were also analysed by each of the techniques for comparison with the COA results. Avicel was selected as it has a granular shape and was easy to obtain material of known particle size ranges. The study demonstrates the importance of image analysis for quantitative analysis of needle length, which is shown to be the critical particle attribute for needle-shaped particles.
Experimental
Materials
Avicel PH101 microcrystalline cellulose and cellobiose octaacetate (COA) were obtained from GSK. The Avicel was sieved in 10 cm diameter brass-pan sieves (Endecotts Ltd, UK) using a mechanical sieve shaker to produce the following size fractions: <38, 38–53, 53–106, 106–150, and 150–212 μm.Drying procedure
The design of the drier for these experiments was based on process scale agitated filter driers and has an internal diameter of 15 cm. The agitator has two angled retreat blades positioned at 180°. The motor was an IKA RW 20 digital (IKA works, Wilmington, USA) positioned at 90° to the vessel and drove the agitator through a 10![[thin space (1/6-em)]](https://www.rsc.org/images/entities/char_2009.gif) :
:![[thin space (1/6-em)]](https://www.rsc.org/images/entities/char_2009.gif) 1 gear box at a mixing speed of 20 rpm. The vessel was made of glass with an oil jacket that was heated to either 40 or 60 °C during the experiments. The base of the drier was connected to a vacuum pump and the vacuum was held between 50–100 mbar throughout drying; this was monitored using a Pirani gauge (Edwards, Crawley, UK) in the line. Also in the vacuum line was a reservoir to collect excess solvent and a cold finger to trap any solvent before reaching the pump. In a typical experiment, 300 g of COA was placed in the drier and the agitator speed was set to 20 rpm. The vessel lid was attached and sealed. Methanol was then added through a port in the lid of the vessel before the powder was continuously agitated for two minutes to mix the solvent well with the particles. This was a convenient way to dose the drier with powder and generate mixtures of different wetness. The port was then sealed and vacuum was subsequently applied. For continuously agitated drying experiments, the powder was agitated at 20 rpm without interruption, whereas, for intermittently agitated drying experiments there was an initial 2 min period of agitation before the powder was dried for 30 min without agitation. The impeller was then turned on for 1 min to agitate the particles again followed by alternate 30 min and 1 min periods without and with agitation until the particles were dry; this was indicated by the reduction of the methanol signal in Raman spectra. A sample of COA was then removed from the drier for particle size analysis. The combinations of drying conditions used for the different experiments are given in Table 1.
1 gear box at a mixing speed of 20 rpm. The vessel was made of glass with an oil jacket that was heated to either 40 or 60 °C during the experiments. The base of the drier was connected to a vacuum pump and the vacuum was held between 50–100 mbar throughout drying; this was monitored using a Pirani gauge (Edwards, Crawley, UK) in the line. Also in the vacuum line was a reservoir to collect excess solvent and a cold finger to trap any solvent before reaching the pump. In a typical experiment, 300 g of COA was placed in the drier and the agitator speed was set to 20 rpm. The vessel lid was attached and sealed. Methanol was then added through a port in the lid of the vessel before the powder was continuously agitated for two minutes to mix the solvent well with the particles. This was a convenient way to dose the drier with powder and generate mixtures of different wetness. The port was then sealed and vacuum was subsequently applied. For continuously agitated drying experiments, the powder was agitated at 20 rpm without interruption, whereas, for intermittently agitated drying experiments there was an initial 2 min period of agitation before the powder was dried for 30 min without agitation. The impeller was then turned on for 1 min to agitate the particles again followed by alternate 30 min and 1 min periods without and with agitation until the particles were dry; this was indicated by the reduction of the methanol signal in Raman spectra. A sample of COA was then removed from the drier for particle size analysis. The combinations of drying conditions used for the different experiments are given in Table 1.
| Agitation method | Oil T/°C | % SLODa | Drying time/h | Sample number |
|---|---|---|---|---|
| a % SLOD is defined as the amount of solvent added to the COA as a percentage of the initial weight of powder. | ||||
| continuous | 40 | 100 | 2.15 | 1 |
| continuous | 60 | 50 | 1.32 | 2 |
| intermittent | 60 | 100 | 2.30 | 3 |
| intermittent | 60 | 50 | 2.23 | 4 |
| intermittent | 40 | 50 | 2.62 | 5 |
Particle size analysis
Results and discussion
The drying conditions listed in Table 1 caused different degrees of particle attrition as indicated by the microscope images shown in Fig. 1. At the conclusion of drying the particles were analysed by each technique and the results compared to those obtained for the different size fractions of Avicel.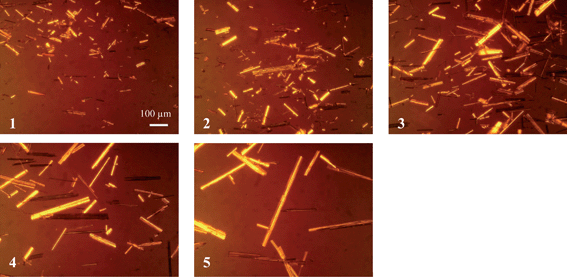 | ||
| Fig. 1 Microscopy images of COA (magnification factor of ×150) showing increasing needle length (numbered according to sample number assigned in Table 1). | ||
Laser diffraction
Fig. 2a and b show the volume distributions obtained from LD for the sieved fractions of Avicel and experimentally obtained fractions of COA, respectively. Fig. 2a shows that there were distinctive PSD curves for each size fraction of Avicel, which displayed good agreement between the mode of each curve and the known size range. In some of the samples, the distribution was skewed towards smaller sizes which can be attributed to a high number of fines present in the samples. These fines can arise from incomplete sieving of the samples or from small fragments breaking off from larger particles. When volume based distributions are considered, the data are weighted towards large particles where one bigger particle has the volume of many smaller ones, and thus can sometimes lead to multi-modal distribution curves. This is illustrated in the data for COA where a tri-modal distribution is obtained. In the smallest fraction, there is a mode centred at ∼20 μm which can be attributed to the laser beam being diffracted predominantly by the needle width. Also, in the data for the smallest sample, a second mode is observed at around 90 μm that is likely a result of diffraction by the length dimension of short needles. As needle length is increased, this mode becomes the most prominent one in the PSD for larger particles, as in these samples there is a higher number of longer needles so the probability of diffracting the laser beam by length also increases. For the largest particles, there is also a third mode (at around 800 μm), which is due to the length of the longest needles observed. The mode at 800 μm is most likely caused by a smaller number of particles which nevertheless, contribute a significant volume, especially for samples 4 and 5. It has been shown previously that non-isometric particles such as needles (or platelets) with Guinier-like regimes have distinct scattering patterns corresponding to both maximum and minimum particle dimensions.46,47 Therefore, when the LD instrument software fitted the scattering data measured for needles from this data set using the scattering patterns of spheres, it follows that the modes in the resulting PSDs corresponded to both the maximum and minimum dimensions of the particles actually present in measured samples. In the case of granular Avicel, however, the distribution was simpler to understand as an increase in particle size resulted in a positive shift in the mono-modal distribution which signified greater average particle size.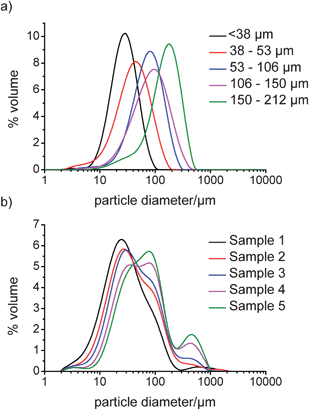 | ||
| Fig. 2 LD obtained volume distribution plots for a) sieved fractions of Avicel and b) dried COA samples. | ||
The data presented here shows that LD measurements are suitable for analysis of both granular and needle-shaped particles. However, in order to interpret the distributions obtained for needle-shaped particles, it is important to understand how needle-shaped particles are altered by attrition and the effects that these changes have on the volume based particle size distribution. A limitation of LD is that particles that are not spherical or granular will diffract the laser beam depending on the average orientation of the particles in the beam. In the case of needles, the probability of diffracting the beam based on needle length rather than width is small and, therefore, the effect on the data generated by differing needle lengths could be expected to be small. However, as the data suggests in Fig. 2, this is not entirely the case as the distribution does shift with increasing size and so an averaging effect based on the needle populations is observed.
FBRM
The chord length distributions for sieved samples of Avicel and the experimentally obtained fractions of COA are shown in Fig. 3a and b, respectively. The FBRM data for Avicel shows an increase in chord length distribution (CLD) with increasing particle size. However, a reduction in the total number of counts was also observed as particle size was increased. For this study, slurries of 2% w/w were prepared; a 2% w/w sample of e.g. <38 μm particles will have many more particles than an equivalent sample of 150–212 μm particles. Therefore, the signal reduction observed was due to the lower number of particles in the bigger size fractions of Avicel and COA. The data for COA also demonstrates a general increase in chord length distribution as the particle size of the samples was increased. The un-weighted CLDs obtained have median values that are generally smaller than those of the other techniques, however, this is expected when the basis of the measurement is considered, especially for the needle-shaped particles. Here, the dimension that is predominantly measured is through the shortest axis (the width), and this is due to the low probability of the particle being positioned in the orientation where the circulating laser beam passes along the length dimension.29,32 The increase in CLD as needle length was increased suggested that needle width also increases as needle length increases and this hypothesis is confirmed when image analysis is discussed later. Nonetheless, the FBRM measurements shown here demonstrate that changes in particle size for both granular and needle-shaped particles can be observed.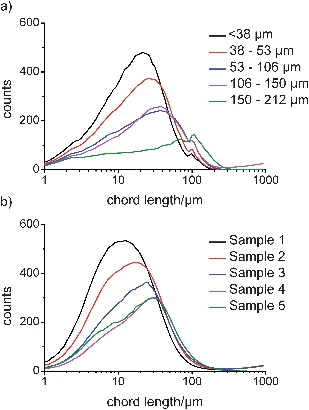 | ||
| Fig. 3 FBRM un-weighted number chord length distributions for a) sieved fractions of Avicel and b) dried COA samples. | ||
QICPIC
Digital imaging allows analysis of particles based on a variety of parameters. In this study, three measures were used: the equivalent projected circle (EQPC) diameter, which gives the diameter of a sphere that has the same 2-dimensional area as the projected particle in the recorded image; the maximum Feret (Feret Max) diameter, which is the longest distance between two parallel tangents on opposite sides of the projected particle; and the minimum Feret (Feret Min) diameter, which is the shortest distance between two parallel tangents on opposite sides of the projected particle. These are shown schematically in Fig. 4. The EQPC volume distribution plots for Avicel and COA are shown in Fig. 5a and b, respectively, and the Feret Max data are shown in Fig. 6a and b. Furthermore, the median values, D50, obtained for each sample are given in Table 2, which includes the LD d(0,5) data for comparison.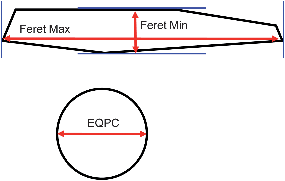 | ||
| Fig. 4 Schematic representations of the size descriptions used for image analysis of the COA and Avicel data sets. The EQPC diameter is estimated as the diameter of a sphere with the same 2-dimensional area as the projected particle in the recorded image. The Feret Max and Feret Min diameters are the longest and shortest distances, respectively, between two parallel tangents on opposite sides of the projected particle. | ||
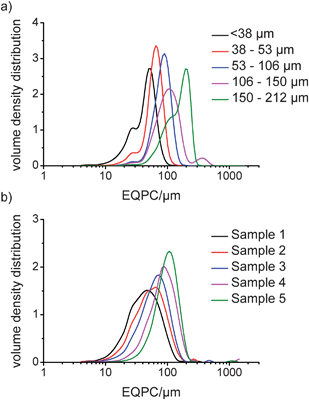 | ||
| Fig. 5 QICPIC EQPC volume distribution data for a) sieved fractions of Avicel and b) dried samples of COA. | ||
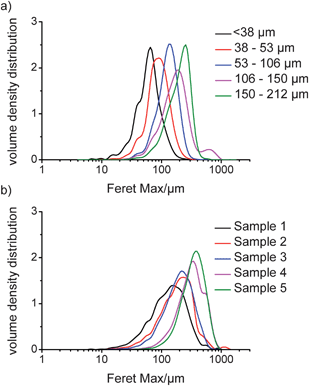 | ||
| Fig. 6 QICPIC Feret Max volume distribution data for a) sieved fractions of Avicel and b) dried samples of COA. | ||
From Table 2, the QICPIC EQPC D50 and LD d(0,5) values of COA and Avicel increase for the different size fractions, although the QICPIC EQPC diameters are systematically higher than the equivalent LD measurements. With QICPIC, the EQPC value given for each particle is equal to the diameter of a spherical particle with the same projected area as the particle measured (Fig. 4), whereas for LD measurements, the diameter given is that of a spherical particle with the same diffraction pattern as the measured particle. Avicel was included in the study as it was expected to have a granular, less asymmetric particle shape. While spherical particles should have similar D50 values for EQPC and Feret Max, these would increasingly differ with increasing asymmetry. The results in Table 2 show that for all particle size fractions the Feret Max D50 value for Avicel is greater than that of the D50 for EQPC which indicates anisotropic character. This explains the lack of quantitative agreement between LD and QICPIC measurements for Avicel and is confirmed by the image of Avicel particles as shown in Fig. 7. A significant advantage of digital imaging techniques over laser scattering is the ability to investigate the particle size and shape data more thoroughly than is possible from the given volume distribution and associated statistics. By analysis of the individual particles in the QICPIC particle gallery, the shape of each particle measured can be analysed, and further, filters can be set in order to probe user defined problems such as contamination or investigation of a single particle shape in a blend.
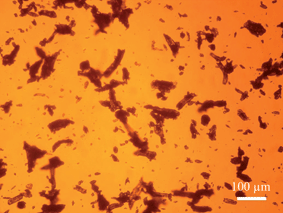 | ||
| Fig. 7 Microscope image of Avicel (106–150 μm fraction) showing the anisotropic character of the particles (magnification factor of ×150). | ||
With image analysis, orientation is less of a factor as the area used for the EQPC calculation is based on the number of pixels taken up on the camera for any given particle. However, the images recorded are 2-dimensional representations of 3-dimensional objects, and thus an assumption must be made that the measured particles were parallel to the imaging CCD whilst being recorded. What is evident, however, is that the use of the EQPC diameter is not ideal for needles and that a more appropriate diameter such as Feret Max should be used. When the EQPC distribution data for COA is compared with the Feret Max distribution data, a significant shift to larger dimensions is observed in the latter. This is because the Feret Max diameter is the longest dimension of a measured particle and does not involve a calculation to give an equivalent diameter of a spherical particle as with EQPC measurements. Therefore, for changes in particles such as needles, where the shortest diameter (Feret Min) does not vary significantly from particle to particle, Feret Max gives the best description of the distribution. This demonstrates that the QICPIC EQPC, LD PSD and FBRM CLD data should only be considered to give a qualitative description of any changes to needle-shaped particles that occur during drying (or any other particulate processes) as they are inaccurate representations of the actual needle lengths.
The Feret Min diameter was also investigated for the COA particles, however, a potential limitation of digital image analysis was encountered when this was performed. Overlap of few needle-shaped particles (with respect to the total particle count) can have a significant effect on the distribution obtained when the volume distribution is considered. When overlap occurs, the dimension which is actually the Feret Max of the shorter needle is measured as the Feret Min of the larger one, resulting in a significantly increased value. When the Feret Max dimension is evaluated, the shorter needle is disregarded by the analysis software and thus is not problematic. To remove overlapping particles from affecting the Feret Min distribution, filters can be applied so that projected particles with a Feret Min greater than a user defined dimension are disregarded resulting in a more representative distribution. However, in order to apply these filters with confidence, a pseudo Bayesian approach must be applied. The use of Bayesian statistics applies prior knowledge to a data set in order to determine the probability of a given result; in this case, the prior knowledge applied is that the needle width is typically less than 100 μm (concluded from imaging microscopy and previous imaging experiments). Furthermore, with QICPIC image analysis, one pixel on the CCD camera is equal to 1 μm; it follows that a threshold should be determined for the analysis of Feret Min data that constitutes the minimum number of filled pixels required to be considered a particle. Therefore, a second filter was added to the analysis of Feret Min data that removed particles with a Feret Min diameter less that 5 μm (corresponding to 5 pixels in width).
The filtered Feret Min distributions from QICPIC were compared to the CLD distributions obtained by FBRM. Due to the orientation of needle-shaped particles for FBRM measurements, the un-weighted CLD should, in theory, be comparable to the QICPIC Feret Min data for COA. For direct comparison, the number distribution for the QICPIC data was calculated rather than the volume distribution. The number distributions for the Feret Min COA data are shown in Fig. 8, followed by the D50 data for both COA and Avicel in Table 3. The Feret Min D50 data for the COA needles showed very good agreement with the un-weighted FBRM CLD D50 data. This agrees with the hypothesis that average needle thickness increases with increasing needle length for COA and shows that FBRM data in fact provides a good measure of the needle thickness when samples are suspended in solution. Thus, the Feret Min data for COA needles shows that the FBRM CLD can potentially be used as an indirect qualitative measurement of average needle length provided the needle thickness increases with needle length (i.e. constant aspect ratio) in the particulate system being evaluated (like COA). For the granular-shaped Avicel particles, a similar trend is observed for the D50 from FBRM and Feret Min analysis of QICPIC data; however the values do not show as good an agreement as was observed with the COA particles. For needles, FBRM predominantly cuts through the shortest dimension of the particles due to the average orientation they adopt relative to the probe when in a slurry. For granular particles, however, the FBRM laser beam passes through a wide range of chords of the particle with significant probability. This includes chords that are smaller than the Feret Min from up to and including the Feret Max dimension from QICPIC.
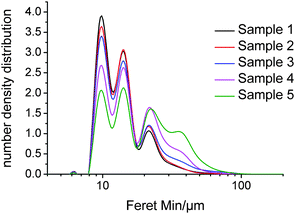 | ||
| Fig. 8 QICPIC Feret Min number distribution data for the dried samples of COA. | ||
| COA | Avicel | ||||
|---|---|---|---|---|---|
| Sample number | FBRM D50/μm | Feret Min D50/μm | Particle size fraction/μm | FBRM D50/μm | Feret Min D50/μm |
| 1 | 12 | 13 | <38 | 17 | 15 |
| 2 | 12 | 13 | 38–53 | 19 | 21 |
| 3 | 14 | 14 | 53–106 | 24 | 33 |
| 4 | 18 | 15 | 106–150 | 25 | 41 |
| 5 | 22 | 19 | 150–212 | 35 | 47 |
Conclusions
The study has demonstrated the advantages of dynamic image analysis for quantitative measurement of the particle size of needle-shaped compounds such as COA, with the Feret Max dimension the best indicator of needle length. Laser diffraction and focused beam reflectance measurements could be used qualitatively to study changes in the particle size of needle crystals during drying, but were limited in the information on needle length that could be derived. The extent of attrition of COA particles during drying depended on the conditions in the vacuum drier, with continuous agitation of wetter material producing shorter particles than intermittent drying of material with a lower solvent loading.Acknowledgements
The authors would like to thank GSK, Clairet Scientific and the University of Strathclyde EPSRC CTA scheme for funding for the project and Sympatec GMBH for allowing the samples to be analysed with QICPIC. AN thanks the Royal Society for the award of a University Research Fellowship.References
- Z. Q. Yu, J. W. Chew, P. S. Chow and R. B. H. Tan, Chem. Eng. Res. Des., 2007, 85, 893–905 CrossRef CAS.
- B. Shekunov, P. Chattopadhyay, H. Tong and A. Chow, Pharm. Res., 2007, 24, 203–227 CrossRef CAS.
- M. Ghadiri, Z. Ning, S. J. Kenter and E. Puik, Chem. Eng. Sci., 2000, 55, 5445–5456 CrossRef CAS.
- M. Ghadiri, K. R. Yuregir, H. M. Pollock, J. D. J. Ross and N. Rolfe, Powder Technol., 1991, 65, 311–320 CrossRef CAS.
- M. Ghadiri and Z. Zhang, Chem. Eng. Sci., 2002, 57, 3659–3669 CrossRef CAS.
- C. L. Hare, M. Ghadiri, R. Dennehy and A. Collier, in Powders and Grains 2009, ed. M. Nakagawa and S. Luding, Amer Inst Physics, Melville, 2009, vol. 1145, pp. 851–854 Search PubMed.
- Z. M. Ning and M. Ghadiri, Chem. Eng. Sci., 2006, 61, 5991–6001 CrossRef CAS.
- Z. Zhang and M. Ghadiri, Chem. Eng. Sci., 2002, 57, 3671–3686 CrossRef CAS.
- P. Hamilton, D. Littlejohn, A. Nordon, J. Sefcik, P. Slavin, P. Dallin and J. Andrews, Analyst, 2011, 136, 2168–2174 RSC.
- P. K. Kom, W. Cook and E. Kougoulos, Org. Process Res. Dev., 2011, 15, 360–366 CrossRef CAS.
- E. Kougoulos, C. E. Chadwick and M. D. Ticehurst, Powder Technol., 2011, 210, 308–314 CrossRef CAS.
- A. Lekhal, K. P. Girard, M. A. Brown, S. Kiang, B. J. Glasser and J. G. Khinast, Powder Technol., 2003, 132, 119–130 CrossRef CAS.
- A. Lekhal, K. P. Girard, M. A. Brown, S. Kiang, J. G. Khinast and B. J. Glasser, Int. J. Pharm., 2004, 270, 263–277 CrossRef CAS.
- J. Tewari, V. Dixit and K. Malik, Sens. Actuators, B, 2010, 144, 104–111 CrossRef.
- J. Burgbacher and J. Wiss, Org. Process Res. Dev., 2008, 12, 235–242 CrossRef CAS.
- J. Parris, C. Airau, R. Escott, J. Rydzak and R. Crocombe, Spectroscopy, 2005, 20, 34–41 CAS.
- H. Muhlenweg and E. D. Hirleman, Part. Part. Syst. Charact., 1998, 15, 163–169 CrossRef.
- Z. Ma, H. G. Merkus, J. G. A. E. de Smet, C. Heffels and B. Scarlett, Powder Technol., 2000, 111, 66–78 CrossRef CAS.
- N. Gabas, N. Hiquily and C. Laguérie, Part. Part. Syst. Charact., 1994, 11, 121–126 CrossRef.
- S. Endoh, Y. Kuga, H. Ohya, C. Ikeda and H. Iwata, Part. Part. Syst. Charact., 1998, 15, 145–149 CrossRef CAS.
- E. D. Hirleman, Part. Part. Syst. Charact., 1988, 5, 57–65 CrossRef CAS.
- A. P. Tinke, A. Carnicer, R. Govoreanu, G. Scheltjens, L. Lauwerysen, N. Mertens, K. Vanhoutte and M. E. Brewster, Powder Technol., 2008, 186, 154–167 CrossRef CAS.
- A. P. Tinke, K. Vanhoutte, R. De Maesschalck, S. Verheyen and H. De Winter, J. Pharm. Biomed. Anal., 2005, 39, 900–907 CrossRef CAS.
- A. P. Tinke, K. Vanhoutte, F. Vanhoutte, M. De Smet and H. De Winter, Int. J. Pharm., 2005, 297, 80–88 CrossRef CAS.
- A. Hagsten, C. Casper Larsen, J. Møller Sonnergaard, J. Rantanen and L. Hovgaard, Powder Technol., 2008, 183, 213–219 CrossRef CAS.
- N. Stevens, J. Shrimpton, M. Palmer, D. Prime and B. Johal, Meas. Sci. Technol., 2007, 18, 3697–3706 CrossRef CAS.
- E. Kougoulos, A. G. Jones, K. H. Jennings and M. W. Wood-Kaczmar, J. Cryst. Growth, 2005, 273, 529–534 CrossRef CAS.
- W. Yu and K. Erickson, Powder Technol., 2008, 185, 24–30 CrossRef CAS.
- A. Vaccaro, J. Sefcik and M. Morbidelli, Part. Part. Syst. Charact., 2007, 23, 360–373 CrossRef CAS.
- M. Z. Li and D. Wilkinson, Chem. Eng. Sci., 2005, 60, 3251–3265 CrossRef CAS.
- M. Z. Li, D. Wilkinson and K. Patchigolla, Chem. Eng. Sci., 2005, 60, 4992–5003 CrossRef CAS.
- N. K. Nere, D. Ramkrishna, B. E. Parker, W. V. Bell and P. Mohan, Ind. Eng. Chem. Res., 2006, 46, 3041–3047 CrossRef.
- C. Lindenberg, M. Krättli, J. Cornel, M. Mazzotti and J. Brozio, Cryst. Growth Des., 2009, 9, 1124–1136 CAS.
- Z. Q. Yu, P. S. Chow and R. B. H. Tan, Org. Process Res. Dev., 2008, 12, 646–654 CrossRef CAS.
- S. G. S. Cesur, Cryst. Res. Technol., 2008, 43, 720–728 CrossRef CAS.
- D. O'Grady, B. O'Sullivan, J. Schoell, T. Redman and M. Barrett, Chimica Oggi-Chemistry Today, 2008, 26, 22–24 Search PubMed.
- X. S. Liu, D. Sun, F. Wang, Y. J. Wu, Y. Chen and L. H. Wang, J. Pharm. Sci., 2011, 100, 2452–2459 CrossRef CAS.
- S. Almeida-Prieto, J. Blanco-Mendez and F. J. Otero-Espinar, J. Pharm. Sci., 2004, 93, 621–634 CrossRef CAS.
- S. Almeida-Prieto, J. Blanco-Mendez and F. J. Otero-Espinar, J. Pharm. Sci., 2006, 95, 348–357 CrossRef CAS.
- C. Andres, P. Bracconi, P. Reginault, P. Blouquin, M. H. Rochat and Y. Pourcelot, Int. J. Pharm., 1998, 167, 129–138 CrossRef CAS.
- N. Laitinen, O. Antikainen, J. P. Mannermaa and J. Yliruusi, Pharm. Dev. Technol., 2000, 5, 171–179 CrossRef CAS.
- N. Laitinen, O. Antikainen, J. Rantanen and J. Yliruusi, J. Pharm. Sci., 2004, 93, 165–176 CrossRef CAS.
- N. Laitinen, O. Antikainen and J. Yliruusi, Eur. J. Pharm. Sci., 2002, 17, 217–227 CrossRef CAS.
- A. Realpe and C. Velazquez, Powder Technol., 2003, 134, 193–200 CrossRef CAS.
- W. L. Yu and B. C. Hancock, Int. J. Pharm., 2008, 361, 150–157 CrossRef CAS.
- R. Fartaria, N. Javid, R. A. Pethrick, J. J. Liggat, J. Sefcik and M. B. Sweatman, Soft Matter, 2011 Search PubMed.
- O. Glatter and O. Kratky, Small angle X-ray scattering, Academic Press, London , 1982 Search PubMed.
| This journal is © The Royal Society of Chemistry 2012 |
