Injection port silylation of γ-hydroxybutyrate and trans-hydroxycrotonic acid: Conditions optimisation and characterisation of the di-tert-butyldimethylsilyl derivatives by GC-MS
Mathieu Pierre
Elie
*a,
Mark G.
Baron
a and
Jason W.
Birkett
b
aSchool of Life Science, University of Lincoln, Brayford Pool, Lincoln, LN6 7TS, UK. E-mail: melie@lincoln.ac.uk; Fax: (+0044) 1522 886842
bLiverpool John Moore University, Faculty of Science, James Parsons Building, Byrom Street, Liverpool, L3 3AF, UK
First published on 14th November 2011
Abstract
Silylation is usually carried out on γ-hydroxybutyrate (GHB) for its analysis by Gas Chromatography/Mass Spectrometry (GCMS) and requires potentially long incubation times before injection during which the derivatisation reagent and derivatives (such as trimethyl-silyl compounds) can hydrolyse. Moreover, alternative internal standards (IS) are often useful depending on sample matrices, extraction/purification procedures, commercial availability and price. This study evaluated the possibility of silylating GHB with an injection port derivatisation procedure using N-methyl-N-[tert-butyldimethyl-silyl]trifluoroacetimide (MTBSTFA) with 1% tert-butyldimethylchlorosilane (TBCS) as the derivatisation reagent, producing di-tert-butyldimethyl-silyl derivatives as a novel means of analyzing GHB. In parallel, trans-hydroxycrotonic acid (t-HCA) was investigated as a potential IS for GHB quantification. Analyses were carried out with a temperature programmable injector and the GHB(t-BDMS)2 and t-HCA(t-BDMS)2 derivatives were successfully produced, characterised and derivatisation conditions optimised. t-HCA behaved very similarly to GHB through the derivatisation processes and was used as the IS for the determination of urinary endogenous GHB concentrations in human subjects where the method showed a limit of detection of 0.049 μg mL−1, a limit of quantification of 0.162 μg mL−1, and a limit of confirmation of 1.33 μg mL−1, suitable for toxicological GHB concentration determination.
Introduction
γ-hydroxybutyrate (GHB) is a class C, schedule 4.1 substance in the Misuse of Drugs Act in the United Kingdom and schedule I in the Control Substance Act in the United States of America. Its precursor γ-butyrolactone (GBL), which metabolises into GHB after ingestion,1 was unscheduled until December 2009 when it became a class C substance in the UK while remaining on the list I chemicals in the USA since 2000. GHB is a central nervous system depressant and was originally designed and used for its anaesthetic capacity. However it is well known to be used in drug facilitated sexual assaults and robbery cases. Moreover, GHB synthesis from GBL is simple which makes its clandestine production difficult to prevent.Chemically, GHB is a small polar molecule (104 Da) and many analytical methods have been reported for its determination in biological samples.2–10 When analysed by gas chromatography mass spectrometry (GCMS), GHB is typically silylated into GHB di-trimethylsilyl derivatives: GHB(TMS)2 for several reasons. First, if injected underivatised, it would dehydrate in the injector port and intra-esterify into GBL.11 Secondly, its polarity would induce poor quality chromatography while the non-polar GHB derivatives can be separated efficiently. Finally, being a small molecule, there is a need to increase the complexity of its mass spectrum in order to improve the confidence in identification, confirmation and quantification for forensic purposes.
Silylation procedures invariably require incubation times ranging from 20 min to 2 h at temperatures ranging from 60 to 120 °C after the analytes have been exposed to the derivatisation agent prior to injection. Potential water condensation in the vessels used for the reaction before injection can be problematic because the newly formed alkoxysilane functional group (C–O–Si) can be hydrolysed. Di-tert-butyldimethylsilyl derivatives (t-BDMS)2 have been reported far less susceptible to hydrolysis than the classic (TMS)2 derivatives12 because the bulkiness of the tert-butyldimethylsilyl group hinders the access of reagents or solvents to the reactive centre on the silicon.
Injection port silylation (IPS) is a technique which allows the derivatisation reaction to occur within the injector port of the gas chromatograph and has the double advantage of greatly speeding-up the analytical process and cancelling the potential degradation of the derivatives during the time between silylation and injection.13–16 However concern might be that the dehydration speed of the GHB into GBL could subdue the GHB derivative production in the high temperature environment of the injector. Nonetheless, such temperatures are required to vaporise the derivatives and the use of a temperature programmable injector would allow timely control of the temperature throughout the derivatisation processes.
Finally, several internal standards (IS) have been utilised to quantify GHB such as GHB-deuterium6 (GHB-d6) and 2-hydroxycaproic acid.2,5–9,16,17Deuterium standards are typically considered best for quantification with mass spectrometry detection because their chemical behaviour is almost identical to the analyte of interest making them perfect for complex extraction and purification procedures. However, as well as being costly, GHB-d6 is solely commercially available in ampoules dissolved in methanol which is unsuitable for direct silylation purposes because the derivatisation agent would be consumed silylating the solvent. It is also problematic to use for the analysis of toxicological samples requiring purification by liquid–liquid extraction (LLE) because methanol could allow immiscible phases (such as urine and ethyl acetate) to mix depending on volume added. The GHB-d6 solution can be evaporated to dryness and reconstituted in suitable solvent for LLE and silylation but it lengthens the analysis time and can introduce quantification errors if the recovery is inconsistent. 2-hydroxycaproic acid is a six-carbon straight chain carboxylic acid with a hydroxyl group on the α carbon presenting a different chemical configuration and carbon chain length to GHB.
trans-4-hydroxycrotonic acid (t-HCA) is a potential internal standard for GHB quantification. t-HCA is an agonist of GHB and binds the GHB receptor with higher affinity than GHB itself.18,19 It is chemically very similar to GHB, a π bond between the α and the β carbons being the only difference. It is available as a solid which dissolves in dimethylsulfoxide (DMSO) which will not consume the silylation agent nor interfere with the derivatisation mechanics.
This study investigates the IPS production of GHB and t-HCA (t-BDMS)2 derivatives using N-methyl-N-[tert-butyldimethyl-silyl]trifluoroacetimide (MTBSTFA) with tert-butyldimethylchlorosilane (TBCS) (99![[thin space (1/6-em)]](https://www.rsc.org/images/entities/char_2009.gif) :
:![[thin space (1/6-em)]](https://www.rsc.org/images/entities/char_2009.gif) 1) as the derivatisation agent within a temperature programmable injector and its application to the determination of urinary endogenous GHB concentration. This presents a novel method for the analysis of GHB.
1) as the derivatisation agent within a temperature programmable injector and its application to the determination of urinary endogenous GHB concentration. This presents a novel method for the analysis of GHB.
Experimental
Chemicals and sample preparation
GHB sodium salt, n-hexadecane and N-methyl-N-[tert-butyldimethyl-silyl]trifluoroacetimide with tert-butyldimethylchlorosilane (99![[thin space (1/6-em)]](https://www.rsc.org/images/entities/char_2009.gif) :
:![[thin space (1/6-em)]](https://www.rsc.org/images/entities/char_2009.gif) 1) were purchased from Sigma-Aldrich (Gillingham, UK); DMSO, acetonitrile and ethyl acetate from Fisher Scientific (Loughborough, UK); and t-HCA from Tocris Bioscience (Avonmouth, UK). All chemicals were of analytical grade or higher. Injection solutions were prepared in 11 mm clear crimp top vials fitted with 200 μL inserts and capped with 11 mm crimp seals with PTFE from Perkin Elmer (Seer Green, UK).
1) were purchased from Sigma-Aldrich (Gillingham, UK); DMSO, acetonitrile and ethyl acetate from Fisher Scientific (Loughborough, UK); and t-HCA from Tocris Bioscience (Avonmouth, UK). All chemicals were of analytical grade or higher. Injection solutions were prepared in 11 mm clear crimp top vials fitted with 200 μL inserts and capped with 11 mm crimp seals with PTFE from Perkin Elmer (Seer Green, UK).
Solutions for injections consisted of 50 μL of GHB working solution, 50 μL of t-HCA working solution, 50 μL of MTBSTFA with 1% TBCS, and 50 μL of n-C16 working solution for a total of 200 μL. The vial was vortexed for 15 s before loading onto the GCMS auto-sampler waiting for analysis. Ethyl acetate was selected as a solvent for n-C16 because it facilitates the dissolving of MTBSTFA and DMSO which are normally immiscible. Ethyl acetate does not participate nor interfere with the derivatisation processes.
1.5 mL polypropylene micro-tube (Sarstedt, Leicester, UK) were loaded with 300 μL urine and 100 μL of 10 μg mL−1t-HCA aqueous solution (equivalent to 1 μg t-HCA added). Calibrators were prepared by fortifying 300 μL urine of one of the volunteer with varying volumes of 100 μg mL−1 aqueous GHB solution to obtain a range of 0.05 to 0.5 μg of GHB added before addition of 100 μL of 10 μg mL−1t-HCA aqueous solution.
The extraction procedure utilised was based on the method from Andresen et al.20 Samples and calibrators were extracted with 900 μL ethyl acetate for 5 min then centrifuged (5 min at 13000 rpm). The upper layer was collected and evaporated to dryness under nitrogen at room temperature. The extract was reconstituted in 50 μL acetonitrile and 50 μL MTBSTFA with 1% TBCS was added before being vortexed for 15 s, transferred into a crimp top vial with insert, and loaded onto the GCMS auto-sampler.
Instrumentation
Analyses were performed using a Clarus 600 gas chromatograph with a Clarus 600C mass spectrometer (Perkin Elmer, Seer Green, UK) in positive electron ionisation mode (EI+) with a DB-1 MS (30 m × 0.25 mm × 0.25 μm) column (J&W Scientific, Wokingham, UK). Data was processed with Perkin Elmer TurboMass software (version 5.4.2.1617). The carrier gas was helium maintained at 1 mL min−1 flow rate. The column temperature was initially held at 60 °C for 5 min, then increased to 240 °C at 30 °C min−1, and finally kept at 240 °C for 4 min (run time = 15 min). The injection volume was 1 μL. The GCMS inlet line was set at 250 °C. The programmable split/splitless (PSS) injector with programmable pneumatic control (PCC) was fitted with a narrow bore liner packed with glass-wool (Fig. 1).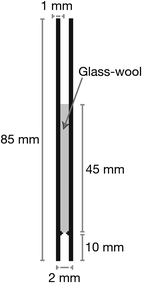 | ||
| Fig. 1 Injector liner dimensions diagram showing the glass-wool packing level. | ||
The ionisation source was held at 200 °C with an ionisation energy set at 70 eV and the detector multiplier at 300 V. Full-scan mode (m/z 60 to 350) was used to characterise the derivatives with the injector temperature at 240 °C and in splitless mode.
Optimisation of the IPS conditions was completed in selected ion monitoring (SIM) mode targeting m/z 226 for n-C16 [M]+, m/z 273 for t-HCA(t-BDMS)2 [M-57]+, and m/z 275 for GHB(t-BDMS)2 [M-57]+ and the split flow ratio was 10![[thin space (1/6-em)]](https://www.rsc.org/images/entities/char_2009.gif) :
:![[thin space (1/6-em)]](https://www.rsc.org/images/entities/char_2009.gif) 1 when the split mode was used. Preliminary injector temperature optimisation was performed by ranging the injector temperature from 200 °C to 300 °C with 20 °C increments. Purge-off time optimisation was done maintaining the split valve closed for a time ranging from 6 to 180 s in the first study and then from 0.6 to 12 s in the second before opening it. Performances of several combinations of starting temperature ranging from 60 to 240 °C and temperature ramps ranging from 0 to 180 °C min−1 were assessed for the determination of the optimum injector temperature program.
1 when the split mode was used. Preliminary injector temperature optimisation was performed by ranging the injector temperature from 200 °C to 300 °C with 20 °C increments. Purge-off time optimisation was done maintaining the split valve closed for a time ranging from 6 to 180 s in the first study and then from 0.6 to 12 s in the second before opening it. Performances of several combinations of starting temperature ranging from 60 to 240 °C and temperature ramps ranging from 0 to 180 °C min−1 were assessed for the determination of the optimum injector temperature program.
Urine analysis was initially conducted using the optimised injector conditions determined beforehand (split valve opened (10![[thin space (1/6-em)]](https://www.rsc.org/images/entities/char_2009.gif) :
:![[thin space (1/6-em)]](https://www.rsc.org/images/entities/char_2009.gif) 1) and starting temperature of 60 °C ramping up at 40 °C min−1 to reach 240 °C which was maintained until the end of the run) in full-scan mode (m/z 60 to 350) to assess possible chromatographical interferences from urinary products. Confirmation and quantification were carried out in SIM mode targeting m/z 273 for t-HCA(t-BDMS)2 [M-57]+ and m/z 275 for GHB(t-BDMS)2 [M-57]+ as quantifier ions, and m/z 315 [M-15]+ and m/z 273 [M-57]+ as qualifiers for t-HCA(t-BDMS)2 and GHB(t-BDMS)2 respectively. Adjustments were made to the quadrupoles settings to accommodate the width of the analyte peaks and ensure best detection as follows: span 0.5, dwell time 0.06 s and inter-channel delay 0.01 s.
1) and starting temperature of 60 °C ramping up at 40 °C min−1 to reach 240 °C which was maintained until the end of the run) in full-scan mode (m/z 60 to 350) to assess possible chromatographical interferences from urinary products. Confirmation and quantification were carried out in SIM mode targeting m/z 273 for t-HCA(t-BDMS)2 [M-57]+ and m/z 275 for GHB(t-BDMS)2 [M-57]+ as quantifier ions, and m/z 315 [M-15]+ and m/z 273 [M-57]+ as qualifiers for t-HCA(t-BDMS)2 and GHB(t-BDMS)2 respectively. Adjustments were made to the quadrupoles settings to accommodate the width of the analyte peaks and ensure best detection as follows: span 0.5, dwell time 0.06 s and inter-channel delay 0.01 s.
Results and discussion
Characterisation of the derivatives
In full-scan mode a peak was obtained at retention time 10.95 min that was identified as GHB(t-BDMS)2 (Mw = 332 g mol−1) (Fig. 2). The molecular ion m/z 332 [M]+ was not present due to the extensive fragmentation of the tert-butyl group under 70 eV conditions, however qualifier ions: m/z 317 [M-15]+ and m/z 275 [M-57]+ corresponding to the loss of a methyl group (CH3), and a tert-butyl group (C4H9) respectively were present and expected with an EI+ fragmentation of t-BDMS derivatives. The full mass spectrum profile was then compared to a National Institute of Standard and Technology library (TurboMass NIST 2008 Library, version 2.2.0) which matched the profile with butanoic acid, 4-[(tert-butyldimethylsilyl)oxy]-, tert-butyldimethylsilyl ester, i.e. the GHB(t-BDMS)2 derivative. Other usual expected fragments (m/z 189, 147, 75, 73) were also present and in common with GHB(TMS)2 derivatives.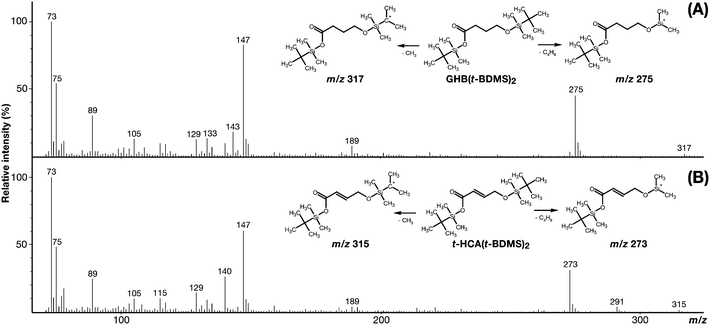 | ||
| Fig. 2 Mass spectra of GHB(t-BDMS)2 (A) and t-HCA(t-BDMS)2 (B) and chemical structures of the respective derivatives with corresponding qualifier ions. | ||
Similarly, a peak was obtained at retention time 11.19 min that was identified as t-HCA(t-BDMS)2 (Mw = 330 g mol−1) (Fig. 2). For the same reason as the GHB derivative, the molecular ion m/z 330 [M]+ was absent, however qualifier ions: m/z 315 [M-15]+ and m/z 273 [M-57]+ were present. The NIST library did not contain the exact entry and matched the full mass spectrum profile to tert-butyl(dimethyl)silyl-3-[(tert-butyl(dimethyl)silyl]oxy)but-2-oenate which is a branched isomer of the t-HCA(t-BDMS)2.
The silylated derivatives are typically expected to follow the elution order dictated by their primitives' boiling points when separated with a non-polar GC column. Under atmospheric pressure, GHB and t-HCA boiling points are 295.6 °C and 338.7 °C respectively which correlates the elution order for GHB(t-BDMS)2 at 10.95 min followed by the t-HCA(t-BDMS)2 at 11.19 min. Retention time consistency was observed throughout the subsequent analyses.
Typical GBL (m/z 86, 85) chromatographic features21 were not observed suggesting that GHB dehydration was minimal.
Optimisation of the IPS conditions
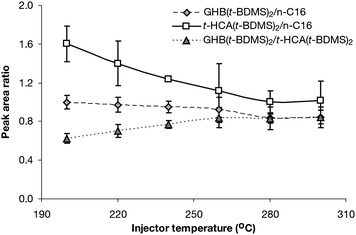 | ||
| Fig. 3 GHB(t-BDMS)2 and t-HCA(t-BDMS)2 yield ratios and relative productions as a function of isothermal injector temperatures (n = 9). | ||
GHB(t-BDMS)2 production decrease was slower than t-HCA(t-BDMS)2 across the range until equilibrium was reached between the two production rates at 260 °C and above (Fig. 3).
A possible reason for the decrease in derivative yield could be the stability of the MTBSTFA with 1% TBCS reagent, which is stored at −18 °C and could have been increasingly unstable as the injector temperature increased.
Best reproducibility was achieved at 240 °C, with 6.3%CV for GHB(t-BDMS)2 and 1.8%CV for t-HCA(t-BDMS)2. Consequently, even if 240 °C did not induce the highest amount of derivatisation products, it was a good compromise between yield and reproducibility and was chosen to be the injector temperature for the subsequent study.
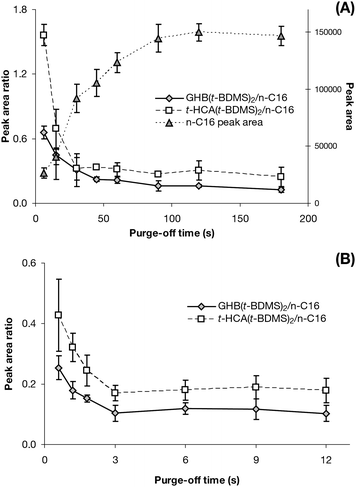 | ||
| Fig. 4 Purge-off time optimisation. (A) n-C16 peak area and GHB(t-BDMS)2 and t-HCA(t-BDMS)2 yield ratios related to purge-off time ranging from 6 to 180 s (n = 9). (B) GHB(t-BDMS)2 and t-HCA(t-BDMS)2 yield ratios related to purge-off time ranging from 0.6 to 18 s (n = 18). | ||
Subsequently, GHB(t-BDMS)2 and t-HCA(t-BDMS)2 yields were evaluated across the same purge-off time range and normalised with the IIS (Fig. 4A). While the n-C16 intensity increased overall, the GHB(t-BDMS)2 and t-HCA(t-BDMS)2 peak areas did not. Hence an overall decrease in the relative analytes yield can be observed down to a plateau starting at 45 s for GHB(t-BDMS)2 and 30 s for t-HCA(t-BDMS)2. Moreover, the variations in peak areas observed for the analytes were small when compared against the n-C16 peak, which suggested that their yield became rapidly independent of the purge-off time. In other words, the rapid decrease of production ratio observed between 6 and 30 s was manufactured by the n-C16 rapid intensity increase at the same time.
The provisional conclusion was that a lengthy purge-off time does not improve the analyte yield. This could have indicated that the analytes and MTBSFTA were adsorbed onto the glass-wool as they are all highly polar and were not subjected to the split effect unlike non-polar n-C16. It could also have implied that the derivatisation was very fast and the derivatives condensed very rapidly onto the column after production. However the non-polar derivatives should have followed the IIS model after being created and a significant fraction of them should have been lost with an early split and an overall increase in their numbers should have been witnessed with an extended purge-off time, which was not the case.
A further study was carried out to establish if a very short splitless period would confirm previous findings and improve the derivatives' yield. Both GHB(t-BDMS)2 and t-HCA(t-BDMS)2 yields significantly decreased between 0.6 and 3 s of purge-off time, then stabilised afterwards (Fig. 4B). This strengthened the idea that polar GHB, t-HCA and MTBSTFA adsorbed onto the glass-wool, unaffected by the split. When non-polar GHB(t-BDMS)2 and t-HCA(t-BDMS)2 were produced, they directly condensed onto the column head which was relatively cool compared to the injector liner. Moreover, GHB and t-HCA were carried by DMSO meanwhile MTBSTFA and n-C16 were carried by ethyl acetate. DMSO (bp 189 °C) being less volatile than ethyl acetate (bp 77.1 °C), it was conceivable that the drug molecules were exposed to the heat of the chamber slightly after the MTBSTFA and n-C16 ones which would already have been vaporised, allowing the derivatisation to start straight away. This could have explained the little amount of intra-esterification of the GHB into GBL witnessed in the initial full-scan study as the derivatisation occurred regardless. However it was difficult to declare the GHB silylation faster than the GHB dehydration at this point.
With the MTBSTFA being vaporised before the analytes, it was possible that a fraction of it could have been lost via the split-vent. However, because it is fairly polar and attached to the glass-wool, this loss would not be as high as the n-C16 one.
To conclude, it seemed that a shorter splitless time increased GHB(t-BDMS)2 and t-HCA(t-BDMS)2 yields. One reason could have been that when the drop of analytes and reagents volatilised rapidly in the injector just after injection, the chamber was mostly saturated with ethyl acetate and DMSO vapours. When the valve was closed, the solvent molecules flooding the injector reduced the chances that GHB and t-HCA met with MTBSTFA lowering the derivatives' production. On the contrary, when the split was left open, a large proportion of the solvents vapour was vented via the split exhaust tube meanwhile GHB and t-HCA adsorbed to the glass-wool, readily available for MTBSTFA to derivatise them. Obviously some GHB and t-HCA may have been lost through the split-vent, but proportionally far less than the solvents. Although fairly polar, MTBSTFA was also potentially subjected to the split effect and it was necessary to ensure that it was well in excess of the molar ratio necessary for the derivatisation process to occur, taking into account the split ratio. However, this did not explain why the derivatives, which were non-polar, seemed to condense onto the column instead of being vented through the split exhaust after being produced.
An answer could be the manner in which the constant helium flow carries molecules from the injector onto the column. When the split vent was closed, the quantity of molecules present in the injector chamber could have been too high for the helium to instantaneously carry all in the column. The derivatives produced ended up in the solvent cloud “waiting” to be introduced in the column. Consequently, when the split valve opened, the derivatives were being purged out of the system in the same manner as the rest of the species present in the injector at the time (solvents and MTBSTFA). On the contrary, if the split valve was opened from the beginning, the solvents cloud was rapidly eliminated meanwhile the derivatives were being created. Once produced, the helium flow naturally carried them onto the column because they would be the only species left in the injector apart from some still reacting MTBSTFA and analytes.
In light of these findings and contrary to what was found previously,15 there was little point in using a splitless period at all. Hence the subsequent optimisations were carried out with a constant split flow of (10![[thin space (1/6-em)]](https://www.rsc.org/images/entities/char_2009.gif) :
:![[thin space (1/6-em)]](https://www.rsc.org/images/entities/char_2009.gif) 1).
1).
Three minutes was chosen to be the fixed time allowed for the temperature to reach 240 °C as it allows 2 min for the analytes to be derivatised in case none to little derivatisation processes takes place before that. It was also long enough to allow for a wide range of starting temperature (60–240 °C) hence an extensive injector temperature ramp range (0–60 °C min−1) to be studied while keeping all parameters within capabilities of the instrument (Fig. 5A).
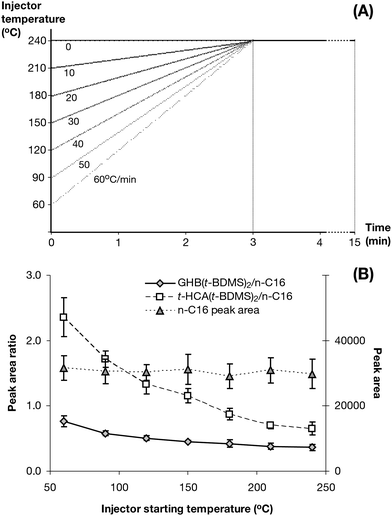 | ||
| Fig. 5 Injector starting temperature optimisation. (A) Injector temperature programs utilised for determining the optimum injector starting temperature relating initial temperature with associated temperature ramps. (B) GHB(t-BDMS)2 and t-HCA(t-BDMS)2 yield ratios and n-C16 peak area related to injector starting temperature (n = 18). | ||
n-C16 was unaffected by the injector starting temperature variation as expected (Fig. 5B). Derivatives' yield greatly improved with the injector starting temperature at 60 °C coupled with a 60 °C min−1 ramp as the GHB(t-BDMS)2 produced was doubled and the t-HCA(t-BDMS)2 yield increased by a factor of 3.4 compared to an isocratic injector temperature at 240 °C. Consequently, the subsequent study was performed using 60 °C as the starting injector temperature.
With a fixed 60 °C starting temperature, the slowest possible temperature ramp was 40 °C min−1, which corresponded to 4.5 min of ramping time, giving 30 s at 240 °C to allow the last-produced derivatives to condense onto the column head before the column oven would start to heat-up. The fastest possible ramp was dictated by the instrument itself which allowed 200 °C min−1 maximum. The injector temperature ramps utilised and their corresponding time to reach 240 °C are shown in Fig. 6A.
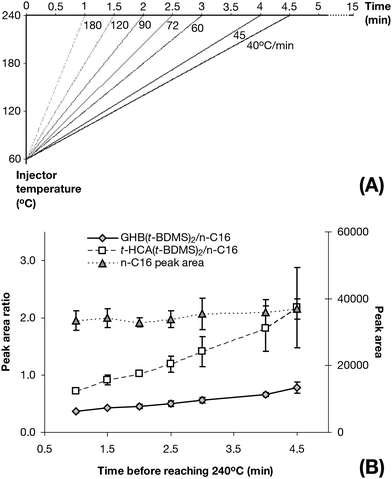 | ||
| Fig. 6 Injector temperature ramp optimisation. (A) Injector temperature programs utilised for determining the optimum injector temperature ramp associating temperature ramps and time to reach 240 °C. (B) GHB(t-BDMS)2 and t-HCA(t-BDMS)2 yield ratios and n-C16 peak area as a function of time to reach 240 °C (n = 18). | ||
While n-C16 was impervious to the injector temperature ramping changes as expected, both GHB(t-BDMS)2 and t-HCA(t-BDMS)2 yields were affected by the speed at which 240 °C was reached starting from 60 °C (Fig. 6B). The slowest ramp (40 °C min−1), which correspond to a total of 4.5 min to reach 240 °C, was found to increase the yield of GHB(t-BDMS)2 by 208% and t-HCA(t-BDMS)2 by 335% when compared to the fastest ramp (180 °C min−1 – i.e. 1 min to reach 240 °C).
Urinary endogenous GHB concentration determination
Previous study suggested that urea(TMS)2 derivative was coeluting with GHB(TMS)2 when separated using a non-polar column such as the one used for this study.16 Consequently, possible interference from urea(t-BDMS)2 (Mw: 288 g mol−1) was investigated in full-scan mode because it produces m/z 273 [M-15]+ but also m/z 275 [(M + 2)-15]+ from naturally high occurring stable isotope (a molecular mass of 275 having 6.83 relative abundance compared to monoisotopic 273 at 74.19 relative abundance) mostly due the presence of two silicon atoms on the molecule and the significant chance one of them being 30Si (6.2%). Urea(t-BDMS)2 was found but did not co-elute with neither t-HCA or GHB derivatives. However it was noted that because the two peaks are close to each other, a very high urinary urea concentration could possibly interfere with GHB(t-BDMS)2's m/z 275 peak area measurement but the occurrence did not arise in our study. If it would be the case, increasing the polarity of the column stationary phase could improve separation.16With GHB being endogenous and naturally present in body fluids, one of the issues in determining GHB concentration in urine is the difficulty of obtaining GHB free urine to produce calibrators. Here we used one of the volunteers' urine fortified with GHB prior to extraction (ranging from 0.05 to 0.5 μg of GHB added). The method showed a coefficient of determination of 0.999 with gradient and y-intercept relative standard errors of 1.8% and 3.4% respectively and an average coefficient of variation of 5.5% across the range (Fig. 7A), indicating an excellent precision. In addition, the y-intercept closely matched the un-spiked urine ratio which further demonstrated that the relationship between the mass of added GHB detected and the peak area ratios was linear and closely followed the gradient established. Samples' GHB masses were worked out directly using this gradient.
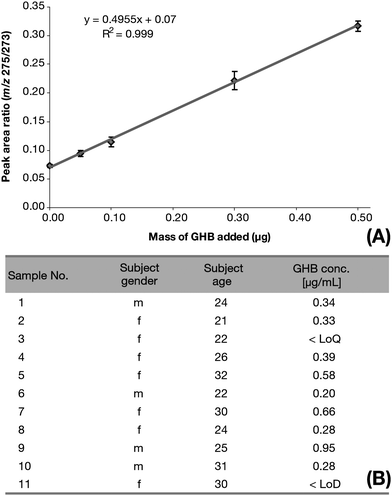 | ||
| Fig. 7 Urinary endogenous GHB concentration determination. (A) Linear regression of mass of GHB added to a chosen subject's urine vs. corresponding quantifier ions peak area ratios (m/z 275/273) (n = 6). (B) Endogenous GHB concentration in the test-subjects' urine. GHB concentrations are reported as the drug itself and not as salt. | ||
The typical manner in which the limit of detection (LoD) of a method is estimated is to calculate the concentration corresponding to a m/z signal three times the background noise level of negative controls, which was not possible for this study. In addition, providing that one of the main advantages of the SIM mode over the full-scan mode is the considerable reduction of background noise levels and that clean well tuned systems present noise levels lower than their area integration capabilities, the LoD was solely depending on the uncertainties in peak area ratios when no GHB was added, in other word the y-intercept standard error. This was multiplied by three to ensure minimal possibility of false positive and the corresponding mass calculated to give an estimated LoD of 0.015 μg of GHB (equivalent to 0.049 μg mL−1). The limit of quantification (LoQ) was determined by multiplying the same value by ten minimising chances of false negative and estimated at 0.049 μg of GHB (equivalent to 0.162 μg mL−1).
GHB concentration was determined in 9 out of 11 samples (Fig. 7B) ranging from 0.20 to 0.95 μg mL−1 with a mean of 0.45 μg mL−1 which is consistent with published studies.16,20,22–28 One sample did not contain a concentration above the method's LoD and another had a concentration projected at 0.12 μg mL−1 falling between the LoD and the LoQ.
Calibrators' confirmation ion ratios m/z 275/317 for GHB(t-BDMS)2 and m/z 273/315 for t-HCA(t-BDMS)2 were considered to estimate the limit of confirmation (LoCf) of the method. t-HCA derivative confirmation ion ratio showed good repeatability with a coefficient of variation of 9.1%. GHB derivative confirmation ratio was concentration independent between 0.4 and 4 μg of GHB added with a coefficient of variation of 8.4%. Below 0.4 μg of GHB added, m/z 317 was not reliably detected and the source's ionisation energy was lowered from 70 to 50 eV in an attempt to improve its signal without success. Both GHB and t-HCA derivative confirmation ion ratios were well within the ±20% mass spectrometry acceptance criteria for confirmation ion ratios form the Society of Forensic Toxicologists (SOFT)'s forensic toxicology laboratory guidelines (2006 version), and the LoCf pronounced at 0.40 μg of GHB added (equivalent to 1.33 μg mL−1).
Conclusions
During the successful IPS of GHB and t-HCA into their (t-BDMS)2 derivatives, t-HCA demonstrated similar chemical behaviour to GHB and is therefore a potential internal standard for quantitative GHB methods with a definite chromatographic advantage over GHB-d6 as t-HCA(t-BDMS)2 separated from GHB(t-BDMS)2 while GHB-d6(t-BDMS)2 would be expected to coelute with it in the same manner as GHB(TMS)2 and GHB-d6(TMS)2 coelute.2,7,8The derivatisation yields were greatly improved by slowly increasing the injector temperature up to an optimum (starting temperature of 60 °C ramping up at 40 °C min−1 to reach a final temperature of 240 °C) and, while this is consistent with a typical reaction requiring heat to overcome its energy barrier, it also demonstrates the impact the presence of solvents' vapour has on the derivatisation yield and supports the decision to keep a constant split flow of 10![[thin space (1/6-em)]](https://www.rsc.org/images/entities/char_2009.gif) :
:![[thin space (1/6-em)]](https://www.rsc.org/images/entities/char_2009.gif) 1 as opposed to utilising an initial purge-off time. Gradually increasing the injector temperature allows for the direct elimination of most of the solvents' vapours as they form reducing the risk of eliminating newly formed derivatives as they “wait” to be carried into the column.
1 as opposed to utilising an initial purge-off time. Gradually increasing the injector temperature allows for the direct elimination of most of the solvents' vapours as they form reducing the risk of eliminating newly formed derivatives as they “wait” to be carried into the column.
Urinary endogenous GHB concentration determination in human subjects demonstrated that the method can be successfully applied to the toxicological analysis of GHB.
Finally, the IPS procedure did not compromise the injector nor the liner and the glass-wool packing was renewed every hundred injections.
Acknowledgements
The authors are grateful to the University of Lincoln for financial support for this study. This work was carried out under a UK Home Office Drug License.References
- K. R. Drasbek, J. Christensen and K. Jensen, Acta Neurol. Scand., 2006, 114, 145 CrossRef CAS.
- S. Blair, M. Song, B. Hall and J. Brodbelt, J. Forensic Sci., 2001, 46(3), 688 CAS.
- C. A. de Vriendt, D. K. van Sassenbroeck, M. T. Rosseel, E. J. van de Velde, A. G. Verstraete, Y. Vander Heyden and F. M. Belpair, J. Chromatogr., A, 2001, 752, 85 CrossRef CAS.
- A. Baldacci, R. Theurillat, J. Caslavska, H. Pardubska, R. Brenneisen and W. Thromann, J. Chromatogr., A, 2003, 990, 99 CrossRef CAS.
- M. Wood, M. Laloup, N. Samyn, M. R. Morris, E. A. de Bruijin, R. A. Maes, M. S. Young, V. Maes and G. De Boeck, J. Chromatogr., A, 2004, 1056, 83 CrossRef CAS.
- R. Gottardo, F. Bortolotti, M. Trettene, G. De Paoli and F. Tagliaro, J. Chromatogr., A, 2004, 1051, 207 CAS.
- J. E. Meyers and J. R. Almirall, J. Forensic Sci., 2005, 50(1), 31 CrossRef CAS.
- D. Richard, B. Ling, N. Authier, T. W. Faict, A. Eschalier and F. Coudore, Anal. Chem., 2005, 77, 1354 CrossRef CAS.
- J. W. Mercer, L. S. Oldfield, K. N. Hoffman, D. M. Shakleya and S. C. Bell, J. Forensic Sci., 2007, 52(2), 383 CrossRef CAS.
- C. K. Zacharis, N. Raikos, N. Giouvalakis, H. Tsoukali-Papadopoulou and G. A. Theodoridis, Talanta, 2008, 75, 356 CrossRef CAS.
- L. A. Ciolino, M. Z. Mesmer, R. D. Satzger, A. C. Machal, H. A. McCauley and A. S. Mohrhaus, J. Forensic Sci., 2001, 46(6), 1315 CAS.
- A. Shareef, M. J. Angrove and J. D. Wells, J. Chromatogr., A, 2006, 1108, 121 CrossRef CAS.
- J. Wu, R. Hu, J. Yue, Z. Yang and L. Zhang, Proceedings of world academy of science, engineering and technology, 2008, ISSN 2070–3740, 443 Search PubMed.
- S. Chu and R. J. Letcher, Anal. Chem., 2009, 81, 4256 CrossRef CAS.
- J. Wu, R. Hu, J. Yue, Z. Yang and L. Zhang, J. Chromatogr., A, 2009, 1216, 1053 CrossRef CAS.
- N. Shima, A. Miki, T. Kamata, M. Katagi and H. Tsuchihashi, Forensic Sci. Int., 2005, 149, 171 CrossRef CAS.
- N. Shima, A. Miki, T. Kamata, M. Katagi and H. Tsuchihashi, J. Health Sci., 2005, 51(2), 147 CrossRef CAS.
- J.-J. Bourguignon, M. Schmitt and B. Didier, Alcohol, 2000, 20, 227 CrossRef CAS.
- M. P. Castelli, L. Ferraro, I. Mocci, F. Carta, M. A. M. Carai, T. Antonelli, S. Tanganelli, G. Cignarella and G. L. Gessa, J. Neurochem., 2003, 87, 722 CrossRef CAS.
- H. Andersen, N. Spyrs, A. Schmoldt, A. Mueller and S. Iwersen-Bergmann, Forensic Sci. Int., 2010, 200, 93 CrossRef.
- F. Tateo and M. Bononi, J. Food Compos. Anal., 2003, 16, 721 CrossRef CAS.
- S. J. Kerrigan, J. Anal. Tox., 2002, 25, 130 Search PubMed.
- A. A. Elian, Forensic Sci. Int., 2002, 128, 120 CrossRef CAS.
- D. T. Yeatman and K. Reid, J. Anal. Tox., 2003, 27, 40 CAS.
- S. P. Elliot, Forensic Sci. Int., 2003, 133, 9 CrossRef.
- C. E. Crookes, M. C. Faulds, A. R. W. Forrest and J. H. Galloway, J. Anal. Tox., 2004, 28, 644 CAS.
- M. A. LeBeau, M. A. Montgomery, C. Morris-Kukoski, J. E. Schaff and A. Deakin, J. Anal. Tox., 2006, 30, 98 CAS.
- M. A. LeBeau, M. A. Montgomery, C. Morris-Kukoski, J. E. Schaff and A. Deakin, Forensic Sci. Int., 2007, 169, 152 CrossRef CAS.
| This journal is © The Royal Society of Chemistry 2012 |
