Driving bioenergetic processes with electrodes
Nikolaos N.
Daskalakis
a,
Anne
Müller
b,
Stephen D.
Evans
a and
Lars J. C.
Jeuken
*b
aSchool of Physics and Astronomy, University of Leeds, LS2 9JT, Leeds, UK
bInstitute of Membrane and Systems Biology, University of Leeds, LS2 9JT, Leeds, UK. E-mail: L.J.C.Jeuken@leeds.ac.uk; Fax: +44 (0)113 3433900; Tel: +44 (0)113 3433829
First published on 26th October 2010
Abstract
Surface-applied electrochemical potentials are used to drive the formation of a proton gradient in adsorbed lipid vesicles. Protons are pumped across the lipid bilayer by an ubiquinol oxidase from Escherichia coli and this activity is controlled by electrochemically reducing the ubiquinone pool in the vesicles.
Introduction
In nature, transmembrane proton gradients are formed using energy supplied by light or chemical reactions, but in biomimetic or hybrid organic–inorganic systems other forms of energy could in principle be utilised. Here, we have explored the use of surface-applied electrochemical potentials as an energy source.Combining inorganic materials with self-assembling biomolecules such as lipids and enzymes can form complex systems with emerging properties.1 These self-assembled biological or biomimetic nano- and microstructured materials provide novel devices in engineering and chemistry and form new platforms for experimental biology. For instance, lipid vesicles have been used as femto- and attolitre reaction vessels,2 while emerging properties have been designed in multi-vesicular systems.3Lipid vesicles can also ‘store’ energy in the form of transmembrane proton and ion gradients. Using proton-pumping enzymes like bacteriorhodopsin enables the synthesis of continuous or triggered proton gradients using light as energy source. This method was used more than a decade ago to study the enzyme mechanism of F0F1-ATPase4 and more recently to create artificial polymer-based organelles that synthesise ATP from light.5
Previously, we adsorbed lipid membranes onto gold electrodes and by using the ubiquinone pool as electron mediator, the activity of quinone-converting respiratory enzymes was controlled.6–8 By reconstituting surface-adsorbed vesicles with a proton-pumping ubiquinol oxidase (UO), cytochromebo3, the same system is used here to convert surface potentials into a proton gradient across adsorbed vesicles (Fig. 1). Cytochromebo3 from Escherichia coli is a member of the heme-copper oxidase family and reduces oxygen to water concurrent with the translocation of four protons across the membrane.9
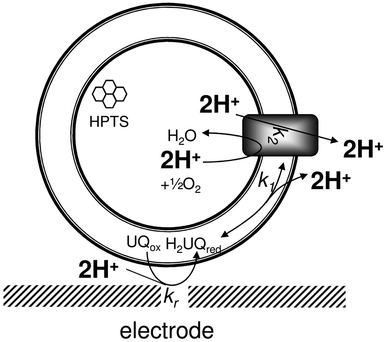 | ||
| Fig. 1 Illustration of the experimental setup used and the four protons removed from the intravesicular compartment per 2 electrons required to reduce ubiquinone to ubiquinol. This illustration assumes a single orientation of the enzyme in the vesicles. See text for more explanation. | ||
For the enzyme orientation shown in Fig. 1, four protons are effectively removed from the surface-adsorbed vesicle for every ubiquinol that is oxidised; two protons are consumed to reduce (half) an oxygen molecule and two protons are pumped to the outside. The fluorescent probe 8-hydroxypyrene-1,3,6-trisulfonic acid (HPTS) has been encapsulated into UO-containing vesicles to monitor the intravesicular pH. HPTS is a lipid-membrane impermeable probe with an excitation wavelength that depends on its protonation state, providing the means to measure the pH inside the vesicle independent on the dye concentration (and thus photobleaching or quenching by the metallic electrode).
Materials and methods
Template stripped gold (TSG) electrodes were fabricated as described previously.6TSG electrodes were modified with 6-mercaptohexanol (Aldrich, 97%) in n-propanol for one hour and rinsed with n-propanol and methanol.The inner membrane extracts of the strain GO105/pJRhisA, which overexpresses cytochromebo3, and the vesicles containing mixtures of these inner membrane extracts and E. coli ‘polar’ lipids (Avanti) were prepared as previously described.8 Proteoliposomes containing purified cytochromebo3 were also prepared as described before.6 The fluorescent dye, HPTS, was encapsulated into the different types of vesicles by freeze thawing the vesicles in the presence of 5 mM HPTS three times and extruding this sample 11 times through 400 nm track edge membranes using an Avanti extruder.
All further experiments were preformed in buffer solutions (20 mM MOPS (Sigma), pH 7.4, 30 mM Na2SO4). TSG electrodes were incubated with these vesicles (0.5 mg ml−1) in buffer for 30 min at room temperature. The electrodes were rinsed extensively with buffer (removing non-encapsulated dye) and fitted in a home-build spectroelectrochemical cell, containing the standard three electrode setup with Pt as counter electrode and a saturated Ag/AgCl (Radiometer) reference electrode. A Chi604c potentiostat was used to measure cyclic voltammograms and set the applied potential during the fluorescence measurements. A Nikon i90 epi-fluorescent microscope was used to measure the ratio of fluorescence recorded with two different excitation barrier filters (395–425 nm and 460–480 nm). In both cases the same dichroic mirror (500 nm) and emission filter (510–560 nm) were used. For the time traces only the 460–480 nm excitation filter was used. After reducing the size aperture, a small region in the surface was fully photobleached, which was consequently used to determine the background fluorescence. Calibration curves showed that after background correction, the ratio of fluorescence intensity (using the two excitation barrier filters) was a reproducible measure of intravesicular pH. The data presented here are offset using the pH measured at an applied potential of −0.15 V vs.Ag/AgCl.
Results and discussion
Fig. 2 shows a cyclic voltammogram of adsorbed vesicles and the intravesicular pH after fixing the electrode at various potentials. In the cyclic voltammogram, a sigmoidal wave is visible below −0.3 V (vs.Ag/AgCl). At this point ubiquinone is reduced to ubiquinol, which is reoxidised by OU. In the same potential window an increase in pH is observed, indicating that UO pumps protons to the outside of the vesicle when electrochemically activated. When cyanide, a potent inhibitor of UO, is added at a concentration that almost completely inhibits the activity as observed with cyclic voltammetry, the remnants of activity are still sufficient to build up a proton gradient.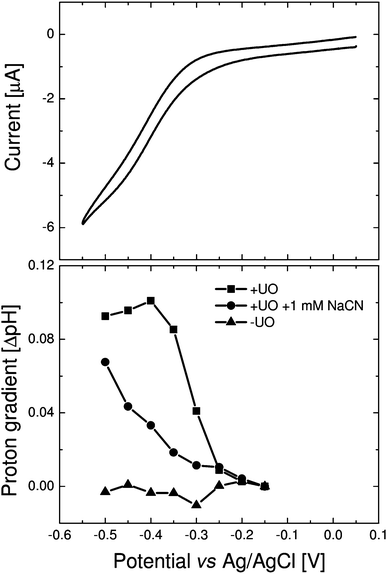 | ||
| Fig. 2 (Top) Cyclic voltammogram (10 mV s−1) of vesicles containing UO adsorbed onto a gold electrode (∼0.25 cm2). The vesicles are made from E. colilipid extract containing inner-membrane extracts from the strain GO105/pJRhisA (10% (w/w) protein/lipid). (Bottom) The pH of the same vesicles after fixing the electrode for 60 s at the indicated potential before and after addition of 1 mM NaCN. A separate control experiment without inner membrane extracts is also shown. | ||
After the potential is switched off, the pH gradient dissipates quickly (see below), suggesting that the maximum pH gradient achieved in these vesicles is an equilibrium between proton pumping and proton leakage. The proton leakage (HPTS remains trapped in the vesicles) might be worsened by the large protein content or by the interaction between the vesicles and the electrode surface. We note that the data shown in Fig. 2 are obtained using vesicles that are homogenous mixtures of total inner membrane extracts from E. coli and phospholipids (see Methods). Using freeze thawing, the extracts and phopholipids were mixed at a given protein–lipid ratio (In Fig. 2 this is 10% weight protein per dry weight of lipid.) The freeze-thaw method has the benefit of simplicity, the absence of detergents and allows the incorporation of high UO contents in the lipid vesicles. Incomplete mixing of the vesicles is excluded as ubiquinone-10 in lipid vesicles without UO would give rise to a quinone oxidation peak in the cyclic voltammogram.
To test if the high protein content is related to the observed leakiness, the protein content in the vesicles was varied (Fig. 3). Increasing the total protein content from 10% to 50% only slightly increases the pH gradient. In contrast, reducing the protein content to 1% total protein from inner membranes per lipid weight increases the maximum pH gradient to 0.3 pH units. Unfortunately, at this enzyme content, the catalytic current is difficult to distinguish from the background oxygen reduction by the gold electrode. The enzyme activity can, however, be observed by following the pH as a function of time. Fig. 4 shows the rise in pH after applying a potential to activate the UO.
 | ||
| Fig. 3 The pH of the vesicles mixed with various amounts of inner membrane extract as indicated in the legend after fixing the electrode potential for 60 s at the indicated potential. | ||
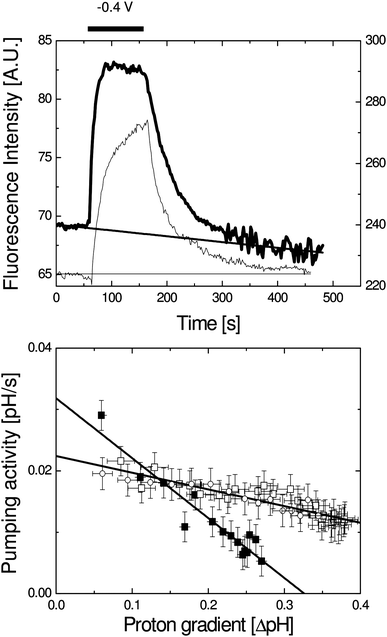 | ||
| Fig. 4 (Top) Fluorescence intensity as a function of time for vesicles containing 1% inner membrane extract (thick line, left axis) and vesicles containing purified and reconstituted UO (thin line, right axis). During the time scan no potential was applied except between 60 and 160 s during which −0.4 V vs.Ag/AgCl was applied (as indicated by the bar). The line indicates the background correction that was applied. In these experiments the fluorescence was measured using only one excitation barrier filter (see Material and methods). (Bottom) Proton pumping activity of UO as a function of observed proton gradient for vesicles containing 1% inner membrane extract (solid symbols) and proteoliposomes containing purified UO (open symbols, contains data of two different experiments). These data have been determined from the data shown at the top as explained in the text. The error bars indicate the SD as determined from the noise in the data. | ||
The rise in pH is due to the proton consumption and translocation of the enzyme with rate (dpH/dt)pump. The first derivative ((dpH/dt)observed) is equal to the proton pumping activity plus the leak rate.
 | (1) |
After switching off the potential, the pH follows an exponential decay, indicating that the leak rate is linearly related to the pH gradient (ΔpH).
| pH = pH0 + (ΔpH0)e−kt | (2a) |
 | (2b) |
Although perhaps unexpected, a linear relationship has previously been reported for lipid vesicles in solution (e.g.ref. 10), while its simplicity allows us to correct for proton leakage during the proton pumping phase.
 | (3) |
We note that this assumes that the leak rate is independent on whether or not the potential is switched on. After this correction, a linear relationship is observed when (dpH/dt)pump is plotted against ΔpH (Fig. 4, bottom). The proton consumption and translocation rate are defined here as pH per s and this activity in protons per second could thus be exponentially related to the ΔpH. Importantly, however, further analysis shows that due to the limited range in pH and noise in proton pumping rates, no significant distinction can be made between a linear and exponential dependence.
Finally, in order to establish if the use of inner membrane extracts from E. coli increases the leak rate of the vesicles and to prove that the pH gradient is indeed established by UO, the experiments were repeated with purified and lipid-vesicle reconstituted UO (Fig. 3 and 4). The data obtained with the purified UO show a very similar behaviour to those of the inner membrane extracts, but the maximal pH gradient reached is even higher (Fig. 3). However, the protein-reconstituted vesicles seem to be more sensitive to the applied electrode potential as the pH gradient formed decreases when potentials below −0.4 V vs.Ag/AgCl are applied.
Extrapolation of the data in Fig. 4 (bottom) provides an estimate of the pH gradient at which no net proton pumping occurs. This value is much higher for the protein-reconstituted vesicles than for the vesicles containing the total inner membrane extracts. This property is currently under investigation, but we propose that this is due to a more homogenous orientation of UO in the protein-reconstituted vesicles.
In conclusion, we have shown that hybrid systems enable the use of non-biological energy sources to drive biological reactions. The use of total inner membrane extracts shows that complex protein ensembles can be included in the system, thus opening a way to utilise the pH gradient to drive other reactions such as active transport of organic substrates across the membrane or ATP synthesis.
Acknowledgements
This work was supported by the White Rose Doctoral Training Centre (DTC) in Physical Methods and Life Sciences funded by the EPSRC. We thank Dr S. Connell for critical reading of the manuscript.Notes and references
- Y. H. M. Chan and S. G. Boxer, Curr. Opin. Chem. Biol., 2007, 11, 581–587 CrossRef CAS; S. G. Zhang, Nat. Biotechnol., 2003, 21, 1171–1178 CrossRef CAS.
- D. M. Vriezema, M. C. Aragones, J. Elemans, J. Cornelissen, A. E. Rowan and R. J. M. Nolte, Chem. Rev., 2005, 105, 1445–1489 CrossRef CAS.
- D. Berti, Curr. Opin. Colloid Interface Sci., 2006, 11, 74–78 CrossRef CAS; P.-Y. Bolinger, D. Stamou and H. Vogel, Angew. Chem., Int. Ed., 2008, 47, 5544–5549 CrossRef CAS; G. Maglia, A. J. Heron, W. L. Hwang, M. A. Holden, E. Mikhailova, Q. H. Li, S. Cheley and H. Bayley, Nat. Nanotechnol., 2009, 4, 437–440 CrossRef CAS.
- P. Richard, B. Pitard and J. L. Rigaud, J. Biol. Chem., 1995, 270, 21571–21578 CrossRef CAS.
- H. J. Choi and C. D. Montemagno, Nano Lett., 2005, 5, 2538–2542 CrossRef CAS.
- L. J. C. Jeuken, S. D. Connell, P. J. F. Henderson, R. B. Gennis, S. D. Evans and R. J. Bushby, J. Am. Chem. Soc., 2006, 128, 1711–1716 CrossRef CAS.
- L. J. C. Jeuken, S. D. Connell, M. Nurnabi, J. O'Reilly, P. J. F. Henderson, S. D. Evans and R. J. Bushby, Langmuir, 2005, 21, 1481–1488 CrossRef CAS.
- S. A. Weiss, R. J. Bushby, S. D. Evans, P. J. F. Henderson and L. J. C. Jeuken, Biochem. J., 2009, 417, 555–560 CrossRef CAS.
- P. Brzezinski and R. B. Gennis, J. Bioenerg. Biomembr., 2008, 40, 521–531 CrossRef CAS; M. Wikström, Biochim. Biophys. Acta, Bioenerg., 2004, 1655, 241–247 CrossRef CAS.
- G. Krishnamoorthy and P. C. Hinkle, Biochemistry, 1984, 23, 1640–1645 CrossRef CAS.
| This journal is © The Royal Society of Chemistry 2011 |