Cryo-electron tomography: 3-dimensional imaging of soft matter
Fabio
Nudelman
,
Gijsbertus
de With
and
Nico A. J. M.
Sommerdijk
*
Laboratory of Materials and Interface Chemistry and Soft Matter CryoTEM Unit, Eindhoven University of Technology, P.O. Box 513, 5600, MB, Eindhoven, The Netherlands. E-mail: n.sommerdijk@tue.nl; Fax: +31 40 245 1036
First published on 13th August 2010
Abstract
The advent of cryogenic-transmission electron microscopy (cryoTEM) signified a breakthrough in the in situ imaging of hydrated specimens of biological and synthetic origin allowing their study in a state of preservation that is close to native. An inherent limitation to cryoTEM, however, is that images are 2-dimensional projections of the 3-dimensional objects, resulting in the overlapping of multiple features that cannot be discerned. Cryo-electron tomography (cryoET) is essential to overcome this limitation. In this technique images of the specimen are acquired at different tilt angles and then reconstructed into the 3-dimensional object, revealing detailed information on the structure, morphology or 3-dimensional spatial organization of (bio)macromolecules and (macro)molecular assemblies. This information then can be coupled to processes happening in the 3-dimensional space, making cryoET an invaluable tool to bridge between the structural organization in space and the function or activity of macromolecular complexes at the nanometre scale.
 Fabio Nudelman | Fabio Nudelman graduated in Biomedical Sciences from the Federal University of Rio de Janeiro, Brazil. In 2000 he moved to the Weizmann Institute of Science, Israel, where he obtained his master's degree in life sciences in 2002. He received his PhD in chemistry working in the field of biomineralization in 2007 and in 2008 he joined the Laboratory of Materials and Interface Chemistry, where he is currently a post-doctoral fellow. His research interests include applying cryoTEM in the study of the structure–function relationship of large macromolecular assemblies and their roles in biological processes, in particular mineralization. |
 Gijsbertus de With | Professor G. (Bert) de With graduated from Utrecht University, received his PhD on the structure and charge distribution in pyrazine crystals (Twente University, 1977) and he joined Philips Research. In 1985 he was appointed part-time professor, became full professor in materials science in 1996 and head of the Laboratory for Materials and Interface Chemistry, TU/e. His research interests include the structure, interfacial phenomena as well as the chemical and thermomechanical behaviour of multi-phase materials. In 2006 his two-volume monograph Structure, Deformation, and Integrity of Materials was published. Since 2006 he is also chairman of the Soft Matter CryoTEM Research Unit. |
 Nico A. J. M. Sommerdijk | Dr Nico A. J. M. Sommerdijk is associate professor in Materials and Interface Chemistry in the department of Chemical Engineering and Chemistry at the Eindhoven University of Technology. In 1995 he completed his PhD at the University of Nijmegen in the field of Organic and Supramolecular Chemistry. After postdoctoral work on inorganic materials and polymer self-assembly he moved to Eindhoven University of Technology in 1999 to work on Biomimetic Materials Chemistry. His research focuses on the use of cryoTEM in the study of (macro)molecular assemblies and their use as templates in biomimetic mineralization studies. |
Introduction
The use of transmission electron microscopy (TEM) in the study of biological and synthetic hydrated samples has always been a challenge. The high vacuum of the microscope requires preparation methods involving sample dehydration and chemical fixation, which frequently causes deformations or even the collapse of the macromolecular architectures. The investigation of molecular assemblies at aqueous interfaces, such as vesicles, micelles and protein complexes becomes rather difficult if they must be studied in a dried state, and the observations generally do not reflect their native, hydrated structures.The development of cryogenic-transmission electron microscopy (cryoTEM) signified a breakthrough in the in situ imaging of such hydrated specimens. Instead of chemical fixation and dehydration, the samples are plunge-frozen into a suitable cryogen (e.g. liquid ethane at −183 °C), resulting in the material becoming embedded in a thin layer of vitreous ice, which is transparent to the electron beam.1 The sample is then studied at liquid nitrogen temperatures to prevent the transformation of the amorphous film into cubic or hexagonal ice and to limit solvent sublimation. The need of chemical staining to enhance the contrast of the low atomic number organic specimens has been overcome by phase-contrast imaging, which arises from the coherent interference of the scattered and transmitted electron beam.2 Thus, dehydration, chemical staining and chemical fixation are avoided and the specimens are studied in a state of preservation that is close to native (Fig. 1), and with the state-of-the-art equipment available today, nanometre resolution can be achieved.3
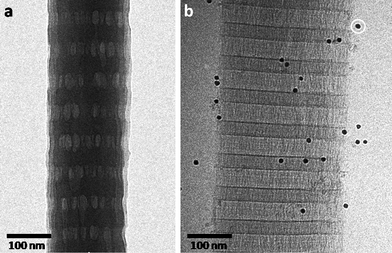 | ||
| Fig. 1 (a) Dry TEM image of freeze-dried collagen. Although the characteristic banding pattern is still visible, drying artifacts are evident and all details in the structure are lost. (b) cryoTEM image of collagen. The sample was vitrified while hydrated, ensuring its preservation in a state that is close to native. White circle: 10 nm gold particle, used as fiducial marker for tomography (see text). Unpublished data. | ||
CryoTEM has played a critical role in the investigation of self-assembly.3–5 It has allowed the study of the morphology, formation and stabilization of micelles, vesicles and other self-assembled structures in solution.4 In addition, the ability of cryoTEM to identify coexisting nanostructures has led to the elucidation of the structural pathway in the transition between vesicles and micelles through the direct observation of the intermediates formed in this process. The assembly behavior of hydrogels has also been extensively studied by cryoTEM, yielding information on the self-assembly kinetics through observation of fibril growth and on their morphology.6 Another interesting study is the direct visualization of the behavior of polyelectrolyte brushes under osmotic pressure, where depending on the ionic strength of the solution, they may be fully stretched or assume a coiled conformation.7 CryoTEM has also been instrumental in the time-resolved study of biomimetic mineralization.8–10 The early stages of CaCO3 formation showed the transition of an amorphous calcium carbonate phase to oriented vaterite and then calcite.9 Recently, high-resolution cryoTEM has been used to image pre-nucleation clusters of CaCO3 of about 0.7 nm in size and their aggregation to assemblies 2–4 nm which forms the onset of the nucleation of amorphous nanoparticles in solution.10
In spite of all the advances provided by cryoTEM, an important limitation of this technique is that the images are 2-dimensional projections of 3-dimensional objects. Not only it is impossible to infer the overall 3-dimensional morphology of an object from its projection, but also its internal structure is not discernible due to the overlapping of multiple features. Overcoming this limitation becomes critical once detailed insights on the structure, morphology or 3-dimensional spatial organization of (bio)macromolecules and (macro)molecular assemblies are required.
Cryo-electron tomography
One approach to obtain 3-dimensional reconstructions of vitrified specimens is through single particle analysis. Multiple images are taken from identical particles (e.g. virus or purified proteins), classified according to their spatial orientation and added together to improve the signal to noise ratio. The summed images are then back projected into a 3-dimensional model which is further refined and will ultimately yield the structure of the particle with sub-nanometre resolution. This approach, however, can only be used when resolving the structure of identical particles, present in large numbers and at different orientations.11 For particles that are not identical, which is most often the case for synthetic macromolecular assemblies and larger structures, cryo-electron tomography (cryoET) is the best method for obtaining 3-dimensional structural information of an object.12,13In cryoET, angular projections of the specimen are acquired at increasing tilt angles. The images must then be aligned with respect to a common origin and tilt axis to correct for relative shifts and rotations between images and to minimize reconstruction artifacts. The two main approaches to align a tilt series are cross-correlation and tracking of fiducial markers, typically 6–20 nm colloidal gold particles that are added to the sample prior to vitrification. Once the images are properly aligned, numerical algorithms are used to reconstruct the 3-dimensional object.14–19 How the object can be reconstructed from its projections at different angles can be explained in an intuitive way by considering the projection theorem.16 This theorem states that a Fourier transform of a projection is a central section through the Fourier transform of the 3-dimensional object. By combining multiple projections at different tilt angles, the 3-dimensional Fourier space of the object is obtained, and through an inverse Fourier transform, the 3-dimensional object is reconstructed (Fig. 2). Several approaches exist to obtain a 3-dimensional reconstruction.20 The most common algorithm is the weighted back-projection,14–16 while iterative17,18 and discrete19 approaches are also used. In a last stage, segmentation is used to generate 3-dimensional graphical representations of the object.17,20
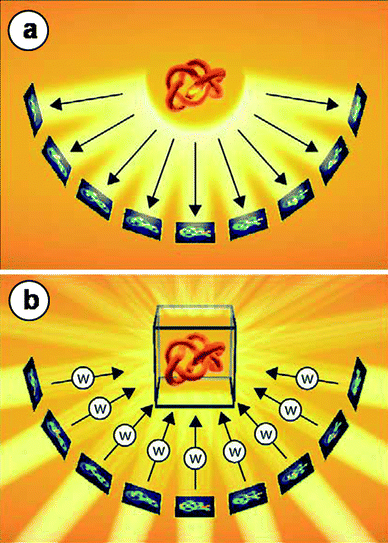 | ||
| Fig. 2 Principle of electron tomography. (a) A single-axis tilt series data acquisition scheme is shown. The object is represented schematically by a flexible knot to emphasize the fact that electron tomography enables the study of (non-repetitive) structures with unique topologies. A set of 2D projection images is recorded while the object is tilted around an axis perpendicular to the electron beam. (b) The back-projection method explains the principle of the 3D reconstruction in a fairly intuitive manner. For each weighted projection (W), a back projection body is calculated, and the sum of all projection bodies represents the density distribution of the original object—the tomogram. Reproduced from Baumeister,21 copyright 2004, with permission from De Gruyter. | ||
While cryoET has been commonly applied in life sciences, mainly to resolve the 3-dimensional morphology of intracellular structures,13,22 its use in soft matter samples is still an almost unexploited field. Nevertheless, this technique has been proven instrumental in understanding issues such as macromolecular self-assembly, the organization of molecules at interfaces and template-directed mineralization, examples of which will be discussed below.
(1) Macromolecular self-assembly
The ability of cryoET to reveal the internal structure of specimens can be best illustrated by the recent work of Parry et al.23 Investigating the aggregation behavior of amphiphilic double-comb diblock copolymers, they showed that the internal morphology of the polymer structures is formed by an interpenetrating network of dark and light regions, constituting bicontinuous structures where the hydrophobic segments are segregated from channels containing the hydrated moieties (Fig. 3). Similarly, in the case of a triblock copolymer consisting of a hydrophobic, a hydrophilic and a fluorophilic block, cryoET revealed not only the structure of the multicompartment micelle, but also highlighted the distribution of the different domains within the structure. In particular, it could be seen that the fluorophilic blocks resided mostly at the core/corona interface, while a smaller fraction self-organized into a tube-like structure within the central core region.24 In a different system, it was shown that dendrimer-based 6 nm nanoparticles with dynamic hydrophobic patches self-assemble into a branched network of worm-like structures.25 It is noteworthy how the 2-dimensional images were misleading in that they showed worm-like and spherical objects, where by cryoET it became evident that the latter were the same worm-like structures viewed edge-on. On the characterization of protein-functionalized liposomes, cryoET allowed the analysis of the surface distribution of proteins conjugated to the vesicles26 (Fig. 4a). | ||
| Fig. 3 CryoTEM analysis of aggregates of a polynorbornene-based amphiphilic double-comb block copolymer PNOEG–PNGLF (polynorbornene-oligo ethylene glycol–polynorbornede-Gly-Leu-Phe). (a) 2D cryoTEM image; (b) cross-section of a 3D SIRT (simultaneous iterative reconstruction technique) reconstructed of the volume containing the particles in (a); (c), (d) visualization of the segmented volume showing (c) a cross-section of the aggregate and (d) a view from within the hydrated channels. Adapted from Parry et al.,23 copyright 2008, with permission from Wiley-VCH Verlag GmbH & Co. KGaA. | ||
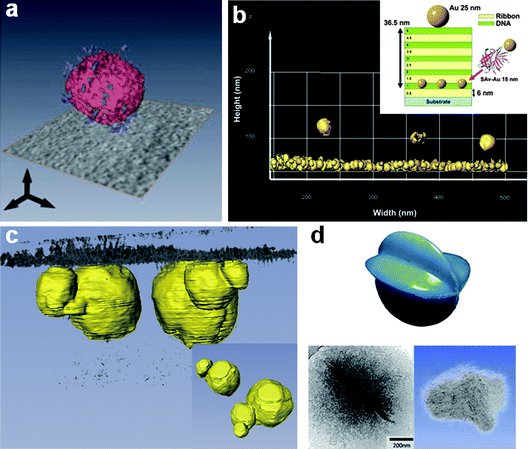 | ||
| Fig. 4 (a) Computer-generated 3D visualization of CNA35-functionalized liposomes. The visualization shows the distribution of the proteins on the surface of the liposomes and highlights the individual components (the lipid bilayer in red and the individual CNA35 proteins in blue). Reproduced from Sanders et al.,26 copyright 2009, with permission from Wiley-VCH Verlag GmbH & Co. KGaA. (b) Isosurface representation of the gold particles in the 3D reconstructed volume in a gold-labeled 5 double layer film deposited on a cryoTEM grid. Inset: schematic representation of the layer-by-layer film and position of the gold conjugates; the pendant biotin functionality is present on the outside of the ribbon aggregates; therefore the SAv-Au particles are presented on top of the first functionalized layer. Adapted from Vos et al.,27 copyright 2008, with permission from ACS. (c) Computer-generated 3D visualization of calcium carbonate crystals (depicted in yellow) growing at the interface with the monolayer (depicted in gray). Inset: particle surface that interact with the monolayer. Adapted from Pouget et al.,10 copyright 2009, with permission from AAAS. (d) Model of the chitosan aggregate (top) obtained from the computer-generated 3D visualization (bottom-right) of the cryo-tomogram recorded from the vitrified specimen (bottom left, 2D cryoTEM image). Modified from ref. 28. | ||
(2) Interfaces
Three-dimensional information on pleomorphic samples, such as Langmuir monolayers, can only be obtained through cryoET.29 This technique allowed the observation, for the first time, of the packing of DNA strands underneath a monolayer of cationic surfactants at the air–water interface, showing that contrary to previous reports, DNA is not orderly packed.30 Molecular anchoring of gold-labeled biotin–streptavidin within a layer-by-layer film could also be observed using cryoET. In 2-dimensional imaging all the features in such a film overlap and therefore it is not possible to show precisely the ordering of neither the film nor the position of the biotin–streptavidin complex. In contrast, 3-dimensional imaging showed the precise position of the gold conjugates within the layer-by-layer film27 (Fig. 4b).(3) Biomimetic mineralization
Three-dimensional imaging through cryoET has been fundamental in distinguishing between events happening in solution and at the monolayer at the air–water interface. For example, Langmuir monolayers have for long been used to template the formation of CaCO3 crystals,31 and only recently, employing cryoET, the interaction between the monolayer and the developing crystal could be understood. It was shown that the first step in the reaction is the formation of 30 nm nanoparticles of amorphous calcium carbonate in solution. In a later stage they bound to the monolayer which allowed them to grow larger and to develop crystalline domains10 (Fig. 4c). An example on how cryoET can be used not only to resolve the 3-dimensional structure of a specimen, but also to relate its morphology to its function can be illustrated in the case of template-directed silicification. A chitosan matrix was used as a template for silica formation, in which star fruit-like silica structures were obtained. CryoET showed that the chitosan matrix already assembled in such morphology prior to mineralization, thus confirming that a copy of the template was produced during silicification, and ruling out the possibility that the matrix changed due to the mineralization conditions28 (Fig. 4d).Data processing
In order to facilitate the interpretation of the 3-dimensional information obtained from the tomogram, there are several procedures that may be applied to the dataset. As mentioned above, the low signal-to-noise ratio may cause difficulties to visualize important features and to interpret the data properly. Several approaches were developed to deal with this problem, such as low pass and median filtering, and more recently non-linear anisotropic diffusion. The latter, in particular, has been demonstrated to significantly improve the signal-to-noise ratio, and can be performed either on the 2-dimensional projections or on the final reconstruction.14 A further step in data processing, already mentioned, is to produce a 3-dimensional graphical representation of the specimen (Fig. 3c and d and 4). Although not strictly necessary, it is a good tool to help to interpret the data through direct visualization of specific features or the overall morphology of the object. Such computer-generated visualizations can be obtained through surface or volume rendering using different colors to denote different features (Fig. 4a) or a color gradient according to mass density of the material. One ought to be careful, however, since the visualization may be subjective in that it is our own interpretation of the tomogram, and therefore it is always necessary to relate to the original dataset. Image segmentation is also often used, in which the tomogram is divided into parts for further analysis. Examples of such analysis are box counting algorithms to quantify the fractal structure of a network,25 or skeletonization, where the surface-rendered object is artificially thinned in order to highlight morphological features that are not immediately obvious from a cross-section of the volume23 (Fig. 5). | ||
| Fig. 5 Computer-generated 3D visualization from the reconstructed cryo-tomogram of aggregates of polynorbornene-based amphiphilic double-comb block copolymer PNOEG–PNLVL (polynorbornene-oligo ethylene glycol–polynorbornede-Leu-Val-Leu). (a) Visualization of the segmented volume before and after (inset) artificial thinning; (b) skeletonization of the aggregate structure highlighting the branching points (arrows) and loops in the aggregate. Adapted from Parry et al.,23 copyright 2008, with permission from Wiley-VCH Verlag GmbH & Co. KGaA. | ||
Limitations of cryoET
An important issue in cryoTEM is the limitation with respect to the electron dose applied. Organic samples as well as the vitrified film are prone to radiation damage caused by the electron beam, which results in the loss of structural details, shrinkage and in extreme cases, the appearance of voids within the organic material.20 Although working at liquid nitrogen temperatures is an important factor in reducing beam damage to the sample, one still has to be careful to limit exposure of the specimen to the electron beam to a minimum, using a relatively low number of electrons per Å2 that is deemed tolerable by the sample. While in 2-dimensional imaging the dose limitations are a concern, in cryoET it becomes even more of an issue, since a large number of images are taken from the specimen at different angles. In a typical tomography acquisition, the tilting range is from −65° to +65° with 1° or 1.5° increments, such that 90–130 images are taken from the specimen. In order to avoid significant radiation damage, it is necessary to calculate the total dose that the object can withstand and divide it efficiently over the series of images. Most organic samples can tolerate around 50–100 electrons per Å2, which means using an average of 0.5–1 electron per Å2 per image. The electron-dose, in turn, together with other parameters such as the thickness of the ice layer and the contrast of the specimens, will determine the signal-to-noise ratio, which will affect the interpretation and visualization of the 3-dimensional reconstructions. Of course it is also possible to reduce the electron-dose by collecting fewer images by increasing the tilt intervals. However, it must be noted that the resolution of the tomogram is also dependent on sampling, meaning that taking fewer images will result in poorer resolution32 (Fig. 6). | ||
| Fig. 6 Illustration of the influence of the tilt range and tilt increment on the quality of tomographic reconstructions. With a tilt range of ±90° and an increment of 2° the reconstruction is almost identical to the original image; with a tilt range of ±50° and an increment of 5° the similarity is very poor. Reproduced from Koster et al.,13 copyright 1997, with permission from Elsevier. | ||
One of the most common reconstruction artifacts is caused by the limitation in the tilt range. For optimal sampling, the specimen should be tilted to ±90°;33 however, cryoholders available today allow a tilt range of ±70°, resulting in a “missing wedge” of information, which causes an elongation of the point-spread function, resulting in distortions32 (Fig. 6 and 7a). For example, features may appear elongated in the direction of the missing wedge, or two objects might appear fused to one another. To complicate things, even if tilting beyond ±70° was possible, at large tilt angles the thickness of the specimen increases significantly, resulting in loss of contrast due to multiple electron scattering, and likely causing further radiation damage. One method available today to reduce the problem of the missing wedge is dual axis tomography, where two tilt-series are recorded, with perpendicular tilt axes, reducing the missing information to a “missing pyramid”34 (Fig. 7b). The result is that, in a tilt range of ±70°, sampling completeness raises from 78% in single axis to 93% in dual axis.35 Although dual axis has been successfully applied to cryogenic samples,36 its usefulness is still a matter of debate, since recording two tilt series of the same specimen means halving the electron-dose/image and hence decreasing the signal-to-noise ratio and increasing the risks of radiation damage. Ultimately, the quality and the resolution of the tomogram will also depend on how precisely the angular projections were aligned prior to reconstruction. Low signal-to-noise ratio, or radiation-induced shrinkage or changes in the structure of the sample are factors that may disrupt the alignment and hence result in a poor tomogram, or even make the reconstruction impossible.
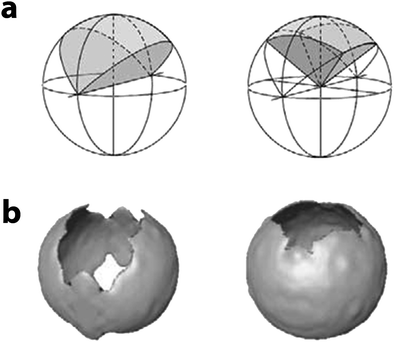 | ||
| Fig. 7 (a) Schematic diagrams showing the sectors in the Fourier domain which remain unsampled owing to the limited tilt range (here ±60°). Left: in single-axis tilting there is a ‘missing wedge’; right: in dual-axis tilting this is reduced to a ‘missing pyramid’. The more complete sampling significantly reduces the distortions in the reconstruction which are due to the non-isotropic resolution. (b) The artifacts resulting from the missing information are illustrated with a thin-walled vesicle. Left: in the single axis case, the vesicle walls perpendicular to the tilt axis and the poles of the vesicle are poorly represented in the reconstructed volume. Right: in the two-axis case, only the poles of the vesicle are affected by the missing information. The same threshold was applied in both cases. Reproduced from Baumeister,21 copyright 2004, with permission from De Gruyter. | ||
Conclusions
In summary, the ability of cryoET in providing 3-dimensional information goes beyond that of simply resolving the morphology and structure of objects. Processes occurring in the 3-dimensional space (i.e. attachment of crystals to a monolayer) can be visualized and understood, bridging between the structural organization in space and the function or activity of macromolecular complexes. As one of the most important limitations of this technique is the applicable electron-dose, one needs to find the optimal conditions in which a tomogram can be acquired and the proper tools for visualization and interpretation of the data. Besides the constant improvement and development of softwares for cryoET acquisition, alignment, reconstruction and data processing, one of the most significant advances in cryoET is the appearance of advanced electron detectors with higher sensitivity than the CCD cameras used today.37 These new systems represent a significant step forward for tomography in that they allow a higher signal-to-noise ratio or the use of lower electron-dose/image, decreasing radiation damage and making it possible to increase sampling. One other approach, still under development, is the use if phase-contrast plates, which allows the in-focus imaging of soft matter, resulting in cryo-tomograms with improved contrast and resolution.38Acknowledgements
We thank the Dutch Science Foundation, NWO, The Netherlands and the European Community (project code NMP4-CT-2006-033277) for financial support.References
- J. Dubochet, J. J. Chang, R. Freeman, J. Lepault and A. W. Mcdowall, Ultramicroscopy, 1982, 10, 55–61 CrossRef; J. Dubochet, J. Lepault, R. Freeman, J. A. Berriman and J. C. Homo, J. Microsc. (Oxford, U. K.), 1982, 128, 219–237 Search PubMed; J. Dubochet and A. W. Mcdowall, J. Microsc. (Oxford, U. K.), 1981, 124, Rp3–Rp4 Search PubMed.
- L. Reimer, Transmission Electron Microscopy, Springer, Berlin, 1997 Search PubMed.
- P. M. Frederik and N. A. J. M. Sommerdijk, Curr. Opin. Colloid Interface Sci., 2005, 10, 245–249 CrossRef CAS.
- H. Cui, T. K. Hodgdon, E. W. Kaler, L. Abezgauz, D. Danino, M. Lubovsky, Y. Talmon and D. J. Pochan, Soft Matter, 2007, 3, 945–955 RSC.
- M. Almgren, K. Edwards and G. Karlsson, Colloids Surf., A, 2000, 174, 3–21 CrossRef CAS; J. Baram, E. Shirman, N. Ben-Shitrit, A. Ustinov, H. Weissman, I. Pinkas, S. G. Wolf and B. Rybtchinski, J. Am. Chem. Soc., 2008, 130, 14966–14967 CrossRef CAS; J. Barauskas, M. Johnsson and F. Tiberg, Nano Lett., 2005, 5, 1615–1619 CrossRef CAS; N. Chebotareva, P. H. H. Bomans, P. M. Frederik, N. A. J. M. Sommerdijk and R. P. Sijbesma, Chem. Commun., 2005, 4967–4969 RSC; D. Danino, Y. Talmon, H. Levy, G. Beinert and R. Zana, Science, 1995, 269, 1420–1421 CAS; S. Jain and F. S. Bates, Science, 2003, 300, 460–464 CrossRef CAS; Z. B. Li, E. Kesselman, Y. Talmon, M. A. Hillmyer and T. P. Lodge, Science, 2004, 306, 98–101 CrossRef CAS; H. R. Marsden, N. A. Elbers, P. H. H. Bomans, N. A. J. M. Sommerdijk and A. Kros, Angew. Chem., Int. Ed., 2009, 48, 2330–2333; H. R. Marsden, J. W. Handgraaf, F. Nudelman, N. A. J. M. Sommerdijk and A. Kros, J. Am. Chem. Soc., 2010, 132, 2370–2377 CrossRef CAS; H. R. Marsden, A. V. Korobko, E. N. M. van Leeuwen, E. M. Pouget, S. J. Veen, N. A. J. M. Sommerdijk and A. Kros, J. Am. Chem. Soc., 2008, 130, 9386–9393 CrossRef CAS; D. J. Pochan, Z. Y. Chen, H. G. Cui, K. Hales, K. Qi and K. L. Wooley, Science, 2004, 306, 94–97 CrossRef CAS; M. R. J. Vos, G. E. Jardl, A. L. Pallas, M. Breurken, O. L. J. van Asselen, P. H. H. Bomans, P. E. L. G. Leclere, P. M. Frederik, R. J. M. Nolte and N. A. J. M. Sommerdijk, J. Am. Chem. Soc., 2005, 127, 16768–16769 CrossRef CAS.
- S. E. Paramonov, H. W. Jun and J. D. Hartgerink, J. Am. Chem. Soc., 2006, 128, 7291–7298 CrossRef CAS; J. P. Schneider, D. J. Pochan, B. Ozbas, K. Rajagopal, L. Pakstis and J. Kretsinger, J. Am. Chem. Soc., 2002, 124, 15030–15037 CrossRef CAS.
- A. Wittemann, M. Drechsler, Y. Talmon and M. Ballauff, J. Am. Chem. Soc., 2005, 127, 9688–9689 CrossRef CAS.
- A. Dey, G. de With and N. A. J. M. Sommerdijk, Chem. Soc. Rev., 2010, 39, 397–409 RSC.
- B. P. Pichon, P. H. H. Bomans, P. M. Frederik and N. A. J. M. Sommerdijk, J. Am. Chem. Soc., 2008, 130, 4034–4040 CrossRef CAS.
- E. M. Pouget, P. H. H. Bomans, J. A. C. M. Goos, P. M. Frederik, G. de With and N. A. J. M. Sommerdijk, Science, 2009, 323, 1455–1458 CrossRef CAS.
- S. Burghardt, A. Hirsch, B. Schade, K. Ludwig and C. Bottcher, Angew. Chem., Int. Ed., 2005, 44, 2976–2979 CrossRef CAS; B. Schade, K. Ludwig, C. Bottcher, U. Hartnagel and A. Hirsch, Angew. Chem., Int. Ed., 2007, 46, 4393–4396 CrossRef CAS; H. Stahlberg, E. Kutejova, K. Suda, B. Wolpensinger, A. Lustig, G. Schatz, A. Engel and C. K. Suzuki, Proc. Natl. Acad. Sci. U. S. A., 1999, 96, 6787–6790 CrossRef CAS.
- H. Friedrich, P. E. de Jongh, A. J. Verkleij and K. P. de Jong, Chem. Rev., 2009, 109, 1613–1629 CrossRef CAS.
- A. J. Koster, R. Grimm, D. Typke, R. Hegerl, A. Stoschek, J. Walz and W. Baumeister, J. Struct. Biol., 1997, 120, 276–308 CrossRef CAS.
- A. S. Frangakis and R. Hegerl, J. Struct. Biol., 2001, 135, 239–250 CrossRef CAS.
- J. R. Kremer, D. N. Mastronarde and J. R. McIntosh, J. Struct. Biol., 1996, 116, 71–76 CrossRef.
- M. Rademacher, in Electron Tomography: Methods for the Three-Dimensional Visualization of Structures in the Cell, ed. J. Frank, Springer Science + Business Media, New York, 2006, pp. 245–274 Search PubMed.
- P. A. Midgley and M. Weyland, Ultramicroscopy, 2003, 96, 413–431 CrossRef CAS.
- J. Tong, I. Arslan and P. Midgley, J. Struct. Biol., 2006, 153, 55–63 CrossRef.
- K. J. Batenburg, S. Bals, J. Sijbers, C. Kubel, P. A. Midgley, J. C. Hernandez, U. Kaiser, E. R. Encina, E. A. Coronado and G. Van Tendeloo, Ultramicroscopy, 2009, 109, 730–740 CrossRef CAS.
- H. Friedrich, P. M. Frederik, G. De With and N. A. J. M. Sommerdijk, Angew. Chem., Int. Ed., 2010 DOI:10.1002/anie.201001493.
- W. Baumeister, Biol. Chem., 2004, 385, 865–872 CrossRef CAS . Full article available at www.reference-global.com.
- O. Medalia, I. Weber, A. S. Frangakis, D. Nicastro, G. Gerisch and W. Baumeister, Science, 2002, 298, 1209–1213 CrossRef CAS; M. Beck, V. Lucic, F. Forster, W. Baumeister and O. Medalia, Nature, 2007, 449, 611–615 CrossRef CAS.
- A. L. Parry, P. H. H. Bomans, S. J. Holder, N. A. J. M. Sommerdijk and S. C. G. Biagini, Angew. Chem., Int. Ed., 2008, 47, 8859–8862 CrossRef CAS.
- H. Von Berlepsch, C. Bottcher, K. Skrabania and A. Laschewsky, Chem. Commun., 2009, 2290–2292 RSC.
- T. M. Hermans, M. A. C. Broeren, N. Gomopoulos, P. van der Schoot, M. H. P. van Genderen, N. A. J. M. Sommerdijk, G. Fytas and E. W. Meijer, Nat. Nanotechnol., 2009, 4, 721–726 CrossRef CAS.
- H. M. H. F. Sanders, G. J. Strijkers, W. J. M. Mulder, H. R. Huinink, S. J. F. Erich, O. C. G. Adan, N. A. J. M. Sommerdijk, M. Merkx and K. Nicolay, Contrast Media Mol. Imaging, 2009, 4, 81–88 Search PubMed.
- M. R. J. Vos, M. Breurken, P. E. L. G. Leclere, P. H. H. Bomans, F. de Haas, P. M. Frederik, J. A. Jansen, R. J. M. Nolte and N. A. J. M. Sommerdijk, J. Am. Chem. Soc., 2008, 130, 12608–12609 CrossRef CAS.
- B. X. Leng, Z. Z. Shao, P. H. H. Bomans, L. J. Brylka, N. A. J. M. Sommerdijk, G. de With and W. H. Ming, Chem. Commun., 2010, 46, 1703–1705 RSC.
- M. R. Vos, P. H. H. Bomans, P. M. Frederik and N. A. J. M. Sommerdijk, Ultramicroscopy, 2008, 108, 1478–1483 CrossRef CAS.
- M. R. J. Vos, P. H. H. Bomans, F. de Haas, P. M. Frederik, J. A. Jansen, R. J. M. Nolte and N. A. J. M. Sommerdijk, J. Am. Chem. Soc., 2007, 129, 11894–11895 CrossRef CAS.
- S. Mann, B. R. Heywood, S. Rajam and J. D. Birchall, Nature, 1988, 334, 692–695 CrossRef CAS; N. A. J. M. Sommerdijk and G. de With, Chem. Rev., 2008, 108, 4499–4550 CrossRef CAS.
- P. A. Midgley, E. P. W. Ward, A. B. Hungria and J. M. Thomas, Chem. Soc. Rev., 2007, 36, 1477–1494 RSC.
- D. P. Barnard, J. N. Turner, J. Frank and B. F. Mcewen, J. Microsc. (Oxford, U. K.), 1992, 167, 39–48 Search PubMed.
- D. N. Mastronarde, J. Struct. Biol., 1997, 120, 343–352 CrossRef CAS; P. Penczek, M. Marko, K. Buttle and J. Frank, Ultramicroscopy, 1995, 60, 393–410 CrossRef CAS.
- A. Leis, B. Rockel, L. Andrees and W. Baumeister, Trends Biochem. Sci., 2009, 34, 60–70 CrossRef CAS.
- S. Nickell, R. Hegerl, W. Baumeister and R. Rachel, J. Struct. Biol., 2003, 141, 34–42 CrossRef.
- L. Jin, A. C. Milazzo, S. Kleinfelder, S. D. Li, P. Leblanc, F. Duttweiler, J. C. Bouwer, S. T. Peltier, M. H. Ellisman and N. H. Xuong, J. Struct. Biol., 2008, 161, 352–358 CrossRef; A. C. Milazzo, P. Leblanc, F. Duttweiler, L. Jin, J. C. Bouwer, S. Peltier, M. Ellisman, F. Bieser, H. S. Matis, H. Wieman, P. Denes, S. Kleinfelder and N. H. Xuong, Ultramicroscopy, 2005, 104, 152–159 CrossRef CAS; N. H. Xuong, L. Jin, S. Kleinfelder, S. D. Li, P. Leblanc, F. Duttweiler, J. C. Bouwer, S. T. Peltier, A. C. Milazzo and M. Ellisman, Cellular Electron Microscopy, 2007, vol. 79, pp. 721–739 Search PubMed.
- F. Danev, S. Kanamaru, M. Marko and K. Nagayama, J. Struct. Biol., 2010, 171, 174–181 CrossRef.
| This journal is © The Royal Society of Chemistry 2011 |
