Cell-compatible, integrin-targeted cryptophane-129XeNMR biosensors†
Garry K.
Seward
,
Yubin
Bai
,
Najat S.
Khan
and
Ivan J.
Dmochowski
*
University of Pennsylvania, Department of Chemistry, 231 South 34th St, Philadelphia, PA 19104-6323, USA. E-mail: ivandmo@sas.upenn.edu
First published on 23rd March 2011
Abstract
Peptide-modified cryptophane enables sensitive detection ofproteinanalytes using hyperpolarized 129Xe NMR spectroscopy. Here we report improved targeting and delivery of cryptophane to cells expressing αvβ3 integrin receptor, which is overexpressed in many human cancers. Cryptophane was functionalized with cyclic RGDyKpeptide and Alexa Fluor 488dye, and cellular internalization was monitored by confocal laser scanning microscopy. Competitive blocking assays confirmed cryptophaneendocytosis through an αvβ3 integrin receptor-mediated pathway. The peptide–cryptophane conjugate was determined to be nontoxic in normal human lung fibroblasts by MTT assay at the micromolar cryptophane concentrations typically used for hyperpolarized 129Xe NMR biosensing experiments. Flow cytometry revealed 4-fold higher cellular internalization in cancer cells overexpressing the integrin receptor compared to normal cells. Nanomolar inhibitory concentrations (IC50 = 20–30 nM) were measured for cryptophane biosensors against vitronectin binding to αvβ3 integrin and fibrinogen binding to αIIbβ3 integrin. Functionalization of the conjugate with two propionic acidgroups improved water solubility for hyperpolarized 129Xe NMR spectroscopic studies, which revealed a single resonance at 67 ppm for the 129Xe-cryptophane–cyclic RGDyK biosensor. Introduction of αIIbβ3 integrin receptor in detergent solution generated a new “ bound” 129Xe biosensor peak that was shifted 4 ppm downfield from the “free” 129Xe biosensor.
Introduction
Very early-stage detection of cancer in humans by magnetic resonance imaging (MRI) will require new contrast agents with greater sensitivity and molecular specificity. MRI allows non-invasive imaging of buried tissue using non-ionizing radiation, and typically involves the detection of abundant proton signals from water and fat. Lacking are specific molecular signatures for cancer biomarkers that could be employed for diagnostic purposes. Promising alternate nuclei include 129Xe, 13C, and 3He, which can be hyperpolarized to generate fairly long-lived, non-Boltzmann distributions of nuclear spins, with large magnetic resonance signals. These hyperpolarized nuclei enable physiological assays,1 and provide more sensitive MRI methods for studying proteins and metabolites than standard gadolinium chelates or iron oxide nanoparticles.2–4129Xe is particularly attractive as it is inert, has a more than 200-ppm chemical shift window in aqueous solutions, and can be hyperpolarized via optical pumping to enhance 129Xe nuclear magnetic resonance (NMR) signals by more than 10![[thin space (1/6-em)]](https://www.rsc.org/images/entities/char_2009.gif) 000-fold.5
000-fold.5
Importantly, the responsiveness of 129Xe NMR chemical shifts to the molecular environment allows the simultaneous detection of multiple species in solution. The ability to achieve ‘multiplexed’ detection of rare biomarkers would facilitate the early and accurate diagnosis of cancer and many other diseases.
Xenon exhibits significant affinity for organic cavitands such as cryptophane,6calixarene7,8 and cucurbit[6]uril.9 Most widely investigated with xenon is cryptophane-A,6 which is composed of three ethylene linkers joining two cyclotriguaiacylene units and has an internal cavity volume ∼90 Å3.10 A tricarboxylate-functionalized cryptophane-A derivative showed exceptional affinity for xenon in both water (KA = 30000 M−1) and human plasma (KA = 22000 M−1) at 37 °C.11 Importantly, cryptophane-A has been used to generate biosensors that exploit xenon's physical properties to monitor biological activity by laser-polarized 129Xe NMR spectroscopy.12,13 For example, biotin-functionalized cryptophanes produced a 1–4 ppm change in 129Xe NMR chemical shift upon streptavidin binding.13–15 More recently, a series of benzenesulfonamide-functionalized cryptophanes produced 3.0–7.5 ppm downfield shifts upon binding to carbonic anhydrase I or II.16 Improvements in xenon hyperpolarization technology17 and Hyper-CEST NMR18 remote detection strategies19 have also led to significant gains in detection sensitivity. In a recent example, MS2viral capsid modified with 125 cryptophane molecules was detected at concentrations as low as 0.7 picomolar.20
A particular focus of our lab has been the design of xenon biosensors for the early and accurate diagnosis of cancer.21 Towards this goal, cryptophane biosensors targeting matrix metalloproteinase, carbonic anhydrase, and integrin cancer biomarkers were previously synthesized.12,16,22,23 The current study provides strong evidence that cryptophane–peptide conjugates can be targeted specifically to cells that overexpress the αvβ3 integrin receptor. Integrin αvβ3 is a heterodimeric cell adhesionprotein that has been linked to both tumor angiogenesis and metastasis.24,25 The αvβ3 integrin receptor is also known to be highly up-regulated in a wide range of fast growing tumor cells, compared to minimal expression in most normal tissues, making it a broad spectrum tumor marker.26–28Peptides containing arginine–glycine–aspartic acid (RGD) sequences are known to bind the integrin receptor with high affinity (IC50 = 29 nM against 125I-echistatin, an RGD-containing snake venom peptide).29–32Probes containing multimeric or monomeric RGDpeptides have been used to image αvβ3 integrin receptor expression by fluorescence,33 MRI,28,34 and nuclear imaging techniques.35,36 In our previous study, cryptophane was targeted to cell surface integrin receptors by conjugation to a linear (RGD)4peptide.23 The cryptophane–(RGD)4 conjugate exhibited limited water solubility, likely due to intermolecular electrostatic interactions and hydrogen bonding between arginine and aspartic acid residues. This necessitated use of 10% dimethyl sulfoxide for water solubilization, and limited the range of analytical and cell characterization studies that could be performed with the cryptophane–(RGD)4 biosensor.23
Herein we describe the use of a cyclic targeting peptide, c[RGDyK], to deliver cryptophane specifically to cells expressing αvβ3 integrin receptor. While the linear RGD tetra repeat effectively binds integrin receptors, cyclic RGDpeptides are known to target αvβ3 integrin receptors with approximately 10-fold higher affinity.33 By employing a peptide ligand with higher binding affinity, the cryptophane biosensor was more effectively delivered to αvβ3 integrin-expressing cells. The c[RGDyK]-labeled cryptophane was further modified to improve water solubility and allow detection of integrin receptor by hyperpolarized 129Xe NMR spectroscopy.
Results and discussion
Synthesis of cryptophane biosensors
The synthesis of cryptophane biosensor 3 is shown in Scheme 1. Tripropargylated cryptophane1 was synthesized as previously reported with yields of 2–4%.11,16 The amine of the lysine side chain in the c[RGDyK]peptide was converted to azidopeptide 2 in greater than 95% yield by overnight reaction with triflyl azide in water, CH2Cl2 and methanol (1:1:1).37 The azidopeptide was then reacted with 1 by a copper(I)-catalyzed [3 + 2] azide–alkyne Huisgen cycloaddition in 80–89% yield38–41 and the product was purified by reverse-phase HPLC. HPLCpurification indicated the presence of two side-products that correspond to cryptophane conjugated to two or three peptides. These adducts were readily separated from biosensor 3 during HPLCpurification, allowing isolation of the desired mono-functionalized product.
![Synthesis of c[RGDyK]-labeled cryptophane biosensors.](/image/article/2011/SC/c1sc00041a/c1sc00041a-s1.gif) | ||
| Scheme 1 Synthesis of c[RGDyK]-labeled cryptophane biosensors. | ||
Biosensor 3 required addition of 150 mM NaCl to be dissolved in aqueous solution, suggesting aggregation due to an interaction between the charged residues of the c[RGDyK]peptide. Evidence of aggregation was seen at concentrations of 3 as low as 120 μM by UV-vis spectroscopy. For 129Xe NMR studies, two azidopropionic acids were reacted in 80% yield with the remaining propargyl moieties of 3 to generate biosensor 5. Biosensor 5 was soluble in pure water at concentrations of up to 250 μM, indicating a substantial improvement in water solubility.
In vitro competitive binding assay
The binding of biosensor 3 was assessed by in vitro competitive binding assays (Scheme 2) against αIIbβ3, αvβ3 and αvβ5 integrin receptors to investigate cellreceptor targeting. The resulting IC50 values are shown in Table 1. IC50 values for cyclic RAD and RGDpeptides are comparable to previously reported values for these peptides binding integrins assayed by this method.42,43 When the inhibition of vitronectin binding to immobilized avβ3 integrin receptor was examined, the IC50 value for biosensor 3 was found to be 32 nM. Compared to the c[RGDyK]peptide alone, which had an IC50 of 8 nM, biosensor 3 bound with approximately 4-fold lower affinity.![In vitro integrin competitive binding assay. One of three integrin proteins (αvβ3, αIIbβ3, αvβ5) was coated on a 96 well plate with overnight incubation. Biotinylated natural ligands (red circles) and c[RGDyK]-labeled cryptophane3 (competitive binder, blue circles) were added to the integrin and incubated for 3 h. Unbound compounds were removed with gentle washing and NeutrAvidin–HRP was added to each well. Bound NeutrAvidin–HRP was then quantified using tetramethyl benzidine horseradish peroxidase substrate.](/image/article/2011/SC/c1sc00041a/c1sc00041a-s2.gif) | ||
| Scheme 2 In vitro integrin competitive binding assay. One of three integrin proteins (αvβ3, αIIbβ3, αvβ5) was coated on a 96 well plate with overnight incubation. Biotinylated natural ligands (red circles) and c[RGDyK]-labeled cryptophane3 (competitive binder, blue circles) were added to the integrin and incubated for 3 h. Unbound compounds were removed with gentle washing and NeutrAvidin–HRP was added to each well. Bound NeutrAvidin–HRP was then quantified using tetramethyl benzidine horseradish peroxidase substrate. | ||
| αvβ3 | IC 50 (nM) | αvβ5 | |
|---|---|---|---|
| αIIbβ3 | |||
| Biosensor 3 | 31.6 ± 2.1 | 18.1 ± 2.4 | 700 |
| c[RADfK] | >5000 | >1000 | >10000 |
| c[RGDyK] | 8.2 ± 2.0 | 1.6 ± 0.6 | 200 |
Inhibition of fibrinogen binding to αIIbβ3 was also measured for 3 and the IC50 value was found to be 18 nM. This reflects approximately 10-fold weaker binding for this receptor compared to the c[RGDyK]peptide (IC50 = 1.6 nM). IC50 values for both αIIbβ3 and αvβ3 integrin proteins represent tight binding and should allow for receptor targeting during in vitro experiments.
Binding was also assessed for αvβ5 integrin receptor as it is sometimes co-expressed in tumors and can contribute to angiogenesis but is not known to bind RGD motifs.43,44 Notably little binding was observed in these binding assays. The c[RGDyK]peptide bound with an IC50 of 200 nM, while the biosensor bound with IC50 of 700 nM, indicating a high degree of specificity of biosensor 3 for αvβ3 integrin receptors.
Viability studies
Cell viability for 3 was measured by MTT assays in NCI-H1975 lung carcinoma cells, AsPC-1 pancreatic carcinoma and HFL-1 lung fibroblasts after 24 h exposure to increasing concentrations of 3, as shown in Fig. 1. Viability was reduced by 50% at a cryptophane concentration between 75 and 100 μM in AsPC-1 and NCI-H1975cell cultures. The biosensor showed lowest toxicity in the HFL-1 cell line. A 50% reduction in viability was not observed in HFL-1 fibroblasts, indicating minimal toxicity in normal human cells at the concentrations of interest for performing 129Xe NMR biosensing experiments. Increased cytotoxicity in AsPC-1 and NCI-H1975cell cultures was likely due to higher expression levels of αvβ3 integrin receptors in cancer cell lines,29,30 leading to increased cellular uptake of cryptophane. Maximum toxicity was found to be 61% in AsPC-1 and 57% in NCI-H1975cells with 100 μM biosensor 3. These toxicity values are in agreement with previously measured cell-permeable cryptophanes.23 In a previous study we found that when a linear RGDpeptide was attached to cryptophane and tested in cells, maximum toxicity was in the range of 30–40% in both cancerous and non-cancerous cells after 24 h incubation at 100 μM concentration.23 Biosensor 3 was similarly toxic in the non-cancerous HFL-1 fibroblasts, reaching a maximum toxicity of 40% after 24 h incubation at 100 μM concentration.![Viability of AsPC-1 (blue), HFL-1 (red) and NCI-H1975 (yellow) cells after treatment with increasing concentrations of c[RGDyK]-labeled cryptophane3. % Viability was measured by MTT assay after 24 h incubation with increasing concentrations of 3 as compared with untreated cells.](/image/article/2011/SC/c1sc00041a/c1sc00041a-f1.gif) | ||
| Fig. 1 Viability of AsPC-1 (blue), HFL-1 (red) and NCI-H1975 (yellow) cells after treatment with increasing concentrations of c[RGDyK]-labeled cryptophane3. % Viability was measured by MTT assay after 24 h incubation with increasing concentrations of 3 as compared with untreated cells. | ||
Cellular uptake
Uptake of Alexa Fluor 488-labeled c[RGDyK]-cryptophane4 by cells was monitored by confocal laser scanning microscopy (Fig. 2). Incubation of AsPC-1 (Fig. 2A) and HFL-1 (Fig. 2E) cells with 4 (1 μM) for 1 h gave bright fluorescence throughout the cell interior. When cells were co-incubated with 4 and a 10-fold excess of c[RADfK]peptide (which is known to be a weak binder of the αvβ3 integrin receptor), levels of fluorescence remained throughout the cell interior (Fig. 2B and 2F). From confocal images, cellular fluorescence was observed to decrease significantly when 4 was co-incubated with a 10-fold excess of either c[RGDyK]peptide (Fig. 2C and 2G) or anti-αvantibody (Fig. 2D and 2H), both of which target αvβ3 integrin receptor with high affinity. Both the antibody and peptide control blocked cryptophane biosensor binding and inhibited receptor-mediated endocytosis from occurring in these cell lines. These co-incubation studies strongly suggest that the c[RGDyK]-labeled cryptophane is specifically recognized by αvβ3 integrin receptor and the αvβ3 subunit is necessary for efficient cellular uptake. This also indicates that the water-soluble cryptophane without a targeting moiety is not delivered to cells as no uptake was seen when blocking controls were done. This differs from results obtained with a less water-soluble dicarboxylic acid cryptophane, which was shown recently to partition from water into suspensions of Intralipid®vesicles.45![Uptake of 1 μM Alexa Fluor 488-labeled c[RGDyK]-cryptophane4 targeting AsPC-1cells (A–D) and HFL-1 cells (E–H). Micrographs show 4 uptaken by cells after 1 h incubation (A, E). Targeting of 4 was relatively unaffected by co-incubation with 10 μM c[RADfK] (B, F). However, uptake of 4 was blocked by co-treatment with 10 μM c[RGDyK]peptide (C, G) and 0.15 mg mL−1 anti-αvantibody (D, H).](/image/article/2011/SC/c1sc00041a/c1sc00041a-f2.gif) | ||
| Fig. 2 Uptake of 1 μM Alexa Fluor 488-labeled c[RGDyK]-cryptophane4 targeting AsPC-1cells (A–D) and HFL-1 cells (E–H). Micrographs show 4 uptaken by cells after 1 h incubation (A, E). Targeting of 4 was relatively unaffected by co-incubation with 10 μM c[RADfK] (B, F). However, uptake of 4 was blocked by co-treatment with 10 μM c[RGDyK]peptide (C, G) and 0.15 mg mL−1 anti-αvantibody (D, H). | ||
Cellular internalization of 4 was further confirmed by flow cytometry. As shown in Fig. 3, significant amounts of cell-associated fluorescence were observed after 1 h incubation in both AsPC-1 and HFL-1 cell lines. Fluorescence remained at similar intensities when AsPC-1 and HFL-1 cells were co-incubated with fluorescent biosensor 4 and a 10-fold excess of c[RADfK]peptide. However, when 4 was co-incubated with 10-fold excess of either c[RGDyK]peptide or the anti-αvantibody, both of which bind integrin protein with high affinity, fluorescence intensities were reduced to background level. Flow cytometry also confirmed greater internalization of 4 in AsPC-1cells when compared to HFL-1 cells. Mean fluorescence intensities after incubation with cryptophane were approximately four times higher in AsPC-1cells than in HFL-1. This higher uptake is attributed to increased expression of the target receptor in cancer cell lines versus normal fibroblasts.29,30 These results were expected as HFL-1 cells are known to have minimal αvβ3 integrin receptor expression unless activated by a smooth muscle actin or transforming growth factor β.46–48
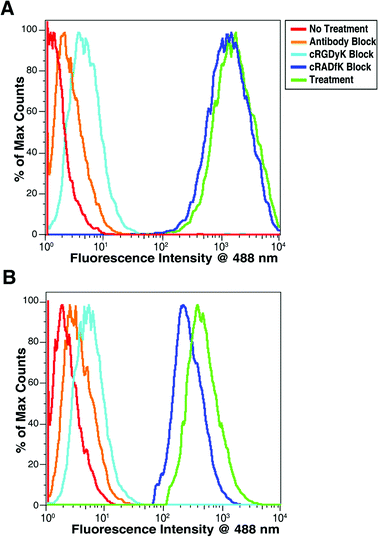 | ||
| Fig. 3 Flow cytometry data for (A) AsPC-1 and (B) HFL-1 cells after incubation with 1 μM 4. Mean fluorescence intensities at 488 nm after treatment with cryptophane were 2100 for AsPC-1cells (green, in A) and 580 for HFL-1 cells (green, in B). Mean fluorescence intensities for all conditions are listed in Table S1 of the supporting information.† | ||
In our previous study, a linear tetrameric RGDpeptide was used to target cryptophane to human fibroblasts and cancer cells expressing αvβ3 integrin receptor.23 Fluorometric quantitation of 100 μL volumes of cell lysate showed that 0.08 nmol of dye-labeled cryptophane was delivered to the cell population over a 24 h incubation period. This led to an estimate of the intracellularcryptophane concentration in the range of 100–160 μM. In the present study, 4 showed higher uptake after a shorter 1.5 h incubation, achieving 990 nM in cell lysates, which corresponds to delivery of about 0.1 nmol of 4 into live cells. In this case, it was possible to determine the concentration of dye label by UV-vis spectroscopy. Additionally, after 3 h incubation the concentration in the cell lysate solution increased to 1.5 μM. The average volume of the cell was calculated based on the diameter of AsPC-1cells in suspension (∼40 microns), and the fraction of the 100 μL lysate solution volume originally occupied by AsPC-1cells was found to be 0.0075. Using these calculations, the intracellular concentration of biosensor 4 was estimated to be in the range of 130–200 μM after 3 h incubation, indicating that a small improvement in cellular delivery was achieved using c[RGDyK] relative to the previously studied (RGD)4peptide.23 This was likely due to the higher binding affinity of c[RGDyK] relative to (RGD)4 for αvβ3 integrin cell surface receptors.
Hyperpolarized 129Xe NMR studies
To improve cryptophane solubility, and achieve concentrations useful for 129Xe NMR studies, the two remaining propargyl groups on biosensor 3 were reacted with azidopropionic acid by an additional [3 + 2] cycloaddition reaction, yielding 5. The propionic acidgroups conferred substantial gains in solubility, allowing the collection of a hyperpolarized 129Xe NMR spectrum in PBS buffer. Hyperpolarized 129Xe NMR spectra of compound 5 were acquired in three different solutions. Fig. 4a shows 5 (100 μM) dissolved in Tris buffer (1 mM, pH 7.2), which gave a 129Xe NMR chemical shift at 65.8 ppm. The two enantiomers of 5 produced just one 129Xe NMR resonance with a line width of 80 Hz (0.57 ppm), which is similar to results we obtained with previous cryptophane biosensors.16![Hyperpolarized 129Xe NMR spectra of biosensor 5 alone, binding αIIbβ3 integrin, and blocked by c[RGDyK], all studies in Tris buffer (1 mM, pH 7.2) (a) 5 gave 129Xe NMR chemical shift at 65.8 ppm. (b) 5 and αIIbβ3 integrin in Tris buffer with 30% glycerol and 0.1% Triton X-100. “Free” biosensor gave 129Xe NMR chemical shift at 67.1 ppm, which was shifted 1.3 ppm downfield from “free” biosensor in (a) due to addition of glycerol. “Bound” biosensor appeared at 71.2 ppm, representing a 4.1 ppm downfield shift. (c) c[RGDyK] added to solution of 5 and αIIbβ3 integrin gave “free” biosensor at the same 129Xe NMR chemical shift, but no “bound” biosensor was detected.](/image/article/2011/SC/c1sc00041a/c1sc00041a-f4.gif) | ||
| Fig. 4 Hyperpolarized 129Xe NMR spectra of biosensor 5 alone, binding αIIbβ3 integrin, and blocked by c[RGDyK], all studies in Tris buffer (1 mM, pH 7.2) (a) 5 gave 129Xe NMR chemical shift at 65.8 ppm. (b) 5 and αIIbβ3 integrin in Tris buffer with 30% glycerol and 0.1% Triton X-100. “Free” biosensor gave 129Xe NMR chemical shift at 67.1 ppm, which was shifted 1.3 ppm downfield from “free” biosensor in (a) due to addition of glycerol. “Bound” biosensor appeared at 71.2 ppm, representing a 4.1 ppm downfield shift. (c) c[RGDyK] added to solution of 5 and αIIbβ3 integrin gave “free” biosensor at the same 129Xe NMR chemical shift, but no “bound” biosensor was detected. | ||
In Fig. 4b, 5 (50 μM) and αIIbβ3 integrin (16 μM) were mixed in Tris buffer (1 mM, pH 7.2) with 30% glycerol and 0.1% Triton X-100. The αIIbβ3 integrin was chosen instead of αvβ3 integrin, due to the relative ease of isolating and lower cost of purchasing milligram quantities of this protein. Keeping the αIIbβ3 integrin membraneprotein in solution required addition of glycerol and Triton X-100, and glycerol also mitigated foaming while introducing xenon gas. “Free” cryptophane gave a 129Xe NMR peak at 67.1 ppm, while “bound” cryptophane appeared at 71.2 ppm, representing a 4.1 ppm downfield shift. Signal-to-noise ratio for the single “bound” cryptophane–protein peak was ∼3:1. With the racemic mixture of biosensors, protein binding results inevitably in diastereomers, which in some cases can produce multiple “bound” 129Xe NMR peaks. We have seen single “bound” peaks previously in cases where the cryptophane enantiomers are constrained near the protein target surface, and the xenon by chance senses the environment identically inside both biosensors.16 The short alkyl spacer for c[RGDyK]peptide in 5 may similarly tether both cryptophane biosensor racemates at the integrin receptor, effectively creating one xenonbinding site. Alternatively, a second peak corresponding to the other diastereomer may reside under the “free” peak (∼67 ppm).
The NMR binding assay described above was constrained by a number of experimental factors. The concentrations were selected to achieve a balance between the detection limit of our current 129Xe NMR data collection method and the well documented aggregation behavior of this integrin protein. Integrin protein aggregates at concentrations greater than 9 μM in solution without detergent, thus we limited experiments to 16–20 μM integrin receptor with detergent.49,50 Another reason for the “bound” signal being weak is the broad line width compared to some xenon biosensors bound to other protein targets (avidin, 0.15 ppm; carbonic anhydrase I and II, 0.19–0.27 ppm16). In other cases, it has been observed that “bound” peaks for many xenon biosensors are considerably broadened (10–30 Hz to 100–150 Hz,14 and even 1–5 kHz20). Although peak broadening tends to be an obstacle in identifying peaks in high-resolution NMR spectra, this problem will be mitigated in a saturation transfer scheme (Hyper-CEST).18 Given that we observe a 4 ppm chemical shift change upon integrin binding, the “bound” and “free” peaks can be selectively saturated easily. This change in chemical shift is comparable to our previous carbonic anhydrase biosensor work (3.0–7.5 ppm)16 and a biosensor optimization study with biotin–avidin (3–4 ppm).14 Considerably smaller 129Xe NMR chemical shifts were observed in two related protein-binding studies (biotin–avidin, ∼1 ppm;13 major histocompatibility complex, ∼1 ppm51).
To make a competition assay (Fig. 4c), c[RGDyK] (100 μM) was added to a fresh solution (1 mM Tris buffer, pH 7.2; 30% glycerol and 0.1% Triton X-100) containing biosensor 5 (100 μM) and αIIbβ3 integrin (20 μM). Here “free” cryptophane gave the same 129Xe NMR chemical shift, and no “bound” cryptophane was detected, which indicated that the peptide blocked 5 from binding to αIIbβ3 integrin. The disappearance of the smaller “bound” peak after addition of the competing peptide further confirmed that the spectral change observed upon addition of αIIbβ3 is due to protein binding by the cryptophane biosensor.
Conclusions
This work represents the first in-depth investigation of a xenonNMR biosensor binding to proteins that are well recognized cancer biomarkers and cell surface receptors. As such, we were forced to confront challenges of poor solubility and aggregation behavior involving both the integrin receptor and the biosensor itself. We worked to engineer specific molecular interactions with the αvβ3 integrin cancer biomarker and distinguish cancer cells from healthy cells based on cell uptake properties. This work was accomplished by conjugating the αvβ3 integrin receptor-targeting peptidec[RGDyK] to a tripropargyl derivative of cryptophane-Avia a [3 + 2] cycloaddition reaction. This biosensor (3) was found to bind αvβ3 and αIIbβ3 integrin receptorproteins with the expected nanomolar affinity (IC50 = 20–30 nM), thus ensuring the possibility of cellreceptor targeting. The in vitro integrin competitive binding assay confirmed that the cryptophane had little effect on integrin receptor binding. Cryptophane was found to be only moderately toxic to normal lung fibroblasts at relevant biosensing concentrations although 50% viability was reached in the cancer cell lines studied at concentrations of 75–100 μM.Biosensor 4, labeled with Alexa Fluor 488, was useful for fluorescence microscopy and flow cytometry experiments. These studies confirmed that cryptophane was specifically targeted and delivered into cells by an αvβ3 integrin receptor-mediated pathway. Quantification of cellular delivery indicated that internalization occurs at concentrations suitable for hyperpolarized 129Xe NMR studies. Most importantly, internalization was notably higher in AsPC-1 cancer cells compared to fibroblasts from the human lung, suggesting potential for targeted delivery of cryptophanes in future in vivo studies.
To perform successful 129Xe magnetic resonance experiments two propionic acidgroups were added to 3, generating biosensor 5 with greatly increased cryptophane solubility in aqueous media. Upon binding to the αIIbβ3 integrin receptor, the hyperpolarized 129Xe NMR chemical shift showed a change of about 4 ppm downfield. This chemical shift change is comparable to results we obtained previously with xenon biosensors targeting human carbonic anhydrase I and II,16,22 and represents one of the largest protein-mediated 129Xe NMR chemical shift changes observed to date. Having demonstrated the compatibility of xenon biosensors with cells and the ability to target specific protein receptors and achieve large hyperpolarized 129Xe NMR chemical shift changes, these studies pave the way for cellular spectroscopy and imaging experiments.
Experimental
Synthesis of peptide–cryptophane conjugate 3 and fluorescently labeled conjugate 4
A [3 + 2] cycloaddition reaction between azide-functionalized c[RGDyK]peptide and tripropargyl cryptophane1 was performed to generate the mono-functionalized peptide–cryptophane conjugate 3 (Scheme 1) following a previously reported protocol.12 The tripropargylated derivative of cryptophane-A1 was synthesized as previously described.11,16Tripropargyl cryptophane1 (37.3 mg, 0.0390 mmol) was dissolved in DMSO. An aqueous solution of copper(II) sulfate (0.6 mg, 0.004 mmol, 0.1 equiv.) was added to the solution, followed by the addition of azidopeptide 2 (25.0 mg, 0.0390 mmol, 1.0 equiv.), 2,6-lutidine (0.8 mg, 0.007 mmol, 0.2 equiv.) and sodium ascorbate (344.0 mg, 1.737 mmol, 45 equiv.). The suspension was degassed with N2 and stirred at r.t. overnight. The reaction mixture was passaged through a 0.22 micron filter. Confirmation of the reaction was obtained by analytical HPLC using a gradient: time 0, A/B = 85/15; 0–45 min, linear increase to A/B = 40/60; time 45–47 min, linear change to A/B = 20/80. Biosensor 3 was purified by semi-preparative HPLC as shown in the supporting information (Figure S2).† The extinction coefficient for 3 at 280 nm was determined: ε280 = 13400 M−1 cm−1. MALDI MS (C87H95N11O20) [M + H+]: calcd, 1614.74; found, 1616.60.
Biosensor 3 was reacted with Alexa Fluor 488azide by a [3 + 2] azide–alkynecycloaddition to give fluorescently labeled biosensor 4, following the manufacturer protocol. Analytical HPLC was performed using a gradient: time 0, A/B = 85/15; 0–45 min, linear increase to A/B = 40/60; time 45–47 min, linear change to A/B = 20/80. Semi-preparative HPLC was performed as shown in the supporting information (Figure S3).†Dyeconjugation was determined to occur in 85% yield, based on the absorbances measured at 494 nm (ε494 = 71000 M−1 cm−1) and 280 nm (ε280 = 21300 M−1 cm−1). MALDI MS (C114H119N17O30S2) [M + H+]: calcd, 2269.78; found, 2263.06.
Synthesis of c[RGDyK]-cryptophane biosensor 5 with improved water solubility
The c[RGDyK]-conjugated cryptophane3 was reacted with azidopropionic acid to generate a more water-soluble biosensor 5 for 129Xe NMR studies. Azidopropionic acid was generated according to previously reported protocols.12,16,523 (10.0 mg, 0.00600 mmol) was dissolved in DMSO. To this solution the azidopropionic acid (2.8 mg, 0.024 mmol, 4.0 equiv.) was added followed by the addition of 2,6-lutidine (0.1 mg, 0.001 mmol, 0.2 equiv.), an aqueous solution of copper(II) sulfate (0.003 mmol, 0.5 equiv.), and sodium ascorbate (53.5 mg, 0.270 mmol, 45 equiv.). Reaction progress was monitored by analytical HPLC using a gradient: time 0, A/B = 85/15; 0–45 min, linear increase to A/B = 40/60; time 45–47 min, linear change to A/B = 20/80; 47–57 min, A/B = 20/80. Biosensor 5 was purified by semi-preparative HPLC as shown in Figure S4 in the supporting information.† The extinction coefficient for 5 at 280 nm was determined: ε280 = 13700 M−1 cm−1. MALDI MS (C93H104N17O24) [M + H+]: calcd, 1843.92; found, 1845.90.
Cell viability assays
Cells were plated at 10000 cells per well in 96 well plates and grown overnight at 37 °C. Biosensor 3 was then added from a stock solution in DPBS to wells in triplicate at final concentrations of 2, 10, 25, 50, 75 and 100 μM and incubated for 24 h. The medium was removed and the cells were washed three times with DPBS before being treated with 20 μL of 5.0 mg mL−1 MTT solution for 2 h. The medium was removed once more and the resulting crystals were dissolved in DMSO. Absorbance at 540 nm was recorded in each well using the plate reader. Absorbance from wells not containing cells was subtracted as background, and the reduction in cell growth was calculated as a percentage of the absorbance in the absence of any treatment. Data show the mean of at least three independent experiments ± SD.
Cell uptake studies by confocal microscopy
Cells were plated at 20000 cells per well and grown to confluence in LabTek 8-well microscope slides with glass coverslip bottoms. For uptake studies, cells were incubated with 1 μM solutions of Alexa Fluor 488-labeled c[RGDyK]cryptophane4 for 1 h. For blocking studies, cells were co-incubated for 1 h with a 10 μM solution of c[RGDyK] (blocking) or c[RADfK] (negative control) peptide containing D-phenylalanine in addition to 1 μM 4. In the antibody blocking studies, cells were co-incubated with 0.15 mg mL−1 blocking anti-αvantibody and 1 μM 4. To visualize the results, the medium was removed and the cells were washed three times with DPBS before adding DMEM containing no phenol red. Cells were visualized using an Olympus FV1000 confocal laser scanning microscope with 488 nm argon-ion laser excitation and Cy3 emission filter under 40× magnification (Olympus UApo/340 40x, 1.15 W).
Flow cytometry
T-25 cell culture flasks were inoculated with 1.5 million viable cells in RPMI-1640 medium (5 mL) and incubated at 37 °C overnight. Then, the medium was removed and 2 mL of fresh RPMI-1640 was added. 4 (1 μM final concentration) was then added to the flask and incubated for 1 h. For blocking studies cells were co-incubated with 0.15 mg mL−1 anti-αvantibody, 10 μM c[RGDyK] (blocking), or 10 μM c[RADfK] (negative control) for 1 h. The cells were then washed with PBS three times and trypsinized. After centrifugation, the cell pellet was resuspended in a solution of 10% FBS in Dulbecco's PBS, and these cells were analyzed by flow cytometry.Cellular uptake monitored by UV-vis spectroscopy
AsPC-1 cells were plated in 96 well plates at 10000 cells per well and incubated overnight at 37 °C. 4 was added to each well at a concentration of 10 μM and placed back in the incubator. After 1.5 h incubation, the cells were removed and rinsed three times with DPBS solution. Triton X-100 solution (0.25%, 100 μL) was then added to lyse the cells and after 20 min the UV-vis absorbance at 494 nm was measured.
Isolation of αIIbβ3 integrin receptor from human blood platelets
Human blood platelet suspensions were obtained from Joel S. Bennett (UPenn School of Medicine). The αIIbβ3 integrin protein was isolated from platelets using a modified procedure.53Platelets were lysed by rapid nitrogen decompression in a cell bomb, with nitrogen supplied at 1200–1500 psi for 5 min, followed by opening of the release valve. Platelets were collected in 50 mL Falcon tubes and kept on ice. The platelet lysate was then centrifuged at 7000 g for 15 min at 4 °C. The supernatant was decanted and centrifuged at 30,000 g for 1 h at 4 °C. The resulting pellet was resuspended in 0.2% Triton X-100 in Tris buffer (200 mM Tris, 1 mM MgCl2, 1 mM CaCl2, pH 7.2). The resuspended pellet was added to SP Sepharose that had been prewashed with buffer (30 mL) and mixed for 1 h at 4 °C. The unbound fraction was removed and loaded onto prewashed concanavalin A-sepharose 4B resin (Sigma) and mixed for 2 h at 4 °C. The unbound fraction was removed. The bound fraction was eluted with buffer plus 100 mM methyl-α-D-mannopyranoside. Fractions containing protein were pooled and concentrated using Millipore centrifugal filter units (MWCO, 30000 Da). Protein purity was analyzed by SDS-PAGE, which showed the presence of two bands with molecular weights of 100 and 120 kDa. These bands corresponded to the αIIb and β3 subunits, respectively.53 Isolation yielded 2.5 mg of protein from 300 mL of platelet lysates.
In vitro competitive binding assay
c[RGDyK]-conjugated cryptophane3 was tested for its ability to inhibit fibrinogen binding to purified human αIIbβ3 integrin receptor, the attachment of vitronectin to purified αvβ3 integrin receptor, and the attachment of fibronectin to αvβ5 integrin receptor. Integrin protein was added to 96-well polystyrene microtiter plates at 0.1 μg well−1. After overnight incubation at 4 °C, the plates were washed and then blocked with milk solution at r.t. for 2 h. The blocking buffer was removed, and 3 was added to wells at concentrations from 0.001 nM to 10 μM. Biotinylated fibrinogen, fibronectin or vitronectin solution (0.1 μg well−1) was then added to each well as a standard competitor. The plates were incubated at r.t. for 3 h, washed, and the bound biotinylated substrate was detected using NeutrAvidin-HRP conjugate at 0.01 μg well−1 and TMB substrate system. Absorbance at 450 nm was read by a UV-vis plate reader. The concentration of inhibitor producing 50% inhibition (IC50) of fibrinogen or vitronectin binding to integrin protein was calculated using BioDataFit (Chang Biosciences, Castro Valley, CA) with the four parameter Hill Slope model to eqn (1):| a + (b − a)/(1 + 10(x − c)d) | (1) |
Hyperpolarized 129Xe NMR spectroscopy
Hyperpolarized 129Xe was generated using a home-built 129Xe hyperpolarizer, which is based on the formerly commercially available Nycomed-Amersham (now GE) IGI.Xe.2000 system. A gas mixture of 89% N2, 10% He, and 1% natural abundance Xe (Spectra Gases) was flowed through the hyperpolarizer. 129Xe was hyperpolarized to 10–15% after cryogenically separated, accumulated, thawed, and collected in CAVNMR tubes (New Era). After Xe collection, NMR tubes were shaken vigorously to mix cryptophane solutions with Xe.All 129Xe NMR measurements were carried out on a 500 MHz Bruker BioDRX NMR spectrometer. RF pulse frequency for 129Xe was 138.12 MHz. Samples were observed using either a 5 mm PABBONMRprobe or a similar 10 mm probe.
129Xe NMR spectra were acquired using the exchange signal averaging (ESA) method.54 Selective pulses (90° flip angle, EBurp1 shaped) were generated at the Xe@cryptophane resonance frequencies. Each pulse lasted 5 ms, which gave a designated excitation region ∼1 kHz (∼7.2 ppm). All spectra were signal averaged by 40 scans. A delay of 0.15 s was given between scans to allow polarized Xe to exchange in and depolarized Xe to exchange out of the cryptophane cavity. The natural line widths of Xe@cryptophane peaks are around 80 Hz (FWHM, Lorentzian fitted). The spectra shown above are exponentially broadened by 100 Hz, to give larger signal/noise ratio. Sample temperature was controlled by VT unit on NMR spectrometer to 27 ± 1 °C.
Acknowledgements
We thank Scott Diamond for access to the 2102 Envision Multilabel Microplate Reader and Bill Degrado and Joel Bennett for help with isolating αIIbβ3 integrin. This work was supported by NIH CA110104 and DOD BC061527.Notes and references
- R. T. Branca, Z. I. Cleveland, B. Fubara, C. S. S. R. Kumar, R. R. Maronpot, C. Leuschner, W. S. Warren and B. Driehuys, Proc. Natl. Acad. Sci. U. S. A., 2010, 107, 3693–3697 CrossRef CAS.
- K. Golman, R. I. Zandt, M. Lerche, R. Pehrson and J. H. Ardenkjaer-Larsen, Cancer Res., 2006, 66, 10855–10860 CrossRef CAS.
- J. P. Mugler, B. Driehuys, J. R. Brookeman, G. D. Cates, S. S. Berr, R. G. Bryant, T. M. Daniel, E. E. de Lange, J. H. Downs, 3rd, C. J. Erickson, W. Happer, D. P. Hinton, N. F. Kassel, T. Maier, C. D. Phillips, B. T. Saam, K. L. Sauer and M. E. Wagshul, Magn. Reson. Med., 1997, 37, 809–815 CrossRef.
- S. R. Hopkins, D. L. Levin, K. Emami, S. Kadlecek, J. Yu, M. Ishii and R. R. Rizi, J. Appl. Physiol., 2007, 102, 1244–1254.
- P. Berthault, G. Huber and H. Desvaux, Prog. Nucl. Magn. Reson. Spectrosc., 2009, 55, 35–60 CrossRef CAS.
- T. Brotin and J. P. Dutasta, Chem. Rev., 2009, 109, 88–130 CrossRef CAS.
- E. B. Brouwer, G. D. Enright and J. A. Ripmeester, Chem. Commun., 1997, 939–940 RSC.
- G. D. Enright, K. A. Udachin, I. L. Moudrakovski and J. A. Ripmeester, J. Am. Chem. Soc., 2003, 125, 9896–9897 CrossRef CAS.
- Y. Miyahara, K. Abe and T. Inazu, Angew. Chem., Int. Ed., 2002, 41, 3020–3023 CrossRef CAS.
- O. Taratula, P. A. Hill, N. S. Khan, P. J. Carroll and I. J. Dmochowski, Nat. Commun., 2010, 1, 148 Search PubMed.
- P. A. Hill, Q. Wei, R. G. Eckenhoff and I. J. Dmochowski, J. Am. Chem. Soc., 2007, 129, 9262–9263 CrossRef CAS.
- Q. Wei, G. K. Seward, P. A. Hill, B. Patton, I. E. Dimitrov, N. N. Kuzma and I. J. Dmochowski, J. Am. Chem. Soc., 2006, 128, 13274–13283 CrossRef CAS.
- M. M. Spence, S. M. Rubin, I. E. Dimitrov, E. J. Ruiz, D. E. Wemmer, A. Pines, S. Q. Yao, F. Tian and P. G. Schultz, Proc. Natl. Acad. Sci. U. S. A., 2001, 98, 10654–10657 CrossRef CAS.
- T. J. Lowery, S. Garcia, L. Chavez, E. J. Ruiz, T. Wu, T. Brotin, J. P. Dutasta, D. S. King, P. G. Schultz, A. Pines and D. E. Wemmer, ChemBioChem, 2006, 7, 65–73 CrossRef CAS.
- C. Hilty, T. J. Lowery, D. E. Wemmer and A. Pines, Angew. Chem., Int. Ed., 2006, 45, 70–73 CrossRef CAS.
- J. M. Chambers, P. A. Hill, J. A. Aaron, Z. Han, D. W. Christianson, N. N. Kuzma and I. J. Dmochowski, J. Am. Chem. Soc., 2009, 131, 563–569 CrossRef CAS.
- F. W. Hersman, I. C. Ruset, S. Ketel, I. Muradian, S. D. Covrig, J. Distelbrink, W. Porter, D. Watt, J. Ketel, J. Brackett, A. Hope and S. Patz, Acad. Radiol., 2008, 15, 683–692 CrossRef.
- L. Schroder, T. J. Lowery, C. Hilty, D. E. Wemmer and A. Pines, Science, 2006, 314, 446–449 CrossRef.
- A. J. Moulé, M. M. Spence, S.-I. Han, J. A. Seeley, K. L. Pierce, S. Saxena and A. Pines, Proc. Natl. Acad. Sci. U. S. A., 2003, 100, 9122–9127 CrossRef CAS.
- T. Meldrum, K. L. Seim, V. S. Bajaj, K. K. Palaniappan, W. Wu, M. B. Francis, D. E. Wemmer and A. Pines, J. Am. Chem. Soc., 2010, 132, 5936–5937 CrossRef CAS.
- O. Taratula and I. J. Dmochowski, Curr. Opin. Chem. Biol., 2010, 14, 97–104 CrossRef CAS.
- J. A. Aaron, J. M. Chambers, K. M. Jude, L. Di Costanzo, I. J. Dmochowski and D. W. Christianson, J. Am. Chem. Soc., 2008, 130, 6942–6943 CrossRef CAS.
- G. K. Seward, Q. Wei and I. J. Dmochowski, Bioconjugate Chem., 2008, 19, 2129–2135 CrossRef CAS.
- T. V. Byzova, C. K. Goldman, N. Pampori, K. A. Thomas, A. Bett, S. J. Shattil and E. F. Plow, Mol. Cell, 2000, 6, 851–860 CAS.
- T. V. Byzova, W. Kim, R. J. Midura and E. F. Plow, Exp. Cell Res., 2000, 254, 299–308 CrossRef CAS.
- R. A. Cairns, R. Khokha and R. P. Hill, Curr. Mol. Med., 2003, 3, 659–671 Search PubMed.
- B. Felding-Habermann, Clin. Exp. Metastasis, 2003, 20, 203–213 CrossRef CAS.
- W. Cai and X. Chen, J. Nucl. Med., 2008, 49(Suppl. 2), 113S–128S CrossRef CAS.
- M. D. Pierschbacher, E. G. Hayman and E. Ruoslahti, J. Cell. Biochem., 1985, 28, 115–126 CrossRef CAS.
- M. D. Pierschbacher and E. Ruoslahti, Nature, 1984, 309, 30–33 CrossRef CAS.
- E. Ruoslahti, Annu. Rev. Cell Dev. Biol., 1996, 12, 697–715 CrossRef CAS.
- E. Ruoslahti and M. D. Pierschbacher, Cell, 1986, 44, 517–518 CrossRef CAS.
- Y. P. Ye, S. Bloch, B. G. Xu and S. Achilefu, J. Med. Chem., 2006, 49, 2268–2275 CrossRef CAS.
- J. Xie, K. Chen, H.-Y. Lee, C. Xu, A. R. Hsu, S. Peng, X. Chen and S. Sun, J. Am. Chem. Soc., 2008, 130, 7542–7543 CrossRef CAS.
- X. Y. Chen, Mini-Rev. Med. Chem., 2006, 6, 227–234 CrossRef CAS.
- I. Dijkgraaf, A. J. Beer and H. J. Wester, Front. Biosci., 2009, 14, 887–899 CrossRef CAS.
- P. B. Alper, S. C. Hung and C. H. Wong, Tetrahedron Lett., 1996, 37, 6029–6032 CrossRef CAS.
- C. W. Tornoe, C. Christensen and M. Meldal, J. Org. Chem., 2002, 67, 3057–3064 CrossRef CAS.
- H. C. Kolb, M. G. Finn and K. B. Sharpless, Angew. Chem., Int. Ed., 2001, 40, 2004–2021 CrossRef CAS.
- V. V. Rostovtsev, L. G. Green, V. V. Fokin and K. B. Sharpless, Angew. Chem., Int. Ed., 2002, 41, 2596–2599 CrossRef CAS.
- S. Punna, J. Kuzelka, Q. Wang and M. G. Finn, Angew. Chem., Int. Ed., 2005, 44, 2215–2220 CrossRef CAS.
- E. H. Lim, N. Danthi, M. Bednarski and K. C. Li, Nanomed.: Nanotechnol., Biol. Med., 2005, 1, 110–114 CrossRef CAS.
- F. Li, J. Liu, G. S. Jas, J. Zhang, G. Qin, J. Xing, C. Cotes, H. Zhao, X. Wang, L. A. Diaz, Z. Z. Shi, D. Y. Lee, K. C. Li and Z. Li, Bioconjugate Chem., 2010, 21, 270–278 CrossRef CAS.
- R. Nisato, J.-C. Tille, A. Jonczyk, S. Goodman and M. Pepper, Angiogenesis, 2003, 6, 105–119 CrossRef CAS.
- T. Meldrum, L. Schröder, P. Denger, D. E. Wemmer and A. Pines, J. Magn. Reson., 2010, 205, 242–246 CrossRef CAS.
- D. V. Pechkovsky, A. K. Scaffidi, T. L. Hackett, J. Ballard, F. Shaheen, P. J. Thompson, V. J. Thannickal and D. A. Knight, J. Biol. Chem., 2008, 283, 12898–12908 CrossRef CAS.
- A. K. Scaffidi, Y. P. Moodley, M. Weichselbaum, P. J. Thompson and D. A. Knight, J. Cell Sci., 2001, 114, 3507–3516 CAS.
- A. K. Scaffidi, N. Petrovic, Y. P. Moodley, M. Fogel-Petrovic, K. M. Kroeger, R. M. Seeber, K. A. Eidne, P. J. Thompson and D. A. Knight, J. Biol. Chem., 2004, 279, 37726–37733 CrossRef CAS.
- A. Nogales, C. García, J. Pérez, P. Callow, T. A. Ezquerra and J. González-Rodríguez, J. Biol. Chem., 2010, 285, 1023–1031 CrossRef CAS.
- G. Rivas, K. Tangemann, A. P. Minton and J. Engel, J. Mol. Recognit., 1996, 9, 31–38 CrossRef CAS.
- A. Schlundt, W. Kilian, M. Beyermann, J. Sticht, S. Gunther, S. Hopner, K. Falk, O. Roetzschke, L. Mitschang and C. Freund, Angew. Chem., Int. Ed., 2009, 48, 4142–4145 CrossRef CAS.
- J. E. Leffler and R. D. Temple, J. Am. Chem. Soc., 1967, 89, 5235–5246 CrossRef CAS.
- M. C. Hillman, N. I. Zolotarjova, D. R. Patrick, D. D. McCabe, K. Shen, J. I. Corman, J. T. Billheimer, D. A. Seiffert, G. F. Hollis and R. Wynn, Protein Expression Purif., 2002, 25, 494–502 CrossRef CAS.
- M. M. Spence, E. J. Ruiz, S. M. Rubin, T. J. Lowery, N. Winssinger, P. G. Schultz, D. E. Wemmer and A. Pines, J. Am. Chem. Soc., 2004, 126, 15287–15294 CrossRef CAS.
Footnote |
| † Electronic supplementary information (ESI) available: Reagents list, general characterization methods, synthesis of azido-Lys peptide, cell culture, HPLC traces, flow cytometry, fluorescence data, and hyperpolarized 129Xe NMR spectrum. See DOI: 10.1039/c1sc00041a |
| This journal is © The Royal Society of Chemistry 2011 |