NASICON-type Li1+2xZr2−xCax(PO4)3 with high ionic conductivity at room temperature
Hui
Xie
a,
Yutao
Li
b and
John B.
Goodenough
*a
aMaterials Science & Engineering Program, ETC 9.184, University of Texas at Austin, Austin, Texas 78712, United States
bState Key Laboratory of New Ceramics and Fine Processing, Department of Materials Science and Engineering, Tsinghua University, Beijing, 100084, PR China
First published on 14th October 2011
Abstract
Compounds with nominal formula Li1+2xZr2−xCax(PO4)3 (x = 0.1–0.4) were synthesized and the substitution effects on surface morphology, density and ionic conductivity were investigated. With the introduction of Ca2+, the rhombohedral NASICON structure is retained at room temperature. The maximum Li+-ion conductivity at room temperature is 0.49 × 10⁻⁴ S cm−1 with an activation energy of 0.48 eV with x = 0.1. A Ca2+-rich grain boundary is formed with x > 0.1, which results in a significant decrease in density and ionic conductivity.
Introduction
An all-solid-state battery would provide a safe power source with high-temperature performance. One requirement for this technology is a solid Li+-ion electrolyte with a Li+-ion conductivity σLi > 10−4 S cm−1 that is stable on contact with a lithium anode.1 Several AxM2(PO4)3 (A = Li or Na) compounds with the rhombohedral NASICON framework have been reported to be fast alkali-ion conductors.2–4 The NASICON framework consists of tetrahedral anion complexes (PO4) sharing corners with MO6 octahedra containing an M cation. The rhombohedral framework has one AI and three AII interstitial sites per formula unit for Na+-ion occupancy.5LiTi2(PO4)3 has been reported6,7 to be a promising Li+-ion conductor, and partial substitution for Ti(IV) by aliovalent cations can increase σLi by enhancing the density and changing the size of the interstitial channels. Although Ti(IV) is reduced on contact with a lithium or LiC6 anode,8 introduction of a Li3N layer between the anode and solid electrolyte can alleviate this problem. There is still motivation to investigate oxides with the NASICON structure that do not contain an M cation that is readily reduced on contact with lithium.
The Zr(IV) cation of LiZr2(PO4)3 is believed to be stable versuslithium, but the ionic conductivity of rhombohedral LiZr2(PO4)3 at room temperature is σLi ≈ 1.0 × 10⁻⁵ S cm−1.9,10 Moreover, the rhombohedral NASICON framework is only stable above 50 °C;10,11 at room temperature the framework distorts to triclinic12 with a σLi about three orders of magnitude lower than in the rhombohedral phase. In our previous study,13 we reported that the substitution of 5% of Ca for Zr in LiZr2(PO4)3 can transform the structure to rhombohedral NASICON at room temperature and increase the ionic conductivity significantly. This paper is a subsequent report to investigate further the doping effect of Ca2+ for Zr4+ in Li1+2xZr2−xCax(PO4)3 (0.1 ≤ x ≤ 0.4).
Experimental
Li1+2xZr2−xCax(PO4)3 (0.1 ≤ x ≤ 0.4) was synthesized by conventional solid-state reaction. Li2CO3, ZrO2, NH4H2PO4, CaCO3 were used as starting materials and mixed homogeneously in a mortar. 10 wt% excess Li2CO3 was used to compensate for the loss of lithium during high-temperature annealing. The powder was first heated at 500 °C for 1 h and then at 800 °C for 6 h in order to decompose the NH4H2PO4 and Li2CO3 completely. The final anneal was at 1200 °C for 20 h. The obtained sample was reground and pressed into small pellets with a diameter of about 10 mm and thickness of 1.2 mm. The pellets were reheated again at 1200 °C for 18 h. The density of the sintered pellets was determined by the Archimedes’ method.Powder X-ray diffraction (Philips PW 1830) recorded at room temperature was employed to investigate the phase formation and to calculate the lattice parameters. The scanning range was from 10° to 60° with a step of 0.02° and a dwell time of 12–15 s.
Field-emission scanning electron microscopy (FESEM, Quanta FEG 650) with EDS (Bruker) was used to obtain the surface morphology of the pellets and the distribution of the zirconium and calcium elements.
To measure the ionic conductivity, both surfaces of the pellets were sputtered with a layer of gold. The ionic conductivity was obtained from the impedance spectrum obtained with a Solartron Impedance Analyzer. The applied frequency range was from 106 to 0.1 Hz with a 10 mV signal amplitude. Impedance spectra at different temperatures were measured to obtain the activation energy of the lithium conductivity.
Results and discussion
Fig. 1a shows the XRD patterns of Li1+2xZr2−xCax(PO4)3 (x = 0.1–0.4). No durable pellet with sufficient mechanical strength could be obtained with x > 0.4. For x < 0.1, no NASICON structure can be obtained at room temperature. Hence, those compositions are not discussed in this paper. Rietveld refinement was applied to obtain the lattice parameters (shown in Fig. 1b) and evaluate the purity of the samples. The R![[3 with combining macron]](https://www.rsc.org/images/entities/char_0033_0304.gif) c structure of LiZr2(PO4)3 was used as starting model. Zr and Ca cations were assumed to be randomly distributed at the 12c octahedral sites with the nominal ratios. Li atoms were excluded from the refinement due to the negligible scattering of Li+ to XRD patterns. The refinement results indicate that all compounds crystallize in the space group R
c structure of LiZr2(PO4)3 was used as starting model. Zr and Ca cations were assumed to be randomly distributed at the 12c octahedral sites with the nominal ratios. Li atoms were excluded from the refinement due to the negligible scattering of Li+ to XRD patterns. The refinement results indicate that all compounds crystallize in the space group R![[3 with combining macron]](https://www.rsc.org/images/entities/char_0033_0304.gif) c. A representative refinement profile of x = 0.1 is displayed in Fig. 2. No impurity phase is observed from the refinement.
c. A representative refinement profile of x = 0.1 is displayed in Fig. 2. No impurity phase is observed from the refinement.
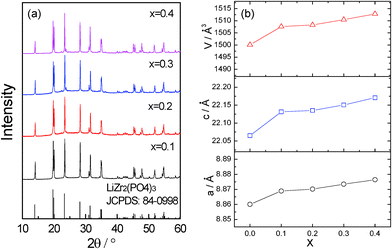 | ||
| Fig. 1 (a) XRD patterns of Li1+2xZr2−xCax(PO4)3 at room temperature. (b) Variation of the lattice parameters with x. | ||
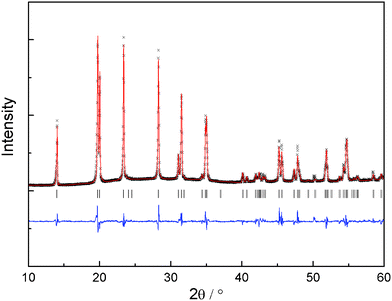 | ||
| Fig. 2 Measured, calculated and difference XRD pattern for Li1.2Zr1.9Ca0.1(PO4)3. The vertical markers indicate the possible reflection positions. | ||
With x = 0.1–0.4, the patterns are indexed to the rhombohedral NASICON structure with space group R![[3 with combining macron]](https://www.rsc.org/images/entities/char_0033_0304.gif) c, which indicates that the introduction of Ca2+ into the LiZr2(PO4)3 can effectively reduce the phase transition temperature to below room temperature. The lattice parameters increase with increasing x as anticipated since (a) the ionic radius of Ca2+ is larger than that of Zr4+ and (b) more Li+ is needed to compensate for the charge balance after the substitution (2 Li+ for 1 Ca2+).
c, which indicates that the introduction of Ca2+ into the LiZr2(PO4)3 can effectively reduce the phase transition temperature to below room temperature. The lattice parameters increase with increasing x as anticipated since (a) the ionic radius of Ca2+ is larger than that of Zr4+ and (b) more Li+ is needed to compensate for the charge balance after the substitution (2 Li+ for 1 Ca2+).
The surface morphologies of the sintered pellets are displayed in Fig. 3. The particle size for the compound with x = 0.1 is obviously smaller than that of the other compounds. Moreover, for x = 0.1, the particles are in better contact with each other. For x > 0.1, a grain boundary phase becomes obvious and open spaces are also observed. Also the ratio of the grain-boundary phase increases with increasing x although no significant difference has been observed in the XRD patterns.
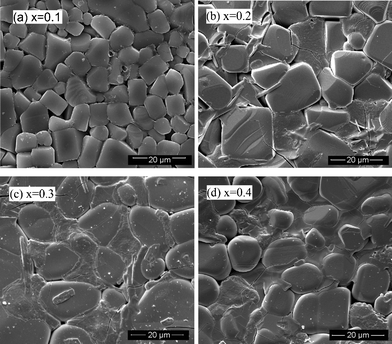 | ||
| Fig. 3 Surface morphology of sintered pellets with different x. | ||
EDX was used to determine the distribution of the Zr and Ca elements in order to determine the difference between the grain and grain-boundary phases. The results are shown in Fig. 4. For x = 0.1, both Zr and Ca are evenly distributed throughout the sample; while for x > 0.1, Ca2+ ions are more concentrated in the grain boundaries than in the grains. In other words, the presence of more Ca2+ than x = 0.1 results in a Ca2+-rich grain-boundary phase, which would definitely influence the physical and electrochemical properties of the materials. The resolution of the EDX makes the rather homogenous distribution of Ca in the grains appear as concentrated regions.
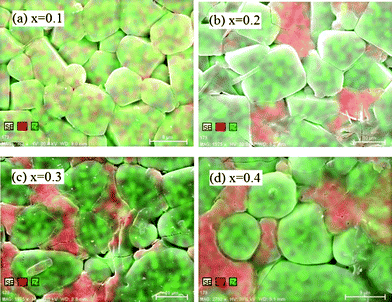 | ||
| Fig. 4 Zr and Ca elemental distribution in the surface of sintered pellets with different x. | ||
The evolution with x of the density of the sintered pellets in Li1+2xZr2−xCax(PO4)3 relative to the theoretical density for LiZr2 (PO4)3 at room temperature is presented in Fig. 5. The relative density is ∼95.7% for x = 0.1 and decreases significantly and monotonically as x increases, dropping to about 91.4% for x = 0.4. The decrease in density can be ascribed mainly to the increase of a lower-density grain-boundary phase.
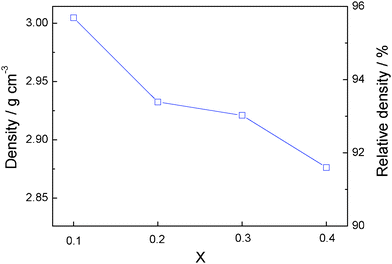 | ||
| Fig. 5 Variation of the density with x in Li1+2xZr2−xCax(PO4)3. | ||
The impedance plots with different amounts of Ca are shown in Fig. 6a. All the impedance plots consist of a single, depressed semicircle at high frequency and a long tail at low frequency. In this study, it is difficult to distinguish the contribution of grain and grain-boundary components (only the plot of x = 0.1 can be poorly resolved into two components13). Hence, the equivalent circuit of (RtQt)Qel (in which Rt is the total resistance, Qt is the corresponding constant phase element, Qel represents and constant phase element of the blocking electrodes) is used to fit the impedance plots and the fitted results are also presented in Fig. 6a as solid lines. The total room-temperature ionic conductivity is obtained from the fitting and the result is presented in Fig. 6b.
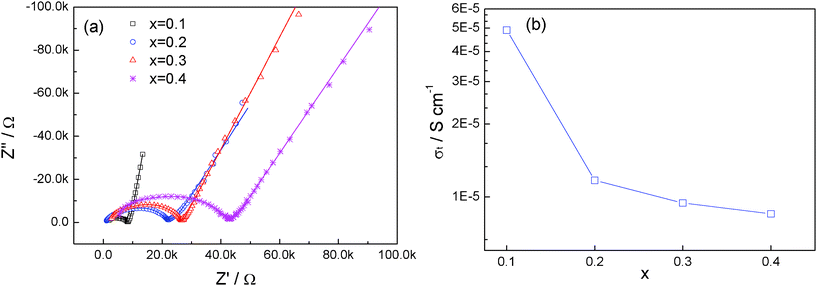 | ||
| Fig. 6 (a) Impedance plot of Li1+2xZr2−xCax(PO4)3 at room temperature. The fitted results are presented in solid lines. (b) Variation of ionic conductivity with x in Li1+2xZr2−xCax(PO4)3. | ||
The ionic conductivity for pristine LiZr2(PO4)3 with NASICON structure near room temperature is about 1.0 × 10⁻⁵ S cm−1. The ionic conductivity increases to 0.49 × 10⁻⁴ S cm−1 for x = 0.1. As x increases further, the ionic conductivity decreases continuously; and at x = 0.4, the ionic conductivity is as low as 0.85 × 10⁻⁵ S cm−1, lower than that of the pure LiZr2(PO4)3 with the NASICON structure.
Fig. 7a shows the temperature dependence of the total ionic conductivity of Li1+2xZr2−xCax(PO4)3 along with the activation energy in Fig. 7b. A well-defined linear relationship between logσt and 1000/T is observed for all the x values in Li1+2xZr2−xCax(PO4)3, which is in good agreement with the Arrhenius relationship σLi = σ0exp(-Ea/kT). The activation energy is calculated from the slope of the fitted straight line. It is clear that the activation energy decreases continuously with increasing x, from 0.48 eV with x = 0.1 to 0.30 eV with x = 0.4. This evolution signals that, with increasing x, the Li+-ion concentration increases despite the existence of a Ca-rich component on the grain boundaries.
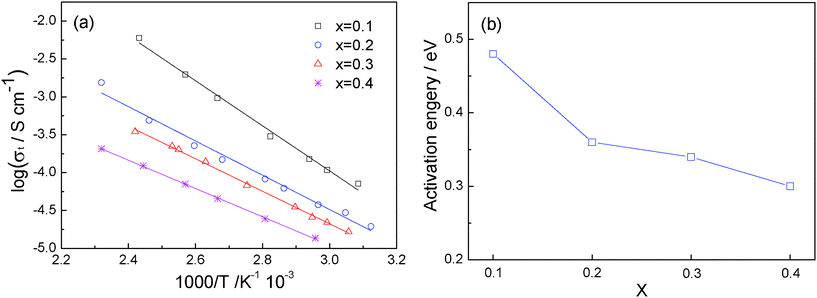 | ||
| Fig. 7 (a) Temperature dependence of the ionic conductivity of Li1+2xZr2−xCax(PO4)3. (b) Variation of activation energy with x. | ||
A single alkali ion in the interstitial space of the NASICON structure is stabilized in the AI sites, and the activation energy for alkali-ion excitation to the AII sites contributes to the motional enthalpy. Doping with a cation of smaller valence than Zr(IV) increases the Li+-ion concentration in the interstitial space, which introduces Li+ into AII sites and lowers the motional enthalpy Ea by introducing Li+-Li+ coulombic interactions to help displace the Li+ ions from the AI site.
Conclusions
A room-temperature NASICON structure with high density and strong mechanical strength is obtained with x from 0.1 to 0.4 in Li1+2xZr2−xCax(PO4)3. The highest ionic conductivity found was 0.49 × 10⁻⁴ S cm−1 with x = 0.1. A Ca-rich grain-boundary phase is formed for x > 0.1 that reduces the ionic conductivity between grains; the activation energy for Li+-ion diffusion within grains, on the other hand, is reduced.Acknowledgements
This work was supported by the Department of Energy Office of Basic Energy Science grant No. DE-SC0005397 and by the Assistant Secretary for Energy Efficiency and Renewable Energy, Office of Vehicle Technologies of the US Department of Energy under Contract No. DE-AC02-05CH11231, under the Batteries for Advanced Transportation Technologies (BATT) Program subcontract #6805919. The authors also thank the National Science Foundation (Grant No. 0959037) for funding the Quanta 650 ESEM used in this work.References
- J. B. Goodenough and Y. Kim, Chem. Mater., 2009, 22, 587–603 CrossRef.
- J. B. Goodenough, H. Y.-P. Hong and J. A. Kafalas, Mater. Res. Bull., 1976, 11, 203–220 CrossRef CAS.
- C. L. Tsai and H. Y. P. Hong, Mater. Res. Bull., 1983, 18, 1399–1407 CrossRef CAS.
- D. Petit, P. Colomban, G. Collin and J. P. Boilot, Mater. Res. Bull., 1986, 21, 365–371 CrossRef CAS.
- M. Barre, M. P. Crosnier-Lopez, F. Le Berre, E. Suard and J. L. Fourquet, J. Solid State Chem., 2007, 180, 1011–1019 CrossRef CAS.
- H. Aono, E. Sugimoto, Y. Sadaoka, N. Imanaka and G. Y. Adachi, J. Electrochem. Soc., 1989, 136, 590–591 CrossRef CAS.
- H. Aono, E. Sugimoto, Y. Sadaoka, N. Imanaka and G. Adachi, J. Electrochem. Soc., 1990, 137, 1023–1027 CrossRef CAS.
- S. Hasegawa, N. Imanishi and T. Zhang, J. Power Sources, 2010, 189, 371–377 CrossRef.
- K. Arbi, M. Ayadi-Trabelsi and J. Sanz, J. Mater. Chem., 2002, 12, 2985–2990 RSC.
- M. Catti, A. Comotti and S. Di Blas, Chem. Mater., 2003, 15, 1628–1632 CrossRef CAS.
- I. A. Stenina, M. N. Kislitsyn, I. Y. Pinus, S. M. Haile and A. B. Yaroslavtsev, Diffusion in Solids - Past, Present and Future, 2006, 249, 255–262 CAS.
- M. Catti, S. Stramare and R. Ibberson, Solid State Ionics, 1999, 123, 173–180 CrossRef CAS.
- H. Xie, J. B. Goodenough and Y. Li, J. Power Sources, 2011, 195, 7760–7762 CrossRef.
| This journal is © The Royal Society of Chemistry 2011 |
