Superantiferromagnetic EuTe nanoparticles: room temperature colloidal synthesis, structural characterization, and magnetic properties†
Weidong
He
ad,
Suseela
Somarajan
bd,
Dmitry S.
Koktysh
cd and
James H.
Dickerson
*bd
aInterdisciplinary Graduate Program in Materials Science, Vanderbilt University, Nashville, TN, USA
bDepartment of Physics and Astronomy, Vanderbilt University, Nashville, TN, USA
cDepartment of Chemistry, Vanderbilt University, Nashville, TN, USA
dVanderbilt Institute of Nanoscale Science and Engineering, Vanderbilt University, Nashville, TN, USA. E-mail: james.h.dickerson@vanderbilt.edu; Fax: +1-615-343-1708; Tel: +1-615-343-2957
First published on 1st November 2010
Abstract
In this communication, EuTe nanoparticles with different size distributions have been synthesized for the first time at room temperature by injection of ethylene glycol solution of Na2Te into ethylene glycol solution of EuCl2 in the presence of triethanolamine. By adding phenanthroline into EuCl2 solution, EuTe nanospindles have also been synthesized. The as-synthesized EuTe nanocrystals show size-dependent optical properties. Low-temperature magnetic measurements show that 6.5 nm EuTe nanoparticles show pronounced superantiferromagnetic transition between 2 K and 20 K. Our facile synthesis route opens up the opportunity of studying and applying this classical Heisenberg antiferromagnetic material in quantized-size range; our magnetic analysis indicates that the properties of EuTe can be tuned by the change of its diameter.
Both the spin configuration and the 4f–5d electronic transition of europium(II) chalcogenides (EuX: X = O, S, Se, Te) make these materials promising candidates for advanced magnetic, optical, and electronic applications.1–6 Among the europium chalcogenides, EuTe is a classical Heisenberg antiferromagnetic material with a Néel temperature of 9.6 K and a NaCl structure.7–9 Interest in synthesizing nanoscale EuX has continued to grow considerably during the past decade. For example, colloidal EuO, EuS and EuSe nanoparticles (NPs) have been synthesized by a variety of groups.10–16 However, there has been no report on the synthesis of EuTe nanoparticles, which are as intriguing as the other EuX NPs regarding synthetic chemistry, optical and magnetic properties. In this communication, we report the first colloidal synthesis of EuTe nanostructures, using ethylene glycol (EG) as solvent and triethanolamine (TEA) as stabilizer, and the observation of nanocrystalline boundary effects on the magnetic response of these materials. EuTe NPs were synthesized by the injection of a solution of Na2Te into a well stirred EG plus TEA solution of EuCl2. Reductive TEA and EG keep both Eu2+ and Te2− from oxidation while TEA metal chelate formed in this procedure balances nucleation and growth steps in the synthesis. The synthesis renders a fast growth mechanism as well as a narrow size distribution of the EuTe NPs at room temperature. EuTe NPs of different sizes were synthesized by setting the concentrations of the EuCl2 and Na2Te. By introducing phenanthroline along with TEA under the same conditions, EuTe nanospindles (NSs) were also achieved. In addition, the magnetic properties of EuTe NPs were measured and analyzed.
All synthetic steps were carried out in nitrogen filled, moisture free glove box at room temperature. In the synthesis of 6.5 nm EuTe NPs, EuCl2 (0.0446 g) was dissolved in a mixture solution of 15 mL ethylene glycol (EG) and 4 mL triethanolamine (TEA) under vigorous stirring. 2 mL of 0.1 M solution of Na2Te in EG were added dropwise into the vigorously stirred EuCl2 solution. The resulting black-colored EuTe nanoparticles were separated out viacentrifugation, washed repeatedly with methanol, and finally stored in methanol for further measurements. The synthesis of 7.3 nm and 5.5 nm EuTe NPs is the same as that for 6.5 nm EuTe nanoparticles except that the concentrations of EuCl2 and Na2Te were 0.1 M and 0.4 M, respectively. In typical synthesis of EuTe NSs, 0.036 g phenanthroline was dissolved in 2 mL EG and injected into EuCl2/EG solution before the injection of Na2Te/EG solution. Other parts of the synthetic procedure followed that of the 6.5 nm EuTe NPs synthesis.
High resolution transmission electron microscopy (HR-TEM) and selected area electron diffraction (SAED) pattern images were obtained using a Philips CM20 TEM operating at 200 kV. HR-TEM samples were made by drop-casting the EuTe nanoparticle suspensions on carbon-coated copper grids. The UV-Vis spectra were recorded with a Varian Cary 5000 UV-VIS-NIR spectrophotometer. Powder XRD measurements were made using a Scintag X1 powder diffractometer. A Bruker Tensor 27 FTIR spectrometer was used to measure FTIR spectra of EuTe NPs. Energy dispersive X-ray (EDS) analysis was performed using a Hitachi S-4200 Scanning Electron Microscope operated at 20 kV acceleration voltage.
The ease of TEA bonding to Eu2+ ions in the EG solution facilitated the formation of a chelate compound [Eu(TEA)n]Cl2 in the early stages of the synthesis.17 Upon injection of the EG solution of Na2Te, EuTe NPs were formed, which readily precipitated in the reactor. Two reaction steps are associated with the formation of EuTe, as described in Scheme 1, which is consistent with the report from Xu et al. on SnS.18 Synthesized EuTe NPs were capped by groups of TEA, which was confirmed by Fourier transform infrared spectroscopy (FTIR), shown in Fig. S1† (in the ESI). The ligands largely helped prevent EuTe oxidation in an oxygen present environment.
 | ||
| Scheme 1 Reaction schematic of EuTe colloidal synthesis. | ||
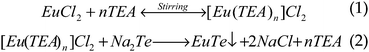
Typical transmission electron microscope (TEM) images of EuTe NPs are shown in Fig. 1(a). As seen from the images, the NPs were nearly spherical. Clear lattice fringes in Fig. 1(b) corresponding to the (220) plane of EuTe, confirmed the crystallinity of the sample. The NP size distribution is given in the histogram; the average size of the NPs, 6.5 nm ± 1.7 nm, corresponded to EuCl2 and Na2Te concentrations of 0.20 M (Fig. 1(c)). Similarly, we synthesized NP samples from 0.10 M and 0.40 M concentrations that yielded average diameters of 7.3 nm ± 1.7 nm and 5.5 nm ± 1.5 nm, respectively, evidenced by the size distribution histograms of the two samples (Fig. S2† in the ESI). The fact that high concentrations of starting materials tend to yield smaller EuTe NPs is consistent with Reiss's prediction on the size-distribution of particles.19 The electron diffraction in Fig. 1(d) showed well-resolved lattice planes that correspond to the (111), (200), (220), and (222) planes of cubic EuTe, which is in good agreement with the XRD data. Energy-dispersive X-ray analysis confirmed the presence of europium and tellurium in the nanoparticles (Fig. S4† in the ESI).
 | ||
| Fig. 1 (a and b) TEM images of 6.5 nm crystalline EuTe NPs. Average diameter is 6.5 nm. Circles are to guide the eye. (c) Histogram of NP size distribution. (d) Electron diffraction pattern of FCC EuTe NPs. (e and f) TEM images of EuTe NSs. | ||
From the TEM images of as-synthesized EuTe NSs, the NSs are 6.8 nm in diameter and 20.4 nm in length (Fig. 1(e) and (f)). The observed lattice spacing was 2.35 Å, which corresponds to the (220) plane (Fig. 1(f)). These lattice planes are further confirmed by the strong electron diffraction ring (Fig. S3† in the ESI). The formation of as-synthesized anisotropic EuTe NSs was driven by surface packing of phenanthroline. Before or during nucleation, electron-rich phenanthroline self-organized into elongated reverse micelle-like structure, similar to what were proposed on the formation of Au and CdSe nanorods.20–22 The elongated nuclei resulted in different packing densities of phenanthroline on different lattice planes of EuTe crystals, which resulted in the different growth rates along different crystal orientations and facilitated the anisotropic growth.
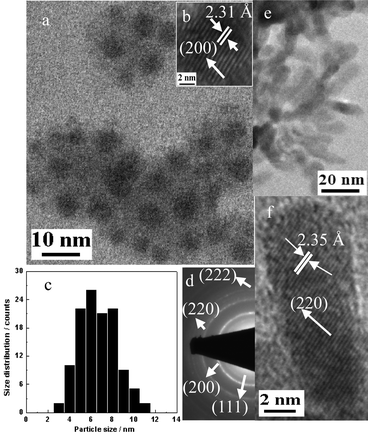
X-Ray diffraction spectra of the colloidal EuTe NPs and NSs provide complementary affirmation of the formation of highly crystalline EuTe nanocrystals, as shown in Fig. 2(a). All four samples have the dominant peak at 2θ = 27.7°, which is assigned to the (200) lattice of NaCl-type EuTe. Two smaller peaks are also observed at 2θ = 40.0° and 2θ = 49.6°; we attributed those peaks to metallic tellurium that formed on the surface of the EuTe nanocrystals through the oxidation of EuTe when exposed to air. By evaluating the full width at half-maximum of the (200) peak and applying the Scherer equation, the diameters of the 7.3 nm, 6.5 nm and 5.5 nm NPs (determined by TEM) were calculated to be 9.5 nm, 7.2 nm and 6.5 nm, respectively. The 20 nm long EuTe NSs were calculated to be 16.3 nm. These sizes are consistent with those calculated from TEM images.
 | ||
| Fig. 2 (a) XRD spectra of EuTe NPs and NSs. Red bars represent primary diffraction peaks of EuTe from its JCPDF file. (b) Absorption spectra of EuTe NPs and NSs in methanol. Inset: absorption of 6.5 nm NPs exhibiting transitions from 4f levels to 5d states and the charge transfer between Eu(II) and Te(II). | ||
Fig. 2(b) shows the absorption spectra of EuTe NPs and NSs dispersed in methanol. There were two peaks for both EuTe NPs and NSs; the low-energy peak corresponded to the 4f7(8S7/2)–4f6(7FJ)5d(t2g) transition of europium electrons, and the high-energy peak around 200–300 nm, corresponded to the transitions from 4f levels to 5d states and the charge transfer between Eu(II) and Te(II) (Fig. 2(b) (inset)). A blue shift of the absorption peaks was observed as the NP size decreased from 7.3 nm to 5.5 nm, which was attributed to quantum confinement effects. Interestingly, the high energy absorption peak of EuTe NSs appeared to be much stronger than the corresponding peak for EuTe NPs. This was likely due to a relative blue shift of the high-energy 4f-electron in the zero-dimensional, quantum-confined NPs (at ∼220 nm) versus in the one dimensional NSs (at ∼250 nm). The increased length of the EuTe NSs (∼20.4 nm) inhibits quantum confinement affects along their major axis, hence, red-shifting their absorption peak relative to the NPs.
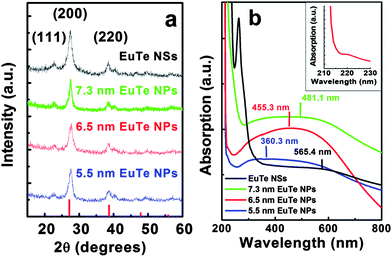
The magnetic properties of as-synthesized EuTe NPs were studied by vibrating sample magnetometry with a Quantum Design Physical Property Measurement System. Zero-field-cooled and field-cooled magnetization measurements on 6.5 nm EuTe NPs from 50 K to 2 K were conducted, as shown in Fig. 3. Although bulk EuTe is antiferromagnetic with a Néel temperature of 9.6 K, both ZFC and FC measurements from 2 K to 50 K did not exhibit a paramagnetic to antiferromagnetic transition for 6.5 nm EuTe nanocrystals.7–9,23 To study the magnetic response of the EuTe sample directly, field-cooled magnetic susceptibility was plotted versus temperature and juxtaposed with the Curie–Weiss law (Fig.3 (inset)). Between 10 K and 20 K, the slope of a linear fit to the χ−1versus temperature graph changes markedly (denoted by the dotted horizontal line). As the temperature increases to 15 K, the x-axis (temperature) intercept of the linear fit changes from a large negative value to positive value. The intercept shifts back to a large negative value around 20 K. This evolution is atypical for normal antiferromagnetic or superparamagnetic nanomaterials. This phenomenon could be reconciled as being influenced by the presence of uncompensated spins on the surface of these nanometre-sized EuTe particles, thus making them prime candidates for being superantiferromagnetic nanostructures.24,25 Under finite-size effects, the two observed transitions might be shifts between superantiferromagnetism and superparamagnetism, given the small mass susceptibility in range. A magnetization hysteresis on 6.5 nm EuTe NPs at 2 K supports this assertion (Fig. S5† in the ESI). Systematic investigation of the magnetic evolution of EuTe NPs and NSs as functions of NP size and temperature is the subject of ongoing research.
 | ||
| Fig. 3 ZFC and FC (at 0.1 T) curves of 6.5 EuTe NPs from 50 K to 2 K. Inset: field-cooled inverse magnetic susceptibility versus temperature of 6.5 nm EuTe NPs. | ||
Conclusions
In summary, colloidal EuTe NPs and NSs have been synthesized for the first time, and the magnetic properties of EuTe NPs have been introduced. This facile room temperature colloidal synthesis helps to overcome the challenges of synthesizing other rare-earth chalcogenides and facilitates the studies on these materials in nanoscale. The observation of superantiferromagnetism in the nanomaterials presents a rare opportunity to investigate unique size-dependent magnetic phenomena. Our synthetic technique also provides the potential of implementing EuTe NPs and NSs in a host of magnetic, photovoltaic, and magneto-optical device applications.Acknowledgements
This research is partially supported by the US Department of Energy, Basic Sciences, Division of Materials Science and Engineering, Award DE-FG02-07ER46447; the National Science Foundation (NSF), Award DMR-0757380; Vanderbilt Institute for Nanoscale Science and Engineering (VINSE); the National Nuclear Security Administration under the Stewardship Science Academic Alliances Program through DOE Grant DE-FG52-10NA29659; NSF Cooperative Agreement No. DMR-0654118; the National High Magnetic Field Laboratory Visiting Scientists Program, Project #12492; and the State of Florida. We thank Jungwon Park for fruitful discussions.Notes and references
- P. Fumagalli, C. Spaeth, U. Rudiger and R. J. Gambino, IEEE Trans. Magn., 1995, 31, 3319–3324 CrossRef CAS.
- N. S. Gaikwad, V. M. Nikale and C. H. Bhosale, J. Phys. Chem. Solids, 2003, 64, 723–730 CrossRef CAS.
- A. B. Henriques, G. D. Galgano, B. L. Diaz, P. H. O. Rappl and E. Abramof, J. Phys.: Condens. Matter, 2007, 19, 406234–406245 CrossRef.
- A. B. Henriques, L. K. Hanamoto, E. Ter Haar, E. Abramof, A. Y. Ueta and P. H. O. Rappl, Int. J. Mod. Phys. B, 2004, 18, 3813–3816 CrossRef CAS.
- J. Schoenes and P. Wachter, IEEE Trans. Magn., 1976, 12, 81–85 CrossRef.
- P. Wachter, Handbook on the Physics and Chemistry of Rare Earths, North-Holland, Amsterdam, 1979 Search PubMed.
- T. Hihara and M. Kawakami, J. Phys. Soc. Jpn., 1988, 57, 1094–1104 CrossRef CAS.
- T. Kasuya, IBM J. Res. Dev., 1970, 14, 214 CrossRef CAS.
- E. Schierle, E. Weschke, A. Gottberg, W. Sollinger, W. Heiss, G. Springholz and G. Kaindl, Phys. Rev. Lett., 2008, 101, 267202 CrossRef CAS.
- Y. Hasegawa, T. A. Adachi, A. Tanaka, M. Afzaal, P. O'Brien, T. Doi, Y. Hinatsu, K. Fujita, K. Tanaka and T. Kawai, J. Am. Chem. Soc., 2008, 130, 5710–5715 CrossRef CAS.
- Y. Hasegawa, S. Thongchant, Y. Wada, H. Tanaka, T. Kawai, T. Sakata, H. Mori and S. Yanagida, Angew. Chem., Int. Ed., 2002, 41, 2073–2075 CrossRef CAS.
- M. L. Redígolo, D. S. Koktysh, S. J. Rosenthal and J. H. Dickerson, Phys. Status Solidi C, 2007, 4, 406–407 Search PubMed.
- M. L. Redigolo, D. S. Koktysh, S. J. Rosenthal, J. H. Dickerson, Z. Gai, L. Gao and J. Shen, Appl. Phys. Lett., 2006, 89, 222501–222503 CrossRef.
- M. L. Redigolo, D. S. Koktysh, K. van Benthem, S. J. Rosenthal and J. H. Dickerson, Mater. Chem. Phys., 2009, 115, 526–529 CrossRef CAS.
- M. D. Regulacio, N. Tomson and S. L. Stoll, Chem. Mater., 2005, 17, 3114–3121 CrossRef CAS.
- F. Zhao, H. L. Sun, G. Su and S. Gao, Small, 2006, 2, 244–248 CrossRef CAS.
- P. Starynowicz, J. Alloys Compd., 2001, 323, 159–163 CrossRef.
- Y. Xu, N. Al-Salim, C. W. Bumby and R. D. Tilley, J. Am. Chem. Soc., 2009, 131, 15990–15991 CrossRef CAS.
- H. Reiss, J. Chem. Phys., 1951, 19, 482–487 CrossRef CAS.
- J. X. Gao, C. M. Bender and C. J. Murphy, Langmuir, 2003, 19, 9065–9070 CrossRef CAS.
- L. Manna, L. W. Wang, R. Cingolani and A. P. Alivisatos, J. Phys. Chem. B, 2005, 109, 6183–6192 CrossRef CAS.
- Y. Yin and A. P. Alivisatos, Nature, 2005, 437, 664–670 CrossRef CAS.
- T. Kasuya, J. Alloys Compd., 1993, 192, 11–16 CrossRef CAS.
- C. Gilles, P. Bonville, H. Rakoto, J. M. Broto, K. K. W. Wong and S. Mann, J. Magn. Magn. Mater., 2002, 241, 430–440 CrossRef CAS.
- A. T. Heitsch, D. C. Lee and B. A. Korgel, J. Phys. Chem. C, 2010, 114, 2512–2518 CrossRef CAS.
Footnote |
| † Electronic supplementary information (ESI) available: Fig. S-1 through S-5. See DOI: 10.1039/c0nr00625d |
| This journal is © The Royal Society of Chemistry 2011 |