NMR methods for unravelling the spectra of complex mixtures
Ramon
Novoa-Carballal
a,
Eduardo
Fernandez-Megia
a,
Carlos
Jimenez
b and
Ricardo
Riguera
*a
aDepartment of Organic Chemistry and Centre for Research in Biological Chemistry and Molecular Materials, University of Santiago de Compostela, Jenaro de la Fuente s/n, 15782, Santiago de Compostela, Spain. E-mail: ricardo.riguera@usc.es
bDepartment of Fundamental Chemistry, Faculty of Sciences, University of A Coruña, A Coruña, Spain
First published on 11th October 2010
Abstract
Covering: up to May 2010
The main methods for the simplification of the NMR of complex mixtures by selective attenuation/suppression of the signals of certain components are presented. The application of relaxation, diffusion and PSR filters and other techniques (J-resolution, TOCSY, etc.), to biological samples, pharmaceuticals, foods, living organisms and natural products are illustrated with examples.
 Ramon Novoa-Carballal | Ramón Novoa-Carballal was born in 1979, and received his BS (2002), MS (2004) and PhD (2009) in chemistry at the University of Santiago de Compostela (USC) (supervisors R. Riguera and E. Fernandez-Megia). During his BS, he joined the Friedrich Schiller University Jena (Germany) for two semesters (2000–2001). As part of his PhD, he had two short stays at the Imperial College London (supervisors A. Miller and M. Thanou) and the Stockholm University (supervisor G. Widmalm). In 2010 he obtained a Barrie de la Maza Fellowship to undertake a postdoc at the University of Bayreuth. His research is focused on synthetic modification and characterization (especially by NMR spectroscopy) of polysaccharides and dendrimers of pharmaceutical interest. |
 Eduardo Fernandez-Megia | Eduardo Fernandez-Megia was born in 1967 in Vigo, Spain, and is currently a Professor Titular in the Organic Chemistry Department and Centre for Research in Biological Chemistry and Molecular Materials at the University of Santiago de Compostela (USC). After completing a Ph.D. in 1995 at USC (supervisor Prof. F. Javier Sardina), he undertook a postdoctoral stay with Prof. Steven V. Ley at the University of Cambridge (1997–1999). Then, he returned to the USC as a Marie Curie Fellow and Prof. Asociado. In 2003, Eduardo became a Ramon y Cajal Fellow, followed by a Prof. Contratado Doctor in 2008. His research has focused on the interface between organic and polymer chemistry with emphasis on the preparation of well-defined polymeric nanostructures for biomedical applications and the development of NMR and SPR tools for their characterization. |
 Carlos Jimenez | Carlos Jiménez received his BS (1984) and PhD (1988) in Organic Chemistry at the University of Santiago de Compostela (USC), and did postdoctoral studies at the University of California at Santa Cruz (USA) with Dr Phil Crews (1988–1990) and at the Scripps Research Institute, La Jolla (USA) with Dr Alfonso Tramontano (1990–1991). He was assistant professor of Chemistry at USC until 1992 and then moved to University of A Coruña, where he reached his current position as Full Professor of Organic Chemistry in 2009. His research focuses on the chemistry of bioactive natural products (isolation, structural elucidation, and synthesis), mainly from marine organisms, and the applications of NMR techniques to structural problems, mainly in the determination of the relative configuration of organic molecules. He has authored some 80 scientific publications and monographs. |
 Ricardo Riguera | Ricardo Riguera received his PhD in Chemistry from the University of Santiago de Compostela (USC) in 1973. He carried out postdoctoral studies at University College London with Prof. P. Garrat (1974). He was appointed Lecturer in 1978, and in 1990 he became full Professor of Chemistry at USC. His research is represented by around 200 papers and patents covering several topics: bioactive natural products, medicinal chemistry and NMR methods for determination of absolute configuration. He is now interested on polymeric nanostructures for biomedical applications and on stimuli responsive dynamic polymers. He has authored three textbooks for students and served the University as Chairman of the Department, Dean of the Faculty and Vice-Chancellor. |
1 Introduction
For chemists, it is unfortunate that Nature only very rarely presents its results in the form of pure compounds. Therefore, separation and purification of components from complex mixtures has historically occupied a central role in the effort of researchers, particularly in the field of natural products research.Although very efficient separation methods have been developed that provide the pure components ready for structure determination, most of the working time is devoted to the separation/purification steps and not to the structural determination. A step further in the optimization of this research has been the implementation of hyphenated techniques such as HPLC–NMR, where the products of the HPLC column enter the NMR spectrometer directly so that no isolation or manipulation of the sample is necessary to obtain the spectra. Still, the investigation of complex mixtures relies on the classical paradigm that has presided over the work of natural products chemists for years: first, to separate and purify the components, and next, to submit the pure compounds to spectroscopic analysis. This protocol requires the separation of many ‘useless’ components in order to isolate a single or just a few compounds of interest, and stresses the increasing importance of dereplication.
Nowadays. and thanks to the developments of NMR, it is not always necessary to separate the components of a mixture in order to obtain spectroscopic information from its constituents. The mixture is directly submitted to NMR and the acquisition is implemented in a way that allows the data from the components to be obtained with no previous separation.
The most important procedures are based on differences in the translational diffusion and NMR relaxation times of the components in the mixture. These differences allow one to obtain either edited spectra (i.e. spectra where only the components with defined relaxation times or diffusion coefficients are observed), or to obtain bidimensional spectra (one dimension being the chemical shift and the other the diffusion coefficient or relaxation time). Both options have been described for relaxation and diffusion, but bidimensional spectra are only commonly used for diffusion (diffusion-ordered spectroscopy, DOSY).
Relaxation filters allow the attenuation/suppression of the signals from compounds with high molecular weight, and diffusion filters attenuate the signals from low molecular weight compounds. Therefore they can be used to simplify the spectra of a mixture by selectively acting on these two types of components. Other procedures, such as the addition of paramagnetic spin relaxation agents (PSR filters), are based on completely different mechanisms, and expand the usefulness of diffusion and relaxation filters to other components independently of their molecular weight.
These approaches have been demonstrated to work very successfully with biological fluids (urine, serum, cells, tissues), with whole specimens and cells, pharmaceutical preparations, and in food analysis, but surprisingly, only a very few examples of application to natural products research have been published.
In this review, we present the main characteristics and practical aspects of methods for unravelling the NMR of mixtures, illustrated with examples. We hope to provide practitioners of natural products research with information useful to evaluate the use of these procedures when investigating the mixtures they usually come across.
Accordingly, this review contains three main sections, the first two being devoted to the use of relaxation and diffusion parameters. A third section describes the application of other NMR methods, such as J-resolved spectroscopy, TOCSY and the use of PSR agents.
2 Relaxation filters
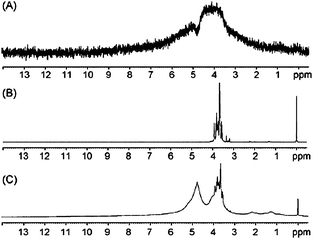
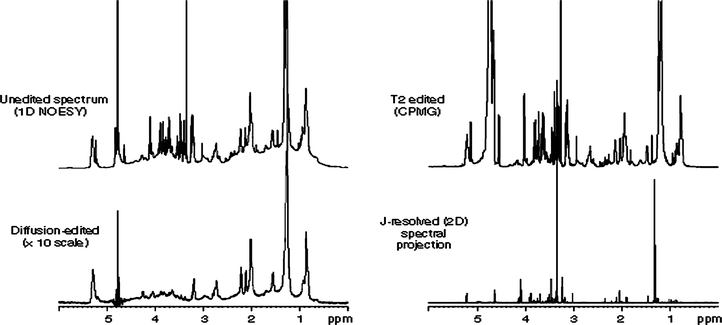
Relaxation filters are pulse sequences that allow the selective attenuation of signals of high molecular weight and/or rigid compounds, eventually leading to their suppression (Fig. 1).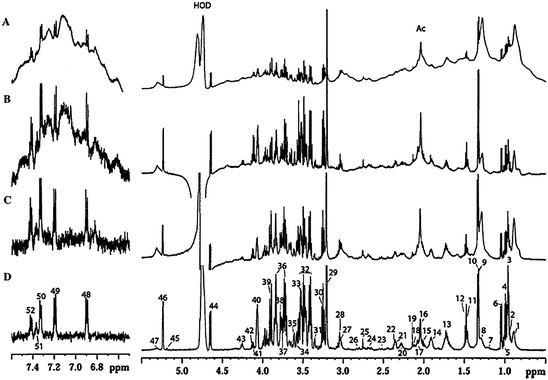 | ||
| Fig. 1 1H NMR spectra of a human blood plasma sample, (A) 1H with water presaturation; (B) T1-edited NMR spectrum, plotted inverted, relaxation filter 265 ms; (C) T1ρ-edited NMR spectrum; spin-locking time 120 ms; (D) T2-edited NMR spectroscopy; relax filter 160 ms. Reprinted from ref. 1 with permission. | ||
For the analysis of natural mixtures, this methodology was first proposed in the late 1970s with studies on adrenal medulla,2 and metabolites in red blood cells.3 Later on, the group of Nicholson introduced several improvements converting this NMR technique into a routine method in metabolism studies.4–8 For this reason, most of the relaxation filter applications are related to metabolic profiling of cells, tissues, and biological fluids in human or animals. Moreover, some other interesting applications have been recently described in other fields (metabolism, taxonomy, food chemistry), illustrating the high potential of these techniques.
2.1 Basic concepts
In an NMR experiment, a molecule is placed under a magnetic field leading to the splitting of the nuclear spin levels (Zeeman effect). The application of a radiofrequency pulse situates the system in an excited state that immediately begins its return to equilibrium through a complex process known as relaxation. NMR relaxation is directly bound to the dynamics and flexibility of the excited molecule; therefore, NMR relaxation has been widely used as a source of information on the dynamics of compounds,9 as well as on the study of interactions.10In the case of complex mixtures, the dependence of the relaxation times on the dynamics and flexibility of each molecule opens the possibility to selectively attenuate, or even remove, the signals of the components with shorter spin–lattice (also called longitudinal) relaxation times, T1 and T1ρ (longitudinal relaxation under spin-lock pulse conditions), or spin–spin (transversal) relaxation times, T2.
An illustrative example of relaxation edited spectra is shown in Fig. 1, where the signals from proteins and lipoproteins (with shorter T1, T1ρ and T2) are almost completely removed from the spectra.
A good example is human plasma (Fig. 1) where proteins with T2, T1ρ and T1 values lower than those of peptides and glucose can be distinguished from them using these filters. Thus, the T2 and T1ρ values of the proteins are one order of magnitude lower than those of the peptides and the glucose, while T1 values are only 3–5 times lower. Therefore, the attenuation of the high molecular weight compounds is more efficient using T2 and T1ρ filters than with T1. This explains the much more extensive use of the former filters in spectral editing.†
Although the differences in T1 are lower, they are sufficient to be exploited for the purpose of spectral editing (see Fig. 1). One typical example is water peak suppression, a topic that is out of the scope of this review.11
1) The use of relaxation filters is restricted to situations where the relaxation times of the components are considerably different. For example, if we have three NMR signals A, B and C in identical ratio 1/1/1 with T2 values of 10, 30 and 100 ms respectively, and apply a filter of 200 ms, the ratio will change to 0.1/0.3/1 (95%, 86% and 61% of attenuation respectively). The new signal intensities are calculated by the formula If = Io![[thin space (1/6-em)]](https://www.rsc.org/images/entities/char_2009.gif) exp(−tf/T2), where If is the signal intensity after applying the T2 filter, Io is the signal intensity before filtering and tf is the T2 filter duration. This implies that A will be practically eliminated from the spectrum, while B will be only partially attenuated. For this reason, if precise quantitative information is required, we have to introduce a correction on the signal intensities based on the different attenuation of the signals coming from protons with different relaxation times.‡13
exp(−tf/T2), where If is the signal intensity after applying the T2 filter, Io is the signal intensity before filtering and tf is the T2 filter duration. This implies that A will be practically eliminated from the spectrum, while B will be only partially attenuated. For this reason, if precise quantitative information is required, we have to introduce a correction on the signal intensities based on the different attenuation of the signals coming from protons with different relaxation times.‡13
In those cases where the signals to be suppressed are the most intense (such as in blood plasma, Fig. 1) the loss of signal experienced by those signals whose suppression is not desired is compensated by the increased receiver gain.
2) Additionally, the relaxation times are not only dependent on the overall rotational correlation time but also on the local motions. Different parts of a molecule may have very different local mobility (i.e. flexibility); therefore different relaxation times and different sensitivity to the filter result: some parts of the molecule may remain present in the spectra after filtering while others are suppressed. Such is the case with the N-acetyl signals of N-acetylglucosamine and N-acetylneuraminic acid residues in mobile carbohydrate side-chains of glycoproteins.14
3) Finally, when small molecules in the mixture are bound to macromolecules, the ‘complex’ behaves as a single entity and responds to the filter as a whole. Indeed, the small molecule will be eliminated from the spectrum together with the big one, even when a small filter – selected for the macromolecule – has being used.15
2.2 Methodology and state of the art
The use of relaxation-edited spectra is theoretically not restricted to 1H NMR spectroscopy, and can be applied to other nuclei. Nevertheless, the use of 13C NMR has been limited by its lower sensitivity. In the only example we found in the literature, Blackwell et al. successfully applied a T2 relaxation filter for the suppression of humic acid signals in the 13C NMR spectrum from a mineral soil.16
The Hahn spin-echo pulse sequence, applied in the early works describing relaxation editing,7,17 results in phase-modulation of signals. Therefore it has been replaced by the Carr–Purcell–Meiboom–Gill (CPMG) spin-echo pulse sequence, which minimizes the J-modulation and the loss of signal intensity caused by diffusion through field gradients.§,18
In 2009, a modified CPMG pulse sequence (CPMG-z) was described. This experiment makes use of an additional gradient filter on the z-axis to completely eliminate phase distortions caused by the J-modulation,19 Nevertheless, the benefit of moving from CPMG to CPMG-z on a general basis has still not been demonstrated.
• Combination of inversion-recovery and spin-echo
Rabenstein et al. described the inversion-recovery spin-echo (IRSE) sequence as a combination of the inversion-recovery and the spin-echo pulse sequences. With this pulse sequence, overlapping resonances can be sorted first according to differences in their T1 values and then to differences in their T2 values. This sequence has been used in NMR studies of red blood cells.17 It also permits the measurement of T1 from small molecules that overlap with proteins.20 Later on, Lindon et al. described an improved pulse sequence that eliminates the phase distortions caused by spin–spin coupling during the spin-echo period and simultaneously suppresses the water signal.21
• Relaxation combined with diffusion
Lindon et al. described a new pulse sequence that allows DIffusion and T2 RElaxation editing in a single NMR experiment (DIRE).21 The experiment allows the attenuation of low and high molecular weight molecules to the desired extent (by modulating the duration the relaxation and diffusion filters), and has been applied to biological fluids.
Other authors described different pulse sequences with the same purpose but in other contexts: simultaneous elimination of polymer and non-bound low molecular weight compounds in combinatorial chemistry,22 elimination of protein signals when determining the interaction with a low molecular weight compound by diffusion NMR,23,24 determination of the diffusion coefficients in mixture of humic substances,25 or removing polymer signals in a recent procedure for diffusion chromatographic NMR.26 Among these different possibilities, the one described by Shapiro combines the more suitable pulse sequences for both the T2 relaxation and diffusion filters, minimizing phase distortions. The group of Larive et al. has also described the combination of T1 as well as T1ρ filtering with diffusion.25,27
• Relaxation-filtered bidimensional spectroscopy
Edited 1H NMR spectra give very interesting information on the composition of natural mixtures, but 2D NMR is often required for unambiguous assignments.
The first examples of relaxation-filtered bidimensional spectroscopy (T2-filtered COSY) were described for the identification and assignment of 1H NMR spectra of small molecules in intact erythrocytes using conventional spin echo.28 Few years later, Holmes et al. described the combination of CPMG and COSY, demonstrating its applicability in the NMR spectra of cancer cells and mouse abdominal fat.29 An example of T2-filtered edited total correlation spectroscopy (TOCSY) for the study of pig blood plasma has also been described.30
More recently, Nicholson et al. have described sequences to enable an easier implementation of phase-sensitive 2D NMR and to extend the concept to T1/T1ρ/T2-edited COSY and TOCSY. Those experiments applied to a blood plasma sample,1 and clearly favoured the detection of small metabolite signals. For example, after the relaxation editing, the signals of amino acids (valine, leucine, isoleucine) in the 0.7–2.0 ppm region (dashed box in Fig. 2B–D) emerged much more clearly behind the intense lipid peaks.
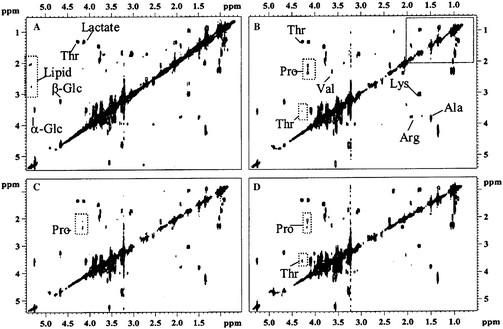 | ||
| Fig. 2 Relaxation-edited 1H–1H COSY NMR spectra of human blood plasma. (A) Normal COSY spectrum; (B) T1-edited spectrum; 265 ms filter; (C) T1ρ-edited spectrum, 120 ms filter; (D) T2-edited spectrum; 160 ms filter. Reprinted from ref. 1 with permission. | ||
Two interesting experiments that used relaxation-filtered HSQC were recently described by Luy et al. for the measurement of the residual dipolar couplings of strychnine in the presence of a polymeric alignment media.31 In one of then, a spin-lock period is introduced, where the magnetization is relaxed by T1ρ. In a second approach, a z-filter period is added, where the relaxation is mainly determined by 1H–1H NOE. In both experiments, suppression of the polymeric alignment media is accomplished, thus facilitating the measurement of 1H–13C dipolar couplings.
• TOSY
The 2D-NMR experiment termed raTe of relaxation Ordered SpectroscopY (TOSY) is a bidimensional method in which one dimension is the chemical shift and the other the relaxation time. TOSY can be T1/T1ρ/T2, displaying the distribution of rates of relaxation in the indirect dimension and the traditional spectrum in the direct dimension. In contrast to what happens in diffusion NMR where DOSY is very common, TOSY has been reported only in a few cases as application to pharmaceutical formulations.32
• TOPSY
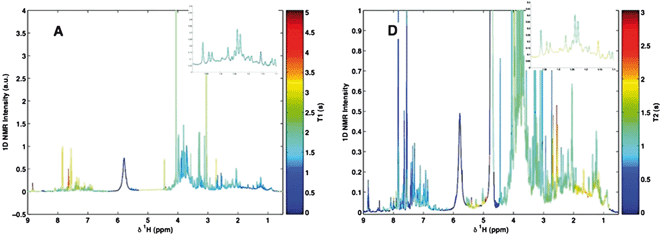
Another interesting technique, T1 or T2 Ordered Projection SpectroscopY (TOPSY) was described in 2009.33 The spectra are colour-coded according to the T1 and T2 proton relaxation times respectively, so that changes of relaxation time across multiple compounds can be followed. In this way, TOPSY allowed the differences in the relaxation times caused by the presence of the borate used as food preservative to be easily visualized (Fig. 3).
2.3 Application of relaxation filters to the NMR analysis of mixtures
As has been mentioned before, the great majority of the applications reported for relaxation filters are related to metabolic profiling of cells, tissues and biological fluids in human or animals.1H NMR spectroscopy is one of the preferred analytical techniques for metabonomic research because it requires little or no sample preparation and it is cost-effective, unbiased, rapid, robust, reproducible, quantitative, non-selective and non-destructive. Although this technique is not as sensitive as others, useful data can be generated from very small samples. In addition, NMR avoids the drawbacks of traditional bioanalysis methods requiring extensive sample preparation based on physical methods such as chromatography that may cause both biological and physicochemical changes to the sample.4–8
However, these NMR studies are very challenging due to the very strong signal overlap, considerable range of concentrations, molecular weights, and molecular mobility (hence signal line width) of the individual organic components of the biological samples. To overcome those difficulties, pseudo-separation based on relaxation times and molecular diffusion coefficients brings about considerable spectral simplification and serves also to simplify the signal assignment process. In addition, these filters are commonly used together with other NMR methods such as J-resolved spectroscopy (see subsection 4.3), 1D and 2D TOCSY (see subsection 4.4) and 2D NMR experiments, including the differential analysis of 2D spectra, successfully applied to natural mixtures from bacteria, fungi, and other sources.34
Thanks to all these procedures, a large number of constituents can be identified and catalogued because NMR provides detailed structural information. Moreover, 1H NMR spectroscopy allows perturbations of the concentrations of endogenous metabolites to be detected, and therefore it has been employed to investigate changes in biochemical composition prior to and after treatment with a drug or a toxin, or to monitor the metabolic responses to stress, exercise, and certain diets, and even to relate metabolic phenotypes with dietary preferences.35–37 There is a growing optimism about the potential of 1H NMR as a diagnostic and prognostic tool for cancer, heart disease, diabetes or inborn errors of metabolism and as an aid for personalized medicine.38
In the following subsections, some more information is given about these new uses of NMR on biological fluids (subsection 2.3.1), and on cells and tissues (subsection 2.3.2). Some less common but very interesting examples of the NMR of living organisms (subsection 2.3.3) and of food (subsection 2.3.4) are also discussed. Finally, the combined use of relaxation and diffusion filters for the selective suppression of certain types of components in mixtures is described in subsection 2.3.5.
Since then, T2 filtering has become a routine method for the elimination or attenuation of macromolecule resonances (mainly proteins and lipoproteins) in body fluids, and therefore enhancing the detection of small metabolites such as peptides, choline, taurine, acetate, ascorbate and many others. The Hahn spin-echo experiments (J modulation, see subsection 2.2.1) used in the early papers were gradually replaced with the more convenient CPMG. Examples of the relaxation-edited NMR spectra of urine, blood plasma, bile, and amniotic, cerebrospinal and seminal fluids are known,37,40–42 but cell extracts have been reported too.43
A representative example of the use of relaxation filtering for the detection of small metabolites in blood plasma is shown in Fig. 1. Detailed information on the classification and listing of metabolites accessible from the 1H-NMR of biofluids has been reviewed elsewhere.4–8
Relaxation editing is not always necessary when carrying out the 1H NMR of biofluids – its necessity depends on the fluid studied and the information required. For example, blood plasma and even serum contain a large quantity of macromolecules that should be removed in order to obtain high-quality metabolic information about the small molecules. In contrast, the NMR of urine, which contains smaller quantities of macromolecules, is obtained by most authors without using relaxation editing. Nevertheless, Slupsky et al. have demonstrated that T2 filtering of urine samples is very convenient to eliminate baseline artefacts due to protein and lipids, when precise quantitative information is needed.44
It is also interesting to highlight that by modulating the length of the relaxation filter, the suppression of different types of macromolecules can be accomplished. For example, most proteins of blood plasma (albumin, immunoglobulin, etc.) can be eliminated from the 1H NMR spectra with a T2 filter of around 100 ms,45 while the resonances from more mobile lipoproteins (specially the prominent peaks near 0.9 and 1.3 ppm due to lipidic CH3 and CH2 groups; see also Fig. 1) are only partially attenuated even with longer filters.46
In practice, it is common to use filters of around 40–120 ms, because the lipoprotein resonances contain very interesting information as diagnostic and prognostic tools.38
Most of the studies that used relaxation editing in biological fluids have been performed in humans and other mammals (rodent, canine, pig). Nevertheless, the applicability of this technique goes well beyond that, and cases illustrating the potential of CPMG are also found in other fields exemplified by algae extract,47 fish blood plasma,48 and hemolymphs from the Red abalone shellfish (Haliotis rufescens).49
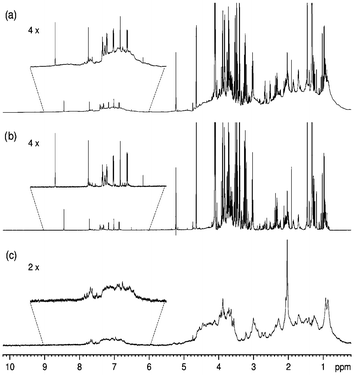
With the emergence of high resolution magic angle spinning (HR-MAS) NMR spectroscopy it was possible to solve those difficulties improving the spectral quality of viscous cell and tissue samples. HR-MAS NMR spectroscopy reduces the line broadening associated with restricted molecular motion, chemical shift anisotropy, dipolar couplings and field inhomogeneity by high-rate spinning of the sample at the magic angle.51 This results in well-resolved NMR spectra with narrow linewidths that are comparable to in vivo magnetic NMR spectra, albeit with generally much higher resolution and sensitivity. HR-MAS NMR of tissues has been shown to be valuable in the non-destructive assessment of metabolite profiles in skin, brain, bone, cartilage, eye, gut, liver, kidney, muscle, and vascular tissues. Additional information about the metabolites accessible from the 1H NMR of tissues and cells can be found in quite recent comprehensive reviews.5,52
In analogy to what is common in the liquid state, the use of T2 filters using CPMG on viscous samples (HR-MAS-CPMG), allows the pseudo-separation of the low molecular weight metabolites from the macromolecules.5,52,53 Although the CPMG pulse sequence can be adapted to the MAS probe,13,54 the group of Nicholson et al. remarks that this is not always necessary.5,52 It is also interesting to note that the filters to remove macromolecules in these viscous samples should be longer (100–300 ms) than those used in the liquid state. A representative example of the NMR of a liver biopsy is shown in Fig. 4.
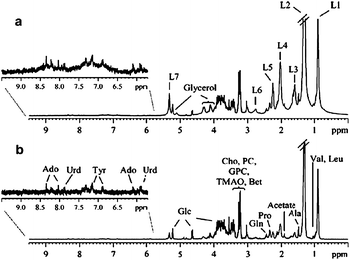 | ||
| Fig. 4 1H HR-MAS NMR spectra of a human liver biopsy sample (rotation rate 4 kHz): (a) standard 1H spectrum; (b) spin-echo (CPMG) spectrum. Assignments: L1–7 lipid resonances. Reprinted from ref. 55 with permission. | ||
Thus, CPMG filters in HR-MAS have been exploited in the study of unicellular organisms such as Mycobacterium smegmatis. In that work, the authors propose that NMR may become a unique tool to study conformation, dynamics, and interactions among biologically important macromolecules in their native state.56
The analysis of the yeast Pichia anomala described by Schnürer et al. was another example of a HR-MAS-CPMG.57 This allowed the analysis of many soluble compounds, such as trehalose, arabitol, and glycerol, inside intact cells without the need for an extraction step. The variation of the levels of these metabolites under conditions of limited oxygen demonstrated that oxygen availability affected the respiration and not the fermentation of the yeast. Analysis of four different marine microalgae by this tandem methodology demonstrated its usefulness in taxonomic classification studies.58 This application was also used by Ferreira et al., who demonstrated that 1H HR-MAS NMR and FT-IR provided a fast and economic method for lichen chemotaxonomy in a complete analysis of eleven different specimens from several families, genera and species.59 The use of CPMG was necessary to obtain high-quality spectra from the low molecular weight carbohydrates used for the classification (Fig. 5). This method is much faster than the traditional colorimetric analysis requiring laborious and time-consuming sample pre-treatment.
 | ||
| Fig. 5 Lichen 1H NMR spectra: (A) without magic angle spinning; (B) HR-MAS with CPMG pulse; (C) HR-MAS without a CPMG pulse. Reprinted from ref. 59 with permission. | ||
Application to the red alga Gracilariopsis lemaneiformisa allowed to discriminate between small molecules – in solution in the plant cells – and larger rigid components such as cell wall material and membrane constituents.60 In this study, HR-MAS NMR was shown to be a suitable tool for in situ studies when short experimental times are required. In fact, cultivation of G. lemaneiformisa could be continued after 1 h of spinning at 5 kHz, showing that the organisms survive in good condition after the experiment. However, after overnight experiments, some metabolic changes were observed.
An interesting HR-MAS-CPMG study on a living whole-specimen was conducted on the freshwater cladoceran Daphnia magna in order to monitor the changes in metabolism occurring during animal life. Survival of ten 24 h old daphnids after HR-MAS analysis at different speeds for 14 days was observed. The surviving daphnids displayed a normal life cycle, developing eggs and embryos as usual.61
Marsaioli et al. described the use of 1H NMR to monitor the profiles of fermentation and roasting processes of cupuassu (Theobroma grandiflorum), a Brazilian product similar to chocolate.¶,65 The authors used a CPMG T2 filter to eliminate residual protein signals that caused deleterious effects on acid and alcohol quantifications in normal 1H NMR spectra. The quantification of lactic acid, acetic acid and 2,3-butanediol by NMR is 5- to 10-fold faster than by HPLC, with the advantage of providing the identification of several chemical species in a single experiment.
More recently, Stocchero et al. showed the usefulness of NMR combined with chemometrics for the evaluation of the ageing of balsamic vinegar of Modena.661H NMR acquired by the use of a T2 filter gave high quality spectra showing of organic acids (like formic, tartaric, malic, succinic, and acetic), and carbohydrates (glucose and fructose) useful for the evaluation of the ageing process.
 | ||
| Fig. 6 800 MHz 1H NMR spectra of human amniotic fluid: (a) standard 1H spectrum, (b) T2-edited spectrum, showing low molecular weight metabolite resonances, (c) diffusion-edited spectrum showing protein and lipoprotein resonances. Reprinted from ref. 40 with permission. | ||
This approach was demonstrated by Lindon et al. for blood plasma,21 by Fesik et al. for the screening of protein ligands,67 and is nowadays used for the selective observation of metabolites and proteins in biological fluids and tissues.1,35,37,41
It should also be mentioned that the suppression of high molecular weight components from the NMR spectra may also be carried out by the subtraction of two different spectra: one diffusion spectra in which only large molecules are detected, and another in which large and small molecules are detected. This option suffers from longer experimental time requirements but has been claimed to be more useful than CPMG filtering for automated spectral processing routines.68
In another recent report, this diffusion difference protocol was used in the detection of substoichiometric concentrations of small molecules in protein samples. For example, it was possible to detect 30 μM imidazole in the presence of four different proteins.69
3 Diffusion methods
Diffusion NMR spectroscopy is a collection of NMR experiments in which the resonances of a molecule are attenuated according to its translational diffusion coefficient. This is possible thanks to the application of NMR field gradients that ‘label’ the spins along the direction of the applied gradient, and to the use of certain pulse sequences (based on a spin-echo).70 In the case of a mixture, the spectra of the components can be separated according to their apparent diffusion coefficients. Since the self-diffusion value is related to the size of molecules in solution, this technique relies on differences in the molecular size, and so it shows a lot of similarities to size-exclusion chromatography. Indeed, molecules with different molecular masses but with the same chemical shifts can be well separated. For this reason, this technique is described as ‘in-tube chromatography’ or ‘NMR chromatography’, as it leads to virtual separation of the species in a mixture. Although this technique has become one of the most powerful tools to characterize complex mixtures by NMR without first having to separate the components, it is clearly still undervalued by most chemists.3.1 Basic concepts
Self-diffusion is the random translational motion of ensembles of particles (molecules or ions) as a consequence of their thermal energy. Diffusion behaviour is related to the properties of both individual molecules (size, shape, molecular weight, charge, etc.) as well as those related to the surrounding environment, such as concentration, solvent, temperature and aggregation state. In this way, each component of a mixture can be pseudo-separated, in accordance with its own diffusion coefficient.Quantitatively, this process is measured as the self-diffusion coefficient, D (m2 s−1), which generally decreases with increasing molecular weight (MW). Therefore, for compounds to produce clearly different responses in NMR diffusion experiments, they should have sufficiently diverse molecular weights.
3.2 Methodology and the state of the art
The quality of the final spectrum and its concomitant information content relies on both the quality of the acquired raw data and the appropriate choice of data processing methods.Most diffusion NMR experiments are acquired for the 1H nucleus, but the application of diffusion NMR to 13C NMR spectra has also been described. Specific acquisition parameters must be used to account for the decoupling during the gradient pulses.75 The use of 13C implies an important improvement of spectral resolution that can be useful in the case for complex mixtures, as has been demonstrated for organic molecules and 13C-enriched carbohydrates.75,76
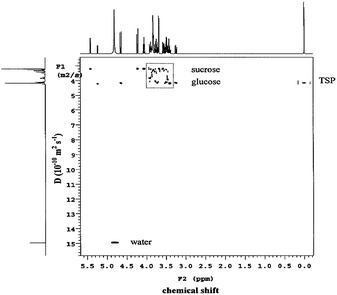 | ||
| Fig. 7 A 2D-DOSY plot of the glucose/sucrose solution with TSP at 21 °C. Reprinted from ref. 72 with permission. | ||
This representation was first proposed by Morris and Johnson in 1992.77 Experimentally, it is achieved by acquiring a series of 1D NMR experiments with different amounts of diffusion weighting. After transforming the acquisition dimension, it is possible to extract the diffusion coefficients for each peak in the direct dimension by fitting the variation of the signal in the indirect dimension. From this information, it is then possible to generate a DOSY spectrum in which one axis corresponds to the chemical shift and the other axis to the apparent diffusion. 2D DOSY is an extremely useful data processing scheme because it enables one to quickly correlate resonances with a specific component in solution, rather than a specific spin system.
Actually, the term ‘2D DOSY’ describes a number of different processing schemes that result in such a 2D plot, but none of these methods can be considered universal, a fact that has limited the spread of this technique.
The 2D DOSY processing techniques can be sorted in two classes: single-channel methods (SPLMOD, CONTIN are implemented in commercial software) and multivariate methods (DECRA, MCR, iRRT). Further information on the selection of the processing procedure can be found in several excellent reviews.9,72,73,78
The main advantages of 2D DOSY are: a) No a priori knowledge of the system is necessary; b) there is no limit to the number of resolved components, and c) it is possible to obtain great precision in the diffusion dimension (differences as little as 1% have been reported).
On the other hand, it has several limitations: a) the resonances have to be completely resolved; b) if there are signals originating from more than one component, their measured diffusion coefficient is the weighted average of those in all of components; c) the method can only be applied with confidence for species within a diffusion window of 2 orders of magnitude;72 d) reference deconvolution (small molecules such as TMS or TSP) must be performed to obtain consistent line shape and high precision in the diffusion dimension.79
• Diffusion-edited spectra and diffusion difference spectra
In a simpler approach, 1D NMR can be carried out using a single field gradient. This method is analogous to relaxation editing but permits the selective observation of high molecular weight components of complex mixtures (see subsection 2.3.5).
Another alternative is the acquisition of two 1D spectra with different diffusion weighting and the subtraction of both spectra. The application of this method to observe low molecular weight metabolites in blood plasma has been described in subsection 2.3.5. The general applicability of this methodology has been proposed by Dorner et al. and exemplified in the analysis of carbohydrate mixtures.80
The main advantage of diffusion-edited spectra and diffusion difference spectra is the short experimental time required, while the main drawback is that with these methods it is only possible to differentiate between species of considerably different size.
1) Using chromatography stationary phases. Addition of chromatography stationary phases (silica gel and HPLC solid supports) slows down the diffusion of some components, and the spectral separation can be enhanced by one order of magnitude.91 A review covering the principles and applications of this approach to mixtures has been provided by Caldarelli et al.92
2) Matrix-assisted DOSY (MAD) with surfactant micelles. Adding surfactant micelles to the mixtures has been shown to enhance resolution when the component molecules interact differentially with the micelles in water solution. The approach was demonstrated using perdeuterated surfactant micelles to study mixtures of peptides with near-identical diffusion coefficients.93 Using micellar SDS solutions, it was possible to resolve mixtures of isomers (such as dihydrobenzenes and monomethoxyphenols).94
3) Using polymers. Morris et al. reported in 2001 the use of weakly acidic and basic polymers to detect association between the polymer and the components of a library on the basis of acid–base interactions.95 In 2009, Heikkinen et al. reported one of the most attractive ways for the enhancement of diffusion coefficient differences by using the inexpensive, commercially available, and very CDCl3-soluble polymer polyvinylpyrrolidone (PVP), as the ‘stationary phase’ due to its known ability to bind to a variety of organic molecules. The interaction of the analytes (with similar molecular weights) with PVP essentially follows normal-phase chromatography rules (Fig. 8).26
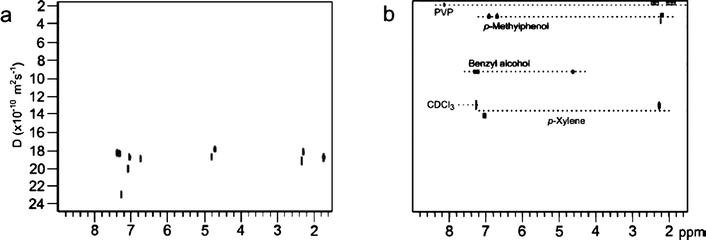 | ||
| Fig. 8 DOSY spectra (500 MHz) of a mixture of benzylalcohol, p-methylphenol and p-xylene before and after addition of 50 mg of polyvinylpyrrolidone (PVP). Reprinted from ref. 26 with permission. | ||
4) Using complexation agents. Another strategy to enhance the separation of mixtures by DOSY was developed by Sanström et al. by using complexation agents such as β-cyclodextrin (β-CD) and bovine serum albumin (BSA). In this method, β-CD and BSA were added to a mixture of catechins to mimic chromatographic conditions and modify the average mobility, and they were analyzed by DOSY using liquid and high-resolution magic-angle spinning (HR-MAS) NMR probes. The best spectral separation of the components was achieved with β-CD in the liquid probe using a 15%CD3CN–85%D2O solution. This methodology was also applied to the analysis of catechins from green tea extract.96
The separation of sugar mixtures using DOSY has been enhanced on the basis of the complex formation abilities of some carbohydrates with cations. Thus, DOSY was used as a tool to distinguish between the complexed and non-complexed forms in a mixture, due to the differences in their relative diffusion coefficients. This strategy was used for the separation of mixture of sugars in the presence of lanthanide cations, because those sugars having a particular relationship between their hydroxyl groups are able to form complexes in water.97
3.3 Applications of diffusion NMR spectroscopy to NMR analysis of complex mixtures
Although diffusion NMR measurements for analysis of mixtures are used in many different fields such as polymer mixtures, supramolecular and combinatory chemistry,98 quick screening methods for bioactivity, and mixture analysis in the solid state, this review is focused on the analysis of complex mixtures in areas such as natural products, food chemistry, pharmaceuticals, biological fluids and other mixtures. In this section, we will describe the most representative reports of applications of DOSY analysis to unravel the NMR spectra of different types of mixtures characteristics of those areas.The comparison of hot- and cold-water extracts of cannabis, as well as of extracts made from ethanol–water mixtures (tinctures with different ethanol strength) were reported by Prieto et al. using diffusion-edited DOSY 1H NMR along with 1H NMR experiments with suppression of the ethanol and water signals. The main aim of this study was to better understand how these extracts differ in their overall composition and to distinguish between tinctures from different cannabis cultivars. They found that temperature of the water and polarity of the ethanol–water mixtures used for the extraction were the two factors that affected total amount of Δ9-THC in the extracts and its relative quantity with respect to Δ9-THC-acid and other metabolites.99
The same authors applied both NMR experiments to the direct analysis of commercial herbal tinctures derived from Echinacea purpurea, Hypericum perforatum, Ginkgo biloba, and Valeriana officinalis in order to obtain a metabolic fingerprint useful to distinguish tinctures prepared from different plants. Batch-to-batch homogeneity, as well as degradation after the expiry date of a batch, was also investigated. In this case, single chemical entities were difficult to identify due to the signal overlap from different compounds. The diffusion-edited DOSY 1H NMR (1D DOSY) experiments and 1H NMR with suppression of the ethanol and water signals allowed them to identify some caffeic acid conjugates from the aromatic protons, and the presence of carbohydrates/polysaccharides.100
The first application of 2D DOSY and 3D DOSY–COSY experiments to a herbal mixture was published by Malet-Martino and co-workers. The main objective of that work was to determine the synthetic drugs that some manufacturers have included in formulations marketed as ‘herbal medicines’ or ‘dietary supplements’. Furthermore, they studied the composition of 17 different herbal drugs and dietary supplements for erectile dysfunction and found eight formulations adulterated with synthetic PDE-5 inhibitors or analogues. Although the 2D DOSY 1H NMR analyses provide a lot of information about the active pharmaceutical ingredients (API) in the extracts, the main advantage of this 3D experiment was the ability to extract the COSY spectrum of each component of the mixture from a selected line in the DOSY spectrum. This is indeed very useful for its structural determination. The results were confirmed by LC–MS–MS analysis and by comparison of 1D 1H NMR data of standards.101
The application of 2D DOSY analysis and other NMR experiments allowed differentiation between Chinese and Korean ginseng root powder. In addition, the method was also able to identify Korean ginseng roots from a single region with different ages, showing that there are compositional transitions depending on the age of the material. More specifically, DOSY analysis was applied to distinguish the signals from low molecular weight compounds (i.e. amino acids) from those for large molecular compounds (i.e. ginsenosides). It showed that the methyl signals come from high molecular weight compounds and that the sugar signals are either from oligosaccharides or ginsenosides. In terms of the composition of the Korean ‘Jeonra’ ginseng and Chinese ginseng, these results suggest that the former contains more ginsenosides, whereas the latter may contain more oligosaccharides.102
A new 2D DOSY experiment was described that is based on a Bipolar Pulse Pair Stimulated Echo (BPPSTE) including an Excitation Sculpting (ES) water signal suppression. It was applied to the analysis of black tea infusions, allowing the assignment of their main constituents (caffeine, theogallin, theanine, and catechins, among others) (Fig. 9).103
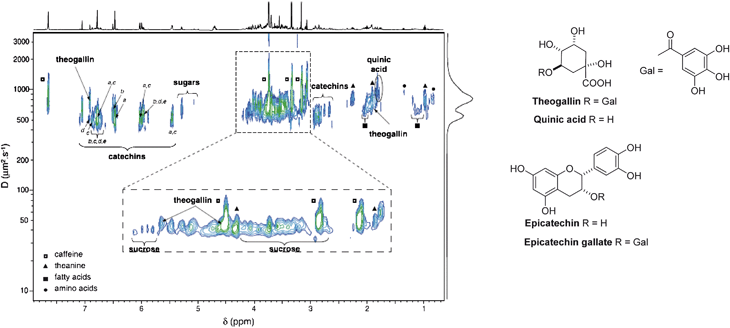 | ||
| Fig. 9 1H DOSY-ES NMR spectrum of black tea infusion recorded at 298 K (10% D2O, pH 5.2): a) epigallocatechin gallate, b) epigallocatechin, c) epicatechin gallate, d) epicatechin, e) catechin. The blue and green colours represent weak and strong signal intensities. Reprinted from ref. 103 with permission. | ||
In order to find novel dereplication methods in natural products chemistry, Gerwick et al. developed two new diffusion-edited NMR experiments, improved DECODES and HETDECODES, that sort the constituents in a mixture by their individual diffusion coefficients. These experiments allowed the partial NMR spectral assignment and cursory structure elucidation of many components of the mixtures.104
In a research aiming to improve fermentation systems and to speed up bioprocess development, DOSY experiments were used to identify both co-metabolites and impurities from different strains and culture conditions. This approach was validated in the production of lovastatin from Aspergillus terreus.105
Application of 2D DOSY to crude bromopyrrole fractions from Okinawan marine sponges allowed the identification of two new bromopyrrole alkaloids, agesamides A and B, as well as several other known metabolites.106
2D DOSY was also applied to the identification of the components of the ethyl acetate fraction of Bidens sulfurea, and allowed the identification for the first time in this plant of four flavonoid glycosides derived from quercetin. Its 2D DOSY NMR spectrum shows that the sample is composed of a mixture of substances presenting a high degree of structural similarity, spread over a logD between −9.8 and −10.0.107
A very practical application of 1D DOSY was reported in the characterization of three saponins isolated from the polar extract of Agave brittoniana leaves. Thus, an edited-spectrum DOSY was used to filter out the residual water signal and to obtain a clear view of the signals near to water (anomeric protons of the saponin sugars). Other techniques for the suppression of solvent signal such as presaturation of the water signal would affect the anomeric resonances.108
In a very recent report, a DOSY methodology was developed to resolve mixtures of mono-, di-, and triacylglycerides (along with their methyl esters) derived from vegetable oils for biodiesel production.109
Diffusion-type experiments have also been proven to be useful for the analyses of mixtures of polysaccharides. For example, diffusion difference NMR spectroscopy was used in analysis of carbohydrate mixtures, including a mixture of two homoglycans which differ only in chain length, a peptidoglycan for the characterization of the linkage region between a bacterial cell wall polysaccharide and the surface-layer (S-layer) protein, and finally, the monitoring of adenosine monophosphate (AMP) derivatization.80 In another interesting example, Mannina and co-workers described in 2003 the use of 2D DOSY to estimate the average molecular weight of uncharged polysaccharides. DOSY experiments on six well-characterized pullulan fractions of different molecular weights were carried out on dilute aqueous solutions. The calibration curve was validated with a series of compounds of known molecular weight, including oligo- and polysaccharides as well as synthetic polymers and small molecules. Furthermore, DOSY was shown to allow the spectral resolution of mixtures of two dextran homopolymers with different molecular weights (1.27 and 668 kDa). The results demonstrated that DOSY has, over other methodologies, the advantage of allowing the measurement over a wider range of molecular weights.110
An application of 2D DOSY to characterize the size of different N-acetyl-chitooligosaccharides (GlcNAc)1±6 and their complexes to protein receptors such as the small binding protein hevein has been reported by Jimenez-Barbero et al. In this study, DOSY has also been applied to two synthetic related oligosaccharides (GlcNH2-(GlcNAc)4 and GlcNH2-(GlcNAc)2-GlcNAcSO3Na), and their molecular weights could be estimated to within 10% error. The evaluation of the stoichiometry of the complexes formed between hevein and (GlcNAc)6 showed that 2D DOSY is a complementary method to other currently used physical biochemical methods, such as analytical ultracentrifugation and size exclusion chromatography (SEC).111
Application of 2D DOSY analysis to the polysaccharidic fraction from the mycelium of the basidiomycete mushroom Lentinula edodes, grown on olive mill waste-water, showed the presence of two polysaccharides of different sizes. They were identified as xylan and lentinan with the help of 1D and 2D NMR techniques. Lentinan is known for its antitumor, antibacterial, antiviral, anticoagulatory and wound-healing activities.112
A detailed study of the polysaccharides present in hot aqueous extracts of Chlorella pyrenoidosa was performed by 2D DOSY NMR. These experiments measured the molecular weights of the arabinogalactans, extending the relationship between diffusion coefficients and molecular weights to different types of neutral polysaccharides. DOSY experiments were also used to determine the molecular weight dispersions of various arabinogalactans.113
Similarly, 2D DOSY analysis and diffusion-edited 1H NMR spectra (1D DOSY) were applied to the study of high molecular weight polysaccharides obtained from various mushroom extracts and fractions. The main objectives were to monitor the fractionation procedure, and to check the purity of the isolated polysaccharides as well as their molecular size. It is worth noting that DOSY was also used to effectively filter out the signals of the low molecular weight compounds.114
Also, 2D DOSY has been applied to the screening of different batches of heparins and to obtain impurity profiles of the batches (mainly comprising oversulfated chondroitin sulfate, OSCS). This method was also successfully applied to differentiate between (a) unfractionated heparins, (b) the OSCS impurity (18 kDa),12 and (c) the low molecular weight heparins (LMWHs, around 4–8 kDa) obtained by partial depolymerization of heparin. The 1H NMR DOSY traces of the N-acetyl region were used to identify OSCS in the LMWHs.115
One of the first examples of this type of 1D and 2D DOSY application was the analysis of the ‘signature’ of 5 commercial formulations of ciprofloxacin tablets purchased in different countries, including some with a non-regulated market. In addition to ciprofloxacin, several excipients could be observed depending on the formulation studied. DOSY spectra clearly showed similarities and differences in the composition of the pharmaceutical formulations, thus giving a signature of the manufacturer.116
In the particular case of pharmaceutical formulations of tadalafil, genuine Cialis® and seven illegally manufactured formulations of this drug were analysed by 2D DOSY NMR. The samples displayed similarities and differences sufficient to produce a precise and global ‘signature’ of the manufacturer, including not only the active pharmaceutical ingredient(s) but also the excipients. The self-diffusion coefficient value was measured for each peak and an average self-diffusion coefficient was determined for each formulation. The differences in the values of the diffusion coefficients for the same component in the different formulations are due to the different viscosity of each formulation. The data obtained in this study showed that the quality of the Cialis® ‘imitations’ manufactured in India and Syria was acceptable, whereas the Chinese formulation was adulterated with other active pharmaceutical ingredients.118
In another work, the specific ‘signature’ of several pharmaceutical formulations (solid and liquid) of fluoxetine and fluvoxamine was obtained with 2D DOSY NMR. This study allowed the characterisation of the active ingredients and excipients present in the formulations studied. The DOSY spectra of brand and generic formulations of fluvoxamine were identical, whereas some differences could be seen between the brand-named and the generic formulation of fluoxetine. Fluoxetine and fluvoxamine have similar molecular weights, but by adding β-cyclodextrin as a complexing agent, 2D DOSY separation was obtained.119
The first application of a 3D DOSY–COSY experiment to a pharmaceutical formulation was the analysis of 17 formulations of sildenafil. One of them was the genuine Viagra®, while the others were illegally manufactured formulations of this drug from India, Syria and China (Fig. 10). In this 3D DOSY–COSY 1H NMR experiment, the COSY spectrum of each component of the mixture was successfully extracted from a selected line in the DOSY spectrum, allowing an easier structural determination. This study allowed the authors to distinguish imitations or counterfeit samples from the authentic formulation by detecting the presence of sildenafil or adulterants and other excipients. The precise global ‘signature’ of each drug indicated that the quality of products manufactured in India and Syria was better than those of the Chinese formulations, which were adulterated with vardenafil and homosildenafil.117
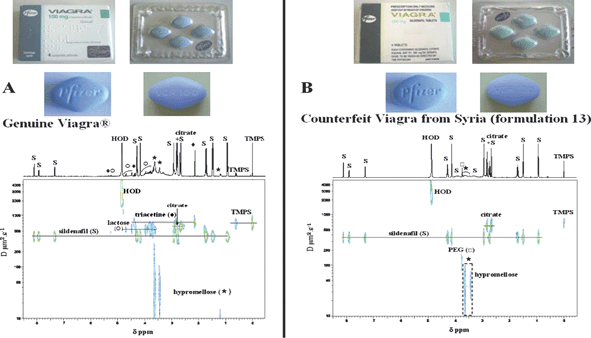 | ||
| Fig. 10 2D DOSY 1H NMR spectra in D2O of tablets from (A) genuine Viagra® and (B) the Syrian counterfeit formulation 13. (S) sildenafil; (*) hypromellose; (■) triacetine; (Y) lactose; (○) polyethylene glycol (PEG). TMPS (trimethylsilylpropane sulfonic acid) is the internal reference. Reprinted from ref. 117 with permission. | ||
The integral characterization of counterfeit antimalarials constitutes another demonstration of the power of 2D DOSY 1H NMR to provide a highly comprehensive chemical fingerprint of pharmaceutical formulations and complex mixtures. In this study, 14 different artesunate-based antimalarial drugs, representative of those that can be purchased from informal sources in southeast Asia, were investigated by a combination of 2D DOSY and mass spectrometry techniques. The expected active pharmaceutical ingredient (API), artemisinin, was detected in only five formulations along with common organic excipients such as sucrose, lactose, stearate, dextrin, and starch. The remaining formulations were shown to contain various ‘wrong’ APIs.120
A comprehensive assignment of the proton spectra of both tomato pulp and juice was obtained by combination of 2D DOSY and other 1D and 2D NMR experiments (J-resolved, COSY, TOCSY, HSQC, HMBC and HR-MAS). The comparison between the juice and pulp spectra shows that essentially all the water-soluble substances present in the pulp are present in the juice. On the basis of the assignments made, the qualitative and quantitative characterization of tomato juice from two tomato cultivars (Red Setter and Ciliegino) was also determined. The results suggest that NMR could be a very useful tool for the characterization of tomatoes, especially when statistical analysis is used, since quantitative determination of many compounds could be obtained by a single experiment.121
Very few PGSE NMR studies have been applied to the self-diffusion of small solutes in natural polysaccharide polymers used in the food industry as thickeners. Since aroma diffusion in food matrices could have an impact on flavour release, this study is an interesting and economic challenge. In this context, a 2D DOSY analysis to investigate the diffusion of two aroma-producing compounds, ethyl butanoate and linalool, in different gelling states was performed by using ι-carrageenan matrix as food model.122
A DOSY analysis was also applied to fruit juices (apple and grape) and beer. This technique was shown to be particularly useful for aliphatic, sugar and aromatic compounds. In the case of apple juice, DOSY spectra confirmed the expected predominance of sucrose, glucose and fructose, the presence of some organic acids (e.g. quinic, malic, citric and tartaric acids) in the aliphatic region, and chlorogenic acid and epicathechin in the aromatic region. The grape juice showed greater complexity than apple juice. Its aliphatic region was dominated by signals due to the presence of many amino acids superimposed with several aliphatic organic acids; the sugar region is dominated by glucose and fructose, while the aromatic region displays evidence of tyrosin, phenylalanine, gallic acid, niacin, uridine and hydroxycinamic acids. Finally, two beer types were analysed by DOSY, which showed some small differences between them.123
The first 2D DOSY study on wine was performed on samples of port wine. This analysis aimed not only to identify the main components but also to achieve improved interpretation of the composition differences between wines of different ages. This study showed the evolution of the size of the polyphenols after aging. Indeed, 2D DOSY showed that the most notable difference introduced by age was the decrease in the concentration of polyphenolic molecules and the simultaneous appearance of new small compounds, reflecting the molecular breakdown occurring with wine aging.124
The application of 2D DOSY along with 1D and 2D NMR and hyphenated NMR (LC–NMR and LC–NMR–MS) to the characterization of mango juice allowed the identification of more than 50 compounds. More specifically, the diffusivity information provided by 2D DOSY allowed some previous ambiguous assignments, such as some singlets in the aromatic region and the two broad signals in the same region, previously assigned to polyphenols and now attributed to glutamine, to be clarified (Fig. 11). Furthermore, this work incorporated a study of compositional changes taking place as a function of ripening. They found that as ripening proceeds, many compositional changes occur, and by signal integration, absolute concentrations were obtained for organic acids, amino acids, and sugars. DOSY also proved to be of use in providing average relative molecular mass estimates for the pectic fraction of both unripe and ripe juices, reflecting the expected decrease in size as ripening (and hence pectin hydrolysis) proceeds.125
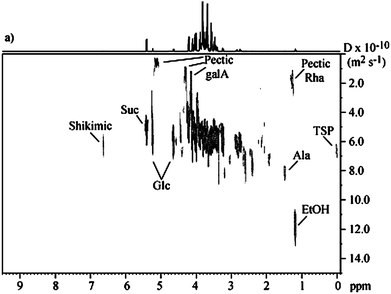 | ||
| Fig. 11 2D DOSY spectrum of ripe mango juice. Reprinted from ref. 125 with permission. | ||
Humic substances have been traditionally thought to be high molecular weight, cross-linked macromolecules with mostly undetermined structures. The application of 1D and 2D DOSY to two extracts of humic substances demonstrated the presence of numerous aliphatic and aromatic compounds, as well as sugars and amino acids. These studies demonstrated that fulvic and humic acids are in fact aggregates composed by relatively simple molecules that take on colloidal properties in the presence of metal ions.126,127
Later on, different research groups confirmed its aggregate nature, described the presence of lignin, peptides and sugars, and determined the differences in the main components in humic acid and fulvic acid.128 In the particular case of the humic substances isolated from vermicompost, 2D DOSY served to study its composition and the changes produced after transformation.129
2D DOSY has been applied to the study of a percholic acid extract from gerbil brain, allowing the identification of 15 metabolites.130
A new approach to aid complex biomixture analysis is statistical diffusion-ordered spectroscopy (S-DOSY). This technique combines DOSY with statistical total correlation spectroscopy (STOCSY), and its usefulness was demonstrated in the characterization of urinary biomarkers and in studies on plasma.131
The new 2D DOSY experiment based on a bipolar pulse pair stimulated echo (BPPSTE) sequence including an excitation sculpting (ES) water signal suppression sequence, was applied to the analysis of human plasma, allowing the molecular weight-based separation of the compounds. The large difference between the molecular weights of metabolites and macromolecules (proteins, lipids) leads to an excellent separation on the 2D DOSY-ES spectrum. In this way, low molecular weight metabolites (amino acids, lactate, creatine, etc.) were localized at the top of the spectrum, while proteins or lipids were localized towards the bottom.103
4 Other methods
4.1 Selective saturation and magnetization transfer
Rabenstein et al. described the use of presaturation to partially eliminate the hemoglobin envelope from 1H NMR spectra of intact erythrocytes, but retaining the signal of most low molecular weight metabolites.133 The method is similar to the suppression of water by selective presaturation, but in this case, the saturation is transferred to protons of the less mobile parts of a large protein (due to spin diffusion by cross-relaxation), and therefore the suppression attains not only the region of the presaturation but also the whole protein spectrum. This method not only suppresses the hemoglobin envelope, but also any other resonances near the presaturation, and so does not allow such good pesudo-separation as relaxation editing.4.2 TOCSY
The TOtal Correlation SpectroscopY (TOCSY) experiment (1D and 2D versions) is conventionally used for the identification of resonances generated by a one-spin system in a molecule. In the 1D version, a single resonance is selectively irradiated, and the magnetization propagates through the 1H coupling network, resulting in the selective and clean visualization of the whole spin network.Subramanian et al. showed the high potential of 1D-TOCSY experiments for the analysis of mixtures by separating the spectra of two isomers (cyclic lactones).134 Lindon et al. first applied 1D TOCSY for the analysis of a complex mixture, allowing the detection and assignment of pyroglutamate and uracil in seminal fluid.135 This method has been also applied to several other systems such as synthetic organic intermediates;136 the identification of heroin in street doses for forensic studies;137 the identification and quantification of minor components (amino acids) in honey,138 in metabonomic studies of urine,139 and in the analysis of balsamic vinegar of Modena (Fig. 12).66
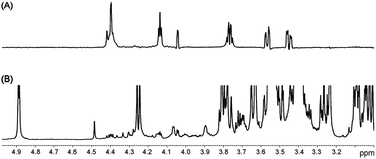 | ||
| Fig. 12 (A) Selective TOCSY experiment on balsamic vinegar of Modena obtained by using a selective Gaussian-shaped pulse centred at 4.44 ppm. (B) T2-filtered spectrum of the same sample. Reprinted from ref. 66 with permission. | ||
In a different application, the association constant of an artificial receptor–carbohydrate complexation was determined by TOCSY titration to overcome the severe overlapping in the 1H NMR spectra.140
Murthy et al. have used 2D TOCSY experiments to analyze mixtures of inositol phosphates. Since all protons of the inositol ring are part of a connected spin system, it was possible to extract the individual 1H subspectra of each component without prior separation.141 2D TOCSY has also been employed to show three diastereomeric lanthionine-bridged peptides in a reaction mixture.142 Bruschweiler et al. have optimized the processing and data analysis of 2D-TOCSY for the analysis of mixtures, and applied it to the metabolic profiling of an insect venom (from Anisomorpha buprestoides).143
Advantages and drawbacks. The main advantage of TOCSY, compared to diffusion and relaxation editing, is that no difference in molecular weight or mobility is required to obtain the pseudo-separation. The unique requirement is the existence of a one spin multiplet clearly isolated from the rest of the spectra.
On the other hand, the main drawback is that the spectra of a spin system and not of the whole molecule, is obtained. This means that it is rather a method for selection than for suppression. For example, in a mixture of proteins with low molecular weight metabolites, it is not possible to obtain the spectra of the overall mixture of metabolites (without the proteins), but only the spectra of each individual component separately.
4.3 J-resolved spectroscopy (JRES)
The 2D 1H J-resolved NMR (JRES NMR) experiment was introduced 1976 by Ernst et al.144 JRES consists of an array of spin-echo pulse elements, in which an incremented delay period is used to define a second frequency dimension. After appropriate data processing,4,145,146 the chemical shift and J-coupling information are resolved on two different dimensions while the resonance intensities are edited on the basis of the proton T2 relaxation times. From the 2D JRES experiment it is possible to extract a projection that is quite similar to an ordinary 1D spectrum (p-JRES), where each proton appears as a single peak, irrespective of the multiplicity of the original signal and hence effectively yielding a 1H broadband-decoupled spectrum. This simplifies the 1D NMR spectra, facilitating the separation of the signals in crowded areas, although information on J-couplings is lost.JRES experiment has been applied to the analysis of biological fluids (blood plasma and urine) since the late 1980s, allowing (for example) the assignment of the 3–4 ppm spectral region in blood plasma for the first time.147 Since then, JRES has been applied in metabolomics studies on biological fluids, such as cerebrospinal148 and seminal fluid,135 as well as to tissues (in this case JRES to HR-MAS),55,149 for the elimination of polymer resonances in combinatorial chemistry,150 and for spectral simplification in complex reaction mixtures.151
Although the J-resolved spectrum is always obtained in the 2D mode, the data analysis is more frequently carried out in the 1D p-JRES spectrum.4,5 The advantage lies in the combined action of relaxation filtering and absence of couplings. This is exemplified in Fig. 13, where proteins and lipoproteins are eliminated or strongly attenuated respectively in the JRES experiment. For their part, the groups of Verpoorte and Viant developed the application of JRES to extracts from plants152 and aquatic species.153 Examples can also be found in invertebrates (e.g. the hemolymph of tobacco hornworms).154
 | ||
| Fig. 13 Comparison of unedited, diffusion-edited, T2-edited and p-JRES spectra of plasma. Reprinted from ref. 4 with permission. | ||
Advantages and drawbacks. The main advantages of p-JRES spectra versus CPMG editing are the increased resolution and attenuation of macromolecules with respect to that obtained using T2 editing (Fig. 13). On the other hand, the main disadvantages are the longer data acquisition times required (although these are still shorter than those of other 2D NMR methods) and the phase-twisted line shapes which complicates the quantification.146 Overall, JRES and CPMG editing should be taken as complementary techniques because the information contained in JRES projections is intrinsically different from that obtained in the CPMG spectra.145
4.4 ‘Virtual’ relaxation-edited spectroscopy (RESY)
A completely different approach for spectral simplification is based on the use of processing procedures that resemble a CPMG filter. These methods try to attenuate the signals from protons with short transverse relaxation times and to enhance the signals originating from small molecules. This methodology was first described by Lindon et al., who applied a Gaussian shaping to the free induction decay (G-RESY).155 In 2008 the same author expanded this technique using a different mathematical function,156 named as D-RESY (Derivative-based RElaxation-edited SpectroscopY). This ‘virtual’ relaxation-edited spectrum was shown to be very useful in the identification of biomarkers for type 2 diabetes in human blood plasma, formerly accomplished by CPMG spectra. Fig. 14 shows the D-RESY and G-RESY spectra together with the CPMG.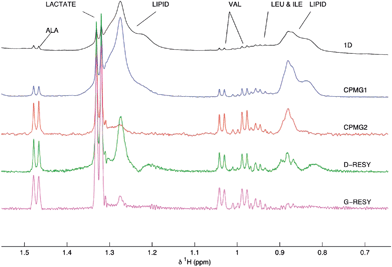 | ||
| Fig. 14 1H NMR from human blood plasma: black, 1H; blue and red, CPMG with 102.4 and 608 ms T2 filtering; green and magenta, D-RESY and G-RESY, respectively. Reprinted from ref. 156 with permission. | ||
Advantages and drawbacks. The main advantages of this approach vs. CPMG are the better signal-to-noise ratio and that it can be used to extract information hidden (or simply not previously analyzed) information in archived 1H NMR data sets. It should be stressed that these processing approaches are not a substitute for T2 editing. Indeed, if very closely spaced narrow signals coming from protons with long T2 times are present, they could be observed in the CPMG but not in the D-RESY spectrum, especially at lower fields.
4.5 Paramagnetic spin relaxation (PSR) filtering
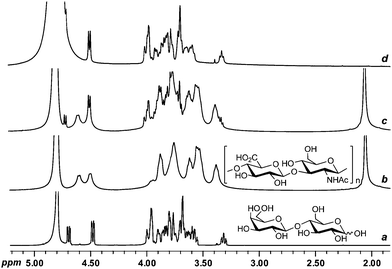
Although it is known that nuclei relax faster in the presence of paramagnetic spin relaxing metal ions,157 the application of this concept for unravelling the spectra of complex mixtures was not disclosed until 2007 by the group of Fernandez-Megia and Riguera.158The principle of PSR filters rests on: i) the inverse proportionality between T2 and the spectral line width, and ii) the different ability of the various functional groups within a mixture to complex PSR metal ions through fast chemical exchange.157 Accordingly, these authors have described that the addition of increasing concentrations of a PSR metal ion to a mixture sharply reduces the relaxation times (and broadens the line width) of those constituents with the highest ion-complexing ability (acidic and polyanionic species). Eventually, at higher ion concentrations these signals could became embedded in the baseline,159 while leaving unaffected those of other less sensitive components (e.g., amides, ammonium and hydroxyl groups, and ethers)
For this application, Gd3+ was selected as PSR ion based on its high electronic relaxation time (τs) and the presence of a large number of unpaired electrons. When Gd3+ (0.4 mM) was added to a mixture of lactose and hyaluronic acid (HA), the resonances corresponding to HA were completely removed, and only those of lactose were seen in the spectra, without loss of resolution or signal-to-noise ratio (Fig. 15). The same approach has been applied to many other mixtures where the signals corresponding to the most strongly Gd3+-complexing species were selectively suppressed in 1H, 13C, and even 2D NMR experiments (COSY and HMQC).158
 | ||
| Fig. 15 1H PSR filtering. 1H NMR spectra (D2O, 500 MHz) of (a) lactose, (b) HA, (c) a mixture of lactose and HA in the absence of Gd3+, and (d) a mixture of lactose and HA in the presence of Gd3+ (0.4 mM). | ||
The same group has recently shown (unpublished results) that a PSR filter effectively suppresses the resonances of the sulfate containing triterpene and steroidal glycosides santiagoside and lefevreioside in the presence of neutral sugars.160 As an example, Fig. 16 shows the suppression of the signals of a marine triterpene asterosaponine in the presence of methyl-α-D-glucopyranoside.161
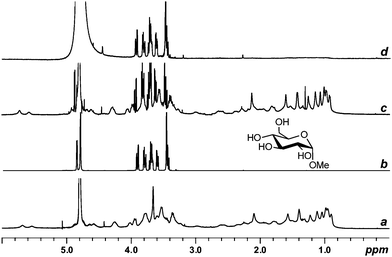 | ||
| Fig. 16 1H PSR filtering. 1H NMR spectra (D2O) of (a) santiagoside, (b) methyl-α-D-glucopyranoside, (c) a mixture of santiagoside and methyl-α-D-glucopyranoside in the absence of Gd3+, and (d) a mixture of santiagoside and methyl-α-D-glucopyranoside in the presence of Gd3+ (0.5 mM). | ||
Interestingly, PSR filters have been used in combination with CPMG (a PSR-CPMG filter) in cases where species with similar 1H T2 values and sensitivities to Gd3+ were not practical by applying the PSR filter alone.
Advantages and drawbacks. The main advantage of the PSR filter is its high insensitivity to molecular weight, in contrast to CPMG and diffusion filters that depend on differences of T2 and diffusion coefficients that are greatly affected by molecular weight. This has allowed the implementation of combined PSR filters with CPMG and diffusion to produce multiple or sequential suppressions with unprecedented results. However, ways to extend this methodology to other less sensitive substrates, and efforts to quantify the sensitivity of different compounds to PSR ions, are needed in order to predict selective suppressions in mixtures.
5 Conclusions
This review describes the most important ways to selectively simplify the NMR spectra of complex mixtures on the basis of the relaxation, diffusion and other characteristics of the components. These methods are complementary, so judicious selection and adjustment of the acquisition parameters can allow the suppression of different classes of components in a mixture.A convenient approach is to use a diffusion filter to attenuate/suppress the signals from the small molecules leaving untouched those of the larger ones, and/or to use a relaxation filter to attenuate/suppress the signals due to the large molecules, enabling visualization of just the smaller ones. When a strong signal overlap exists and further simplification is needed, J-resolved spectroscopy (simultaneous relaxation filtering and effective 1H broadband-decoupling) and TOCSY (selective and clean visualization of a spin network) can be used. Finally, a completely different method relies on the addition of paramagnetic agents (PSR filtering), that allows the attenuation/suppression of the signals coming from compounds interacting with the PSR agent, irrespective of their molecular weight. A summary is provided in Table 1.
| Method | Application | Pseudo-separation basis | Key parameters |
|---|---|---|---|
| Relaxation filtering | Attenuation/suppression of macromolecules | Relaxation times | Length and number of loops (CPMG) |
| Diffusion filtering | Attenuation/suppression of low molecular weight molecules | Translational motion | Diffusion time, pulse length |
| TOCSY | Visualization of a spin network | J coupling | Mixing time |
| J-Resolved spectroscopy | Effective broadband decoupling and relaxation filtering | J coupling | Increment time, spectral processing |
| PSR filtering | Suppression of molecules interacting with the PSR agent | Paramagnetic relaxation enhancement | PSR agent concentration, complexing ability |
The above methods have been applied with success mainly to biological samples, pharmaceutical preparations, foods and beverages. In addition, a few examples of applications to living organisms and natural products have been also reported. In our view, it is only a matter of time that extracts will be investigated using these ‘pseudo-separation’ techniques, instead of devoting such a huge effort to isolation and dereplication.
6 Acknowledgements
This work was financially supported by the Spanish Government (CTQ2009-10963; CTQ2008-01110; CTQ2009-0863; AGL2009-12266-C02-02) and the Xunta de Galicia (PGIDIT09PXIB209029PR; PGID08CSA045209PR). The authors thank Dr Manuel Martin-Pastor for helpful discussions.7 References
- H. Tang, Y. Wang, J. K. Nicholson and J. C. Lindon, Anal. Biochem., 2004, 325, 260 CrossRef CAS.
- A. Daniels, R. J. P. Williams and P. E. Wright, Nature, 1976, 261, 321 CrossRef CAS.
- F. F. Brown, I. D. Campbell, P. W. Kuchel and D. C. Rabenstein, FEBS Lett., 1977, 82, 12 CrossRef CAS; D. L. Rabenstein, A. A. Isab and D. W. Brown, J. Magn. Reson., 1980, 41, 361 CAS; D. L. Rabenstein, S. J. Backs and A. A. Isab, J. Am. Chem. Soc., 1981, 103, 2836 CrossRef CAS; D. L. Rabenstein, J. Chem. Educ., 1984, 61, 909 CAS.
- O. Beckonert, H. C. Keun, T. M. D. Ebbels, J. Bundy, E. Holmes, J. C. Lindon and J. K. Nicholson, Nat. Protoc., 2007, 2, 2692 Search PubMed.
- O. Beckonert, M. Coen, H. C. Keun, Y. Wang, T. M. D. Ebbels, E. Holmes, J. C. Lindon and J. K. Nicholson, Nat. Protoc., 2010, 5, 1019 Search PubMed.
- E. M. Lenz and I. D. Wilson, J. Proteome Res., 2006, 6, 443.
- J. K. Nicholson and I. D. Wilson, Prog. Nucl. Magn. Reson. Spectrosc., 1989, 21, 449 CrossRef CAS.
- U. Holzgrabe, in NMR Spectroscopy in Drug Development and Analysis, ed. U. Holzgrabe, I. Wawer and B. Diehl, Wiley-VCH, Weinheim, 1999, ch. 8, p. 119 Search PubMed.
- A. G. Palmer III, Chem. Rev., 2004, 104, 3623 CrossRef CAS; D. M. Korzhnev, M. Billeter, A. S. Arseniev and V. Y. Orekhov, Prog. Nucl. Magn. Reson. Spectrosc., 2001, 38, 197 CrossRef CAS; F. Heatley, Prog. Nucl. Magn. Reson. Spectrosc., 1979, 13, 47 CrossRef CAS.
- J. W. Peng, J. Moore and N. Abdul-Manan, Prog. Nucl. Magn. Reson. Spectrosc., 2004, 44, 225 CrossRef CAS.
- F. W. Benz, J. Feeney and G. C. K. Roberts, J. Magn. Reson., 1972, 8, 114 CAS.
- H.-R. Tang, Y.-L. Wang and P. S. Belton, Solid State Nucl. Magn. Reson., 2000, 15, 239 CrossRef CAS.
- M.-B. Tessem, M. G. Swanson, K. R. Keshari, M. J. Albers, D. Joun, Z. L. Tabatabai, J. P. Simko, K. Shinohara, S. J. Nelson, D. B. Vigneron, I. S. Gribbestad and J. Kurhanewicz, Magn. Reson. Med., 2008, 60, 510 CrossRef CAS.
- J. D. Bell, J. C. C. Brown, J. K. Nicholson and P. J. Sadler, FEBS Lett., 1987, 215, 311 CrossRef CAS.
- J. D. Bell, J. C. C. Brown, G. Kubal and P. J. Sadler, FEBS Lett., 1988, 235, 81 CrossRef CAS.
- C. M. Preston and B. A. Blackwell, Soil Sci., 1985, 139, 88 CrossRef CAS.
- D. L. Rabenstein and T. T. Nakashima, Anal. Chem., 1979, 51, 1465A CAS; D. L. Rabenstein, Anal. Chem., 1978, 50, 1265A CrossRef CAS.
- S. Meiboom and D. Gill, Rev. Sci. Instrum., 1958, 29, 688 CAS; H. Y. Carr and E. M. Purcell, Phys. Rev., 1954, 94, 630 CrossRef CAS.
- F. Rastrelli, S. Jha and F. Mancin, J. Am. Chem. Soc., 2009, 131, 14222 CrossRef CAS.
- D. L. Rabenstein, T. Nakashima and G. Bigam, J. Magn. Reson., 1979, 34, 669 CAS.
- M. Liu, J. K. Nicholson and J. C. Lindon, Anal. Chem., 1996, 68, 3370 CrossRef CAS.
- J. A. Chin, A. Chen and M. J. Shapiro, J. Comb. Chem., 2000, 2, 293 CrossRef CAS.
- J. Yan, A. D. Kline, H. Mo, E. R. Zartler and M. J. Shapiro, J. Am. Chem. Soc., 2002, 124, 9984 CrossRef CAS.
- W. H. Otto and C. K. Larive, J. Magn. Reson., 2001, 153, 273 CrossRef CAS.
- A. M. Dixon and C. K. Larive, Anal. Chem., 1997, 69, 2122 CrossRef CAS.
- J. S. Kavakka, I. Kilpeläinen and S. Heikkinen, Org. Lett., 2009, 11, 1349 CrossRef CAS.
- B. A. Becker, K. F. Morris and C. K. Larive, J. Magn. Reson., 2006, 181, 327 CrossRef CAS.
- T. T. Nakashima and D. L. Rabenstein, J. Magn. Reson., 1986, 66, 157 CAS.
- P. G. Williams, J. K. Saunders, M. Dyne, C. E. Mountford and K. T. Holmes, Magn. Reson. Med., 1988, 7, 463 CrossRef CAS.
- D. Tréhout, M. Desille, B.-T. Doan, S. Mahler, B. Frémond, Y. Mallédant, J.-P. Campion, J. Desbois, J.-C. Beloeil, J. D. Certaines and B. Clément, NMR Biomed., 2002, 15, 393 CrossRef.
- B. Luy, K. Kobzar, S. Knor, J. Furrer, D. Heckmann and H. Kessler, J. Am. Chem. Soc., 2005, 127, 6459 CrossRef CAS.
- V. Gilard, S. Trefi, S. Balayssac, M. A. Delsuc, T. Gostan, M. Malet-Martino, R. Martino, Y. Prigent, F. Taulelle, U. Holzgrabe, W. Iwona and D. Bernd, in NMR Spectroscopy in Pharmaceutical Analysis, ed. U. Holzgrabe, I. Wawer and B. Diehl, Elsevier, Amsterdam, 2008, ch. 6, p. 269 Search PubMed.
- L. M. Smith, A. D. Maher, E. J. Want, P. Elliott, J. Stamler, G. E. Hawkes, E. Holmes, J. C. Lindon and J. K. Nicholson, Anal. Chem., 2009, 81, 4847 CrossRef CAS.
- F. Schroeder, D. Gibson, A. Churchill, P. Sojikul, E. Wursthorn, S. Krasnoff and J. Clardy, Angew. Chem., Int. Ed., 2007, 46, 901 CrossRef CAS; R. A. Butcher, F. C. Schroeder, M. A. Fischbach, P. D. Straight, R. Kolter, C. T. Walsh and J. Clardy, Proc. Natl. Acad. Sci. U. S. A., 2007, 104, 1506 CrossRef CAS; A. E. Taggi, J. Meinwald and F. C. Schroeder, J. Am. Chem. Soc., 2004, 126, 10364 CrossRef CAS.
- F. P. Martin, S. Rezzi, E. PereÌ-Trepat, B. Kamlage, S. Collino, E. Leibold, J.r. Kastler, D. Rein, L. B. Fay and S. Kochhar, J. Proteome Res., 2009, 8, 5568 CrossRef CAS.
- G. M. Kirwan, V. G. Coffey, J. O. Niere, J. A. Hawley and M. J. Adams, Anal. Chim. Acta, 2009, 652, 173 CrossRef CAS.
- S. Rezzi, Z. Ramadan, F. P. Martin, L. B. Fay, P. van Bladeren, J. C. Lindon, J. K. Nicholson and S. Kochhar, J. Proteome Res., 2007, 6, 4469 CrossRef CAS.
- M. Ala-Korpela, Expert Rev. Mol. Diagn., 2007, 7, 761 CrossRef CAS.
- J. K. Nicholson, M. J. Buckingham and P. J. Sadler, Biochem. J., 1983, 211, 605 CAS.
- G. Grassa, I. F. Duarte, B. J. Goodfellow, A. S. Barros, I. M. Carreira, A. B. Couceiro, M. Spraul and A. M. Gil, Anal. Chem., 2007, 79, 8367 CrossRef CAS.
- T. Bezabeh, O. Ijare, N. Albiin, U. Arnelo, B. Lindberg and I. Smith, Magn. Reson. Mater. Phys., Biol. Med., 2009, 22, 267 CrossRef CAS.
- J. D. Bell, J. C. Brown, P. J. Sadler, A. F. Macleod, P. H. Sönksen, R. D. Hughes and R. Williams, Clin. Sci., 1987, 72, 563 Search PubMed.
- J. K. Ellis, P. H. Chan, T. Doktorova, T. J. Athersuch, R. Cavill, T. Vanhaecke, V. Rogiers, M. Vinken, J. K. Nicholson, T. M. D. Ebbels and H. C. Keun, J. Proteome Res., 2009, 9, 413; J. T. Bjerrum, O. H. Nielsen, F. Hao, H. Tang, J. K. Nicholson, Y. Wang and J.r. Olsen, J. Proteome. Res., 2009 Search PubMed.
- A. M. Weljie, J. Newton, P. Mercier, E. Carlson and C. M. Slupsky, Anal. Chem., 2006, 78, 4430 CrossRef CAS.
- J. D. Bell, P. J. Sadler, A. F. Macleod, P. R. Turner and A. La Ville, FEBS Lett., 1987, 219, 239 CrossRef CAS.
- V.-P. Mäkinen, P. Soininen, C. Forsblom, M. Parkkonen, P. Ingman, K. Kaski, P.-H. Groop and M. Ala-Korpela (on behalf of the FinnDiane Study), Magn. Reson. Mater. Phys., Biol. Med., 2006, 19, 281 CAS.
- M. Timmins, S. R. Thomas-Hall, A. Darling, E. Zhang, B. Hankamer, U. C. Marx and P. M. Schenk, J. Exp. Bot., 2009, 60, 1691 CrossRef CAS.
- L. M. Samuelsson, L. Förlin, G. Karlsson, M. Adolfsson-Erici and D. G. J. Larsson, Aquat. Toxicol., 2006, 78, 341 CrossRef CAS.
- M. R. Viant, E. S. Rosenblum and R. S. Tjeerdema, Environ. Sci. Technol., 2003, 37, 4982 CrossRef CAS.
- P. Agris and I. Campbell, Science, 1982, 216, 1325 CrossRef CAS; J. K. Nicholson, J. A. Timbrell, J. R. Bales and P. J. Sadler, Mol. Pharmacol., 1985, 27, 634 CAS.
- E. R. Andrew, A. Bradbury and R. G. Eades, Nature, 1959, 183, 1802 CAS.
- J. C. Lindon, O. P. Beckonert, E. Holmes and J. K. Nicholson, Prog. Nucl. Magn. Reson. Spectrosc., 2009, 55, 79 CrossRef CAS.
- H. K. Nyblom, L. I. Nord, R. Andersson, L. Kenne and P. Bergsten, NMR Biomed., 2008, 21, 357 CrossRef CAS; M.-B. Tessem, M. G. Swanson, K. R. Keshari, M. J. Albers, D. Joun, Z. L. Tabatabai, J. P. Simko, K. Shinohara, S. J. Nelson, D. B. Vigneron, I. S. Gribbestad and J. Kurhanewicz, Magn. Reson. Med., 2008, 60, 510 CrossRef CAS; D. Monleón, J. M. Morales, J. Gonzalez-Darder, F. Talamantes, O. Cortés, R. Gil-Benso, C. López-Ginés, M. Cerdá-Nicolás and B. Celda, J. Proteome Res., 2008, 7, 2882 CrossRef CAS.
- J.-M. Wieruszeski, G. Montagne, G. Chessari, P. Rousselot-Pailley and G. Lippens, J. Magn. Reson., 2001, 152, 95 CrossRef CAS.
- I. F. Duarte, E. G. Stanley, E. Holmes, J. C. Lindon, A. M. Gil, H. Tang, R. Ferdinand, C. G. McKee, J. K. Nicholson, H. Vilca-Melendez, N. Heaton and G. M. Murphy, Anal. Chem., 2005, 77, 5570 CrossRef CAS.
- W. Li, R. E. B. Lee, R. E. Lee and J. Li, Anal. Chem., 2005, 77, 5785 CrossRef CAS.
- E. Fredlund, A. Broberg, M. E. Boysen, L. Kenne and J. Schnürer, Appl. Microbiol. Biotechnol., 2004, 64, 403 CrossRef CAS.
- M. S. Chauton, O. I. Optun, T. F. Bathen, Z. Volent, I. S. Gribbestad and G. Johnsen, Mar. Ecol.: Prog. Ser., 2003, 256, 57 CrossRef CAS.
- G. B. Alcantara, N. K. Honda, M. M. C. Ferreira and A. G. Ferreira, Anal. Chim. Acta, 2007, 595, 3 CrossRef CAS.
- A. Broberg and L. Kenne, Anal. Biochem., 2000, 284, 367 CrossRef CAS.
- A. Bunescu, J. Garric, B. Vollat, E. Canet-Soulas, D. Graveron-Demilly and F. Fauvelle, Mol. BioSyst., 2010, 6, 121 RSC.
- A. M. Gil and J. Rodrigues, in Magnetic Resonance in Food Science, ed. P. S. Belton and G. A. Webb, RSC, Cambridge, 2007, ch. 2, pp. 96 Search PubMed.
- D. L. Rabenstein and S. Fan, Anal. Chem., 1986, 58, 3178 CrossRef CAS.
- S. Fan, W. Y. Choy, S. L. Lam, S. C. F. Au-Yeung, L. Tsang and C. S. Cockram, Anal. Chem., 1992, 64, 2570 CrossRef CAS.
- I. M. Figueiredo, N. R. Pereira, P. Efraim, N. H. P. Garcia, N. R. Rodrigues, A. Marsaioli and A. J. Marsaioli, J. Agric. Food Chem., 2006, 54, 4102 CrossRef CAS.
- R. Consonni, L. R. Cagliani, F. Benevelli, M. Spraul, E. Humpfer and M. Stocchero, Anal. Chim. Acta, 2008, 611, 31 CrossRef CAS.
- P. J. Hajduk, E. T. Olejniczak and S. W. Fesik, J. Am. Chem. Soc., 1997, 119, 12257 CrossRef CAS.
- L. H. Lucas, C. K. Larive, P. S. Wilkinson and S. Huhn, J. Pharm. Biomed. Anal., 2005, 39, 156 CrossRef CAS.
- J. P. Ribeiro, M. Palczewska, S. André, F. J. Cañada, H.-J. Gabius, J. Jiménez-Barbero, B. Mellström, J. R. Naranjo, D.-J. Scheffers and P. Groves, Anal. Biochem., 2010, 396, 117 CrossRef.
- C. S. Johnson Jr, Prog. Nucl. Magn. Reson. Spectrosc., 1999, 34, 203 CrossRef; W. S. Price, Concepts Magn. Reson., 1997, 9, 299 Search PubMed.
- E. O. Stejskal and J. E. Tanner, J. Chem. Phys., 1965, 42, 288 CrossRef CAS.
- B. Antalek, Concepts Magn. Reson., 2002, 14, 225 Search PubMed.
- J. C. Cobas, P. Groves, M. Martin-Pastor and A. D. Capua, Curr. Anal. Chem., 2005, 1, 289 CrossRef CAS.
- D. H. Wu, A. D. Chen and C. S. Johnson, J. Magn. Reson., Ser. A, 1995, 115, 260 CrossRef CAS.
- M. Yemloul, V. Castola, S. Leclerc and D. Canet, Magn. Reson. Chem., 2009, 47, 635 CrossRef CAS.
- G. S. Kapur, M. Findeisen and S. Berger, Fuel, 2000, 79, 1347 CrossRef CAS.
- K. F. Morris and C. S. Johnson, J. Am. Chem. Soc., 1992, 114, 3139 CrossRef CAS.
- R. Huo, R. Wehrens, J.v. Duynhoven and L. M. C. Buydens, Anal. Chim. Acta, 2003, 490, 231 CrossRef CAS.
- K. R. Metz, M. M. Lam and A. G. Webb, Concepts Magn. Reson., 2000, 12, 21 Search PubMed.
- H. Kählig, K. Dietrich and S. Dorner, Monatsh. Chem., 2002, 133, 589 CrossRef CAS.
- E. K. Gozansky and D. G. Gorenstein, J. Magn. Reson., Ser. B, 1996, 111, 94 CrossRef CAS.
- D. Wu, A. Chen and J. C. S. Johnson, J. Magn. Reson., Ser. A, 1996, 121, 88 CrossRef CAS.
- N. Birlirakis and E. Guittet, J. Am. Chem. Soc., 1996, 118, 13083 CrossRef CAS; S. Viel and S. Caldarelli, Chem. Commun., 2008, 2013 RSC.
- H. Barjat, G. A. Morris and A. G. Swanson, J. Magn. Reson., 1998, 131, 131 CrossRef CAS.
- L. H. Lucas, W. H. Otto and C. K. Larive, J. Magn. Reson., 2002, 156, 138 CrossRef CAS.
- M. Nilsson, A. M. Gil, I. Delgadillo and G. A. Morris, Chem. Commun., 2005, 1737 RSC.
- B. Vitorge and D. Jeanneat, Anal. Chem., 2006, 78, 5601 CrossRef CAS.
- J. M. Newman and A. Jerschow, Anal. Chem., 2007, 79, 2957 CrossRef CAS.
- M. Nilsson, A. Botana and G. A. Morris, Anal. Chem., 2009, 81, 8119 CrossRef CAS.
- K. Bleicher, M. Lin, M. J. Shapiro and J. R. Wareing, J. Org. Chem., 1998, 63, 8486 CrossRef CAS.
- R. E. Hoffman, H. Arzuan, C. Pemberton, A. Aserin and N. Garti, J. Magn. Reson., 2008, 194, 295 CrossRef CAS.
- S. Caldarelli, Magn. Reson. Chem., 2007, 45, S48 CrossRef CAS.
- M. E. Zielinski and K. F. Morris, Magn. Reson. Chem., 2009, 47, 53 CrossRef CAS.
- C. F. Tormena, R. Evans, S. Haiber, M. Nilsson and G. A. Morris, Magn. Reson. Chem., 2010, 48, 550 CrossRef CAS; R. Evans, S. Haiber, M. Nilsson and G. A. Morris, Anal. Chem., 2009, 81, 4548 CrossRef CAS.
- P. Hodge, P. Monvisade, G. A. Morris and I. Preece, Chem. Commun., 2001, 239 RSC.
- J. Xu, T. Tan, L. Kenne and C. Sandstrom, New J. Chem., 2009, 33, 1057 RSC.
- M. D. Díaz and S. Berger, Carbohydr. Res., 2000, 329, 1 CrossRef CAS.
- Y. Cohen, L. Avram and L. Frish, Angew. Chem., Int. Ed., 2005, 44, 520 CrossRef CAS.
- M. Politi, W. Peschel, N. Wilson, M. Zloh, J. M. Prieto and M. Heinrich, Phytochemistry, 2008, 69, 562 CrossRef CAS.
- M. Politi, M. Zloh, M. E. Pintado, P. M. L. Castro, M. Heinrich and J. M. Prieto, Phytochem. Anal., 2009, 20, 328 CrossRef CAS.
- S. Balayssac, S. Trefi, V. Gilard, M. Malet-Martino, R. Martino and M.-A. Delsuc, J. Pharm. Biomed. Anal., 2009, 50, 602 CrossRef CAS.
- J. Kang, S. Lee, S. Kang, H. Kwon, J. Park, S. Kwon and S. Park, Arch. Pharmacal Res., 2008, 31, 330 Search PubMed.
- S. Balayssac, M.-A. Delsuc, V. Gilard, Y. Prigent and M. Malet-Martino, J. Magn. Reson., 2009, 196, 78 CrossRef CAS.
- R. T. Williamson, E. L. Chapin, A. W. Carr, J. R. Gilbert, P. R. Graupner, P. Lewer, P. McKamey, J. R. Carney and W. H. Gerwick, Org. Lett., 2000, 2, 289 CrossRef CAS.
- S. Bradamante, L. Barenghi, G. Beretta, M. Bonfa', M. Rollini and M. Manzoni, Biotechnol. Bioeng., 2002, 80, 589 CrossRef CAS.
- M. Tsuda, T. Yasuda, E. Fukushi, J. Kawabata, M. Sekiguchi, J. Fromont and J.-i. Kobayashi, Org. Lett., 2006, 8, 4235 CrossRef CAS.
- E. D. Rodrigues, D. B.d. Silva, D. C. R.d. Oliveira and G. V. J.d. Silva, Magn. Reson. Chem., 2009, 47, 1095 CrossRef CAS.
- F. A. Macías, J. O. Guerra, A. M. Simonet, A. J. Pérez and C. Nogueiras, Magn. Reson. Chem., 2010, 48, 350 CAS.
- A. M. Socha, G. Kagan, W. Li, R. Hopson, J. K. Sello and P. G. Williard, Energy Fuels, 2010, 24, 4518 CrossRef CAS.
- S. Viel, D. Capitani, L. Mannina and A. Segre, Biomacromolecules, 2003, 4, 1843 CrossRef CAS.
- P. Groves, M. O. Rasmussen, M. D. Molero, E. Samain, F. J. Canada, H. Driguez and J. Jimenez-Barbero, Glycobiology, 2004, 14, 451 CrossRef CAS.
- U. Tomati, M. Belardinelli, E. Galli, V. Iori, D. Capitani, L. Mannina, S. Viel and A. Segre, Carbohydr. Res., 2004, 339, 1129 CrossRef CAS.
- E. R. Suárez, R. Syvitski, J. A. Kralovec, M. D. Noseda, C. J. Barrow, H. S. Ewart, M. D. Lumsden and T. B. Grindley, Biomacromolecules, 2006, 7, 2368 CrossRef CAS.
- M. Politi, P. Groves, M. I. Chávez, F. J. Cañada and J. Jiménez-Barbero, Carbohydr. Res., 2006, 341, 84 CrossRef CAS.
- J. Sitkowski, E.b. Bednarek, W. Bocian and L. Kozerski, J. Med. Chem., 2008, 51, 7663 CrossRef CAS.
- S. Trefi, V. Gilard, M. Malet-Martino and R. Martino, J. Pharm. Biomed. Anal., 2007, 44, 743 CrossRef CAS.
- S. Trefi, V. Gilard, S. Balayssac, M. Malet-Martino and R. Martino, Magn. Reson. Chem., 2009, 47, S163 CAS.
- S. Trefi, C. Routaboul, S. Hamieh, V. Gilard, M. Malet-Martino and R. Martino, J. Pharm. Biomed. Anal., 2008, 47, 103 CrossRef CAS.
- S. Trefi, V. Gilard, S. Balayssac, M. Malet-Martino and R. Martino, J. Pharm. Biomed. Anal., 2008, 46, 707 CrossRef CAS.
- L. Nyadong, G. A. Harris, S.p. Balayssac, A. S. Galhena, M. Malet-Martino, R. Martino, R. M. Parry, M. D. Wang, F. M. Fernćndez and V.r. Gilard, Anal. Chem., 2009, 81, 4803 CrossRef CAS.
- A. P. Sobolev, A. Segre and R. Lamanna, Magn. Reson. Chem., 2003, 41, 237 CrossRef CAS.
- T. Gostan, C. Moreau, A. Juteau, E. Guichard and M.-A. Delsuc, Magn. Reson. Chem., 2004, 42, 496 CrossRef CAS.
- A. M. Gil, I. Duarte, E. Cabrita, B. J. Goodfellow, M. Spraul and R. Kerssebaum, Anal. Chim. Acta, 2004, 506, 215 CrossRef CAS.
- M. Nilsson, I. F. Duarte, C. Almeida, I. Delgadillo, B. J. Goodfellow, A. M. Gil and G. A. Morris, J. Agric. Food Chem., 2004, 52, 3736 CrossRef CAS.
- I. F. Duarte, B. J. Goodfellow, A. M. Gil and I. Delgadillo, Spectrosc. Lett., 2005, 38, 319 CrossRef CAS.
- K. F. Morris, B. J. Cutak, A. M. Dixon and C. K. Larive, Anal. Chem., 1999, 71, 5315 CrossRef CAS.
- A. J. Simpson, W. L. Kingery, M. Spraul, E. Humpfer, P. Dvortsak and R. Kerssebaum, Environ. Sci. Technol., 2001, 35, 4421 CrossRef CAS.
- L. B. Dobbss, L. Pasqualoto Canellas, F.b. Lopes Olivares, N.l. Oliveira Aguiar, L.z. E. q. P. Peres, M. Azevedo, R. Spaccini, A. Piccolo and A. R. Façanha, J. Agric. Food Chem., 2010, 58, 3681 CrossRef CAS; D. Šmejkalová and A. Piccolo, Environ. Sci. Technol., 2007, 42, 699; A. J. Simpson, Magn. Reson. Chem., 2002, 40, S72 CrossRef CAS.
- L. P. Canellas, A. Piccolo, L. B. Dobbss, R. Spaccini, F. L. Olivares, D. B. Zandonadi and A. R. Façanha, Chemosphere, 2010, 78, 457 CrossRef CAS.
- H. Barjat, G. A. Morris, S. Smart, A. G. Swanson and S. C. R. Williams, J. Magn. Reson., Ser. B, 1995, 108, 170 CrossRef CAS.
- L. M. Smith, A. D. Maher, O. Cloarec, M. Rantalainen, H. Tang, P. Elliott, J. Stamler, J. C. Lindon, E. Holmes and J. K. Nicholson, Anal. Chem., 2007, 79, 5682 CrossRef CAS.
- A. Ambrus and D. Yang, Anal. Biochem., 2007, 367, 56 CrossRef CAS.
- D. L. Rabenstein, A. A. Isab and D. W. Brown, J. Magn. Reson., 1980, 41, 361 CAS.
- T. Kanthimathi, Y. V. S. N. Moorthy, C. N. Pillai and S. Subramanian, Magn. Reson. Chem., 1994, 32, 452 CrossRef CAS.
- M. J. Lynch, J. Masters, J. P. Pryor, J. C. Lindon, M. Spraul, P. J. D. Foxall and J. K. Nicholson, J. Pharm. Biomed. Anal., 1994, 12, 5 CrossRef CAS.
- S. Simova and V. Dimitrov, J. Magn. Reson., Ser. A, 1995, 117, 292 CrossRef CAS; C. Tyl, S. Felsinger and L. Brecker, J. Mol. Catal. B: Enzym., 2004, 28, 55 CrossRef CAS.
- N. Suryaprakash, M. Azoury, Z. Goren and R. Jelinek, J. Forensic Sci., 2000, 45, 963 CAS.
- P. Sandusky and D. Raftery, Anal. Chem., 2005, 77, 2455 CrossRef CAS.
- P. Sandusky and D. Raftery, Anal. Chem., 2005, 77, 7717 CrossRef CAS.
- F. Fernaćndez-Trillo, E. Fernandez-Megia and R. Riguera, J. Org. Chem., 2010, 75, 3878 CrossRef.
- K. Johnson, L. G. Barrientos, L. Le and P. P. N. Murthy, Anal. Biochem., 1995, 231, 421 CrossRef CAS.
- A. K. Galande, J. O. Trent and A. F. Spatola, Pept. Sci., 2003, 71, 534 Search PubMed.
- D. A. Snyder, F. Zhang, S. L. Robinette, L. Bruschweiler-Li and R. Bruschweiler, J. Chem. Phys., 2008, 128, 052313 CrossRef; F. Zhang, A. T. Dossey, C. Zachariah, A. S. Edison and R. Brüschweiler, Anal. Chem., 2007, 79, 7748 CrossRef CAS.
- W. P. Aue, J. Karhan and R. R. Ernst, J. Chem. Phys., 1976, 64, 4226 CrossRef CAS.
- J. M. Fonville, A. D. Maher, M. Coen, E. Holmes, J. C. Lindon and J. K. Nicholson, Anal. Chem., 2010, 82, 1811 CrossRef CAS.
- C. Ludwig and M. R. Viant, Phytochem. Anal., 2010, 21, 22 CrossRef CAS.
- S. R. Williams, R. A. Iles and R. A. Chalmers, Clin. Chim. Acta, 1986, 159, 153 CrossRef CAS; P. J. D. Foxall, J. A. Parkinson, I. H. Sadler, J. C. Lindon and J. K. Nicholson, J. Pharm. Biomed. Anal., 1993, 11, 21 CrossRef CAS.
- P. J. D. Foxall, J. A. Parkinson, I. H. Sadler, J. C. Lindon and J. K. Nicholson, J. Pharm. Biomed. Anal., 1993, 11, 21 CrossRef CAS; N. W. Lutz, S. Maillet, F. Nicoli, P. Viout and P. J. Cozzone, FEBS Lett., 1998, 425, 345 CrossRef CAS.
- Y. Wang, M. E. Bollard, H. Keun, H. Antti, O. Beckonert, T. M. Ebbels, J. C. Lindon, E. Holmes, H. Tang and J. K. Nicholson, Anal. Biochem., 2003, 323, 26 CrossRef CAS; M. E. Bollard, S. Garrod, E. Holmes, J. C. Lindon, E. Humpfer, M. Spraul and J. K. Nicholson, Magn. Reson. Med., 2000, 44, 201 CrossRef CAS; D. Moka, R. Vorreuther, H. Schicha, M. Spraul, E. Humpfer, M. Lipinski, P. J. D. Foxall, J. K. Nicholson and J. C. Lindon, J. Pharm. Biomed. Anal., 1998, 17, 125 CrossRef CAS.
- M. J. Shapiro, J. Chin, R. E. Marti and M. A. Jarosinski, Tetrahedron Lett., 1997, 38, 1333 CrossRef CAS.
- C. H. Johnson, T. J. Athersuch, I. D. Wilson, L. Iddon, X. Meng, A. V. Stachulski, J. C. Lindon and J. K. Nicholson, Anal. Chem., 2008, 80, 4886 CrossRef CAS.
- S. Y. Yang, H. K. Kim, A. W. M. Lefeber, C. Erkelens, N. Angelova, Y. H. Choi and R. Verpoorte, Planta Med., 2006, 72, 364 CrossRef CAS; Y. H. Choi, H. K. Kim, H. J. M. Linthorst, J. G. Hollander, A. W. M. Lefeber, C. Erkelens, J.-M. Nuzillard and R. Verpoorte, J. Nat. Prod., 2006, 69, 742 CrossRef CAS; H. K. Kim, S. SaifullahKhan, E. G. Wilson, S. D. P. Kricun, A. Meissner, S. Goraler, A. M. Deelder, Y. H. Choi and R. Verpoorte, Phytochemistry, 2010, 71, 773 CrossRef CAS; H. K. Kim, Y. H. Choi and R. Verpoorte, Nat. Protoc., 2010, 5, 536 Search PubMed.
- M. R. Viant, Biochem. Biophys. Res. Commun., 2003, 310, 943 CrossRef CAS; A. Hines, W. H. Yeung, J. Craft, M. Brown, J. Kennedy, J. Bignell, G. D. Stentiford and M. R. Viant, Anal. Biochem., 2007, 369, 175 CrossRef CAS; C. Lin, H. Wu, R. Tjeerdema and M. Viant, Metabolomics, 2007, 3, 55 CrossRef CAS.
- C. Phalaraksh, E. M. Lenz, J. C. Lindon, J. K. Nicholson, R. D. Farrant, S. E. Reynolds, I. D. Wilson, D. Osborn and J. M. Weeks, Insect Biochem. Mol. Biol., 1999, 29, 795 CrossRef CAS.
- J. C. Lindon and A. G. Ferrige, J. Magn. Reson., 1981, 44, 566 CAS.
- A. D. Maher, D. Crockford, H. Toft, D. Malmodin, J. H. Faber, M. I. McCarthy, A. Barrett, M. Allen, M. Walker, E. Holmes, J. C. Lindon and J. K. Nicholson, Anal. Chem., 2008, 80, 7354 CrossRef CAS.
- I. Bertini, C. Luchinat and S. Aime, Coord. Chem. Rev., 1996, 150, 77 CrossRef; L. Helm, Prog. Nucl. Magn. Reson. Spectrosc., 2006, 49, 45 CrossRef.
- E. Fernandez-Megia, J. Correa, R. Novoa-Carballal and R. Riguera, J. Am. Chem. Soc., 2007, 129, 15164 CrossRef CAS.
- G. N. La Mar and J. S. de Ropp, in Biological Magnetic Resonance, ed. L. J. Berliner and J. Reuben, Plenum Press, New York, 1993, vol. 12, pp. 1–78 Search PubMed.
- J. Rodriguez and R. Riguera, J. Chem. Res., 1989, 342, 2620 Search PubMed; M. J. Vázquez, E. Quiñoá, R. Riguera, A. San Martín and J. Dárias, Tetrahedron, 1992, 48, 6739 CrossRef.
- J. Correa, E. Fernandez-Megia and R. Riguera, unpublished results.
Footnotes |
| † It must also be considered that due to the nature of the T1 filtering experiment (inversion recovery experiment) some of the signals in the experiment may appear inverted in the spectra. |
| ‡ Attention should be paid to the experimental conditions (temperature, sample viscosity, etc.) when relaxation times taken from the literature are used for quantitative analysis. |
| § The length of the spin-echo delay in the CPMG pulse sequence should be very short (conventionally less than 1 ms) to avoid phase distortions. Therefore, in order to obtain the required T2 relaxation filter, the number of loops of the cycle should be increased. |
| ¶ Related to cacao, cupuassu is popular in Brazil, but little known elsewhere. In the production of ‘cupulate’ from cupuassu, the seeds are first separated and then fermented. |
| This journal is © The Royal Society of Chemistry 2011 |