DOI:
10.1039/C1MD00159K
(Concise Article)
Med. Chem. Commun., 2011,
2, 1208-1216
Received
21st June 2011
, Accepted 17th September 2011
First published on 13th October 2011
Introduction
Nucleic acids are important cellular targets for many anticancer and antiviral drugs and the identification of new agents that can interact with DNA molecules in cellular environments is considered important for the design and development of new chemotherapeutic agents.1 In this context, transition metal complexes which can cleave DNA under physiological conditions are of current interest. Moreover, DNA is considered to be an unselective target at the cellular level, and thus, identification of compounds that can interact with DNA and can be activated for its nuclease activity by a specific stimulus e.g. light would be a relevant approach to ensure drug action at a specific site in the body. Additionally, photoactivation-promoted enhanced activity of pro-drug/modestly active compounds is an emerging concept in the area of cancer therapy,2 and some COMPOUND LINKS
Read more about this on ChemSpider
Download mol file of compoundplatinum complexes have also been reported with such properties.3–5 Thus, COMPOUND LINKS
Read more about this on ChemSpider
Download mol file of compoundplatinum complexes which can bind with and cleave DNA under physiological conditions are attractive therapeutic targets. Recently, it has been reported that inclusion of amine ligands such as COMPOUND LINKS
Read more about this on ChemSpider
Download mol file of compoundmethylamine and COMPOUND LINKS
Read more about this on ChemSpider
Download mol file of compoundisopropylamine can significantly improve the cytotoxicity of PtII anticancer complexes.6 Therefore, our aim was to incorporate amine ligands such as COMPOUND LINKS
Read more about this on ChemSpider
Download mol file of compoundethylene diamine as terminal ligands conjugated in a PtII species to a biologically active Schiff's base.7 The present article describes studies aimed at evaluating the cytotoxicity of a recently synthesized and characterized complex of PtII8 with a focus on its interaction with and photocleavage of DNA. Recently an elegant application of a neutral cyclometallated PtII complex based around the COMPOUND LINKS
Read more about this on ChemSpider
Download mol file of compound1,3-bispyridylbenzene skeleton was applied in fluorescence cell imaging, taking advantage of both two-photon and time-resolved techniques to provide high resolution images.9 These species were found to be of low cytotoxicity but showed good uptake, with an interesting pattern of localization, mainly within the nucleus, and concentrated in nucleoli. In contrast to these species, complex Ptcyp is isolated as a tetracation (although the phenolic hydroxyls may ionize under physiological conditions), so it should assist in cellular uptake due to the membrane potential. Once inside the cell, the high charge and lipophilicity may be expected to lead to accumulation of the complex in organelles such as mitochondria. As is discussed below, in a ground breaking application of such Pt–amine complexes in cell imaging, Ptcyp showed very little accumulation in the cytoplasm, with only weak Pt-based luminescence being observed, and no discernible pattern of localization indicating uptake by any cytoplasmic organelles. However, there was an obvious concentration of luminescence in the nuclear region in the centre of the cells.
Result and discussion
In this study the interaction between the COMPOUND LINKS
Read more about this on ChemSpider
Download mol file of compoundPt(II) complex, [Pt(en)LH2]2·4PF6 (S1†) (Ptcyp; LH2 = COMPOUND LINKS
Read more about this on ChemSpider
Download mol file of compoundN,N′-bis(salicylidene)-p-phenylenediamine; Fig. 1) and DNA has been investigated by means of absorption, emission, circular dichroism spectroscopy, gel electrophoresis and cell imaging studies.
 |
| | Fig. 1 Structural formula of Ptcyp. | |
In order to check the stability of the complex in aq. medium, its 1H NMR and UV-vis spectra were recorded in the presence of D2O and COMPOUND LINKS
Read more about this on ChemSpider
Download mol file of compoundwater respectively. 1H-NMR data show the existence of the intact complex in aq. medium. However, the absorption band undergoes a blue shift of about 10 nm negative solvatochromic shifts (S2†) (from COMPOUND LINKS
Read more about this on ChemSpider
Download mol file of compoundDMSO to COMPOUND LINKS
Read more about this on ChemSpider
Download mol file of compoundwater) indicating that the ground state is more polar than the excited state as has been previously reported for related Pt–Schiff base derivatives.10–15 To evaluate the effect of anions on Ptcyp in solution, titrations of the complex with anions like COMPOUND LINKS
Read more about this on ChemSpider
Download mol file of compoundtetrabutyl ammonium chloride (TBAC) and COMPOUND LINKS
Read more about this on ChemSpider
Download mol file of compoundtetrabutyl ammonium phosphate (TBAP) in COMPOUND LINKS
Read more about this on ChemSpider
Download mol file of compoundDMSO were carried out. No significant changes were observed between the absorption spectra of the COMPOUND LINKS
Read more about this on ChemSpider
Download mol file of compoundplatinum(II) complex Ptcyp in the absence and presence of anions (S3 and S4†). This indicated that anions do not compromise the stability of the COMPOUND LINKS
Read more about this on ChemSpider
Download mol file of compoundplatinum(II) complex in solution.
In vitro cytotoxicity evaluation
The HeLa cell line is one of those which are most extensively used to evaluate the cytotoxicity of the novel complexes. Dalton's lymphoma (DL) is another tumor cell line which has been successfully used to evaluate the anticancer potential of newly synthesized complexes.16–18 In order to have a comparative measure of Ptcyp cytotoxicity on different cell lines, the cytotoxicity assay was performed against both these cell lines. The MTT test, which measures mitochondrial dehydrogenase activity as a measure of cell viability,19,20 was carried out to calculate IC50 values of the complex against these cells.
The HeLa cells were incubated with an increasing concentration of Ptcyp and, for comparison, with COMPOUND LINKS
Read more about this on ChemSpider
Download mol file of compoundcisplatin in a separate experiment for 24 h. The result, shown in Fig. 2, shows a concentration-dependent decline in the number of viable HeLa cells with the IC50 values of 11.5 and 22.2 μM for Ptcyp and COMPOUND LINKS
Read more about this on ChemSpider
Download mol file of compoundcisplatin respectively.
 |
| | Fig. 2 Cytotoxicity of Ptcyp (▽) and COMPOUND LINKS
Read more about this on ChemSpider
Download mol file of compoundcisplatin (▲) against the HeLa cells. After 24 h incubation with different concentration of the compounds, the cell viability was assayed using the MTT dye reduction method. The data at each point in the logarithmic dose–response plot represent mean ± SD (n =3; 5 well data repeated 3 times) as percent of surviving cells taking the value of the untreated control set as 100%. | |
The value with COMPOUND LINKS
Read more about this on ChemSpider
Download mol file of compoundcisplatin corroborated the range of IC50 values reported against many human cell lines.21–23 Thus, as compared to COMPOUND LINKS
Read more about this on ChemSpider
Download mol file of compoundcisplatin, the IC50 value of Ptcyp against HeLa cells suggests a stronger cytotoxic action of the complex than that of COMPOUND LINKS
Read more about this on ChemSpider
Download mol file of compoundcisplatin. Additionally, the IC50 value of Ptcyp against DL cells was calculated to be 0.65 ± 0.11 μM, which, in comparison to the IC50 of COMPOUND LINKS
Read more about this on ChemSpider
Download mol file of compoundcisplatin (6.96 ± 0.85 μM) for DL cells, obtained in our laboratory as well as with still higher values reported from other groups24 suggests stronger cytotoxicity of Ptcyp against DL cells also. Other COMPOUND LINKS
Read more about this on ChemSpider
Download mol file of compoundplatinum complexes bearing similar ligands have shown much lower IC50 than those of the COMPOUND LINKS
Read more about this on ChemSpider
Download mol file of compoundcisplatin.22,25 For example, incorporation of a π acceptor COMPOUND LINKS
Read more about this on ChemSpider
Download mol file of compoundpyridine ligand in place of an ammine to a PtIV complex caused ∼13 to 80 fold decline in IC50 and ∼15 times more cytotoxicity than COMPOUND LINKS
Read more about this on ChemSpider
Download mol file of compoundcisplatin towards a COMPOUND LINKS
Read more about this on ChemSpider
Download mol file of compoundcisplatin resistant human ovarian cell line.25 Also, as compared to a COMPOUND LINKS
Read more about this on ChemSpider
Download mol file of compound3-picoline ligated PtII complex, COMPOUND LINKS
Read more about this on ChemSpider
Download mol file of compound2-picoline containing complex showed 2-fold greater cytotoxicity than the COMPOUND LINKS
Read more about this on ChemSpider
Download mol file of compoundcisplatin towards the HeLa cells.22 Thus, in the present context, it may be argued that as compared to the COMPOUND LINKS
Read more about this on ChemSpider
Download mol file of compoundcisplatin, ligation of COMPOUND LINKS
Read more about this on ChemSpider
Download mol file of compound1,2-diamino ethane as terminal ligand to a PtII complex (Ptcyp) could significantly enhance cytotoxicity towards HeLa cells, a widely used drug discovery model for human cancers and towards the DL cells of mouse origin.
UV-vis absorption studies for the binding of complex Ptcyp to CT-DNA
The mechanism of action of many COMPOUND LINKS
Read more about this on ChemSpider
Download mol file of compoundplatinum-based chemotherapeutic agents relies upon DNA damage.26,27 Therefore, the DNA-binding properties of Ptcyp have been evaluated in order to shed light upon its cytotoxicity against a cancerous cell line. The UV-vis absorption spectrum of Ptcyp recorded in COMPOUND LINKS
Read more about this on ChemSpider
Download mol file of compoundDMSO showed peaks at λmax 265, 340, 384 and 439sh nm assigned to intra-ligand and MLCT transitions respectively.
However, in phosphate buffer solution these peaks shifted significantly and the corresponding peaks appear at λmax 253, 328 and 390sh nm. The addition of CT-DNA to a solution of Ptcyp induced remarkable shifts in λmax as well as in absorption intensity. The absorption band at 254 nm showed a hyperchromic shift by 30% and a bathochromic shift of ∼3 nm. In contrast, the absorption band at 328 nm showed hypochromism of 31% with no significant change in the peak position. Such spectral changes suggest that Ptcyp binds DNA. Hypochromism in DNA-based bands may result from the contraction of DNA in the helical axis and also from the conformational change in DNA. In contrast, hyperchromism may result from the damage to the DNA double-helix structure.28 It was observed that addition of CT-DNA to a solution of Ptcyp induces remarkable hyperchromic as well as hypochromic shifts. These changes are likely to result from Ptcyp intercalating with CT-DNA: the bathochromic shift could be derived from lowering of the energy of the ligand π* orbital upon intercalation by interaction with π orbitals of the base pairs, and thus reducing the energy of the π–π* transition.29 According to the literature, substantial hypochromism, extensive broadening, and red shift of the absorption band are characteristic of an intercalative interaction.30 In order to calculate the binding strength of Ptcyp with CT DNA, the intrinsic binding constant Kb is calculated by monitoring the changes in absorbance of Ptcyp in the presence of increasing concentration of DNA (Fig. 3). Kb is obtained from the ratio of slope to the intercept from the plots of [DNA]/(εa − εf) vs. [DNA]. The Kb value is 4.5 × 10⁵ M−1 for Ptcyp. COMPOUND LINKS
Read more about this on ChemSpider
Download mol file of compoundCisplatin shows a hyperchromic shift after subsequent addition of CT DNA. The intrinsic binding constant, Kb for COMPOUND LINKS
Read more about this on ChemSpider
Download mol file of compoundcisplatin is found to be 3.20 × 10⁴ M−1.31
Photophysical studies
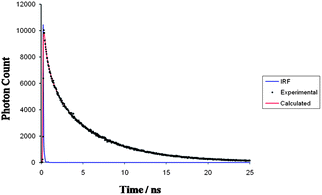
Ptcyp was found to exhibit intense photoluminescence with emission at ∼500 nm (a useful low energy wavelength for cell imaging applications) following excitation at a variety of wavelengths, and in view of the interest in applying such species in cell imaging a fuller study of its photophysical properties was undertaken. Examination of the excitation and emission spectra of Ptcyp (S8 and S9†) showed a number of broad bands in the excitation spectrum with maxima around 300, 350 and 380 nm. Significantly, while the overall profile matched the electronic absorption spectra described above, the relative intensities are very different with the 380 nm band being the strongest in the excitation spectrum, indicating that this is directly exciting MLCT emission, whereas higher energy bands observed to have stronger absorption in the UV-vis spectrum are less efficient at populating MLCT states indicating inefficient energy transfer between states. Importantly, while the maximum of the lowest energy band was 380 nm, as is typical of 1MLCT excitation bands this peak is so broad that very efficient excitation is possible at wavelengths >400 nm, which is significant for tissue penetration and tissue damage considerations in cell imaging experiments. The emission spectrum shows a weak band centred at 475 and a much stronger one at 550 nm, assigned to ligand-centred and 3MLCT bands respectively. The 550 nm band becomes more dominant at longer wavelength excitation, supporting the 3MLCT assignment. The broad bands and solvatochromism in the UV-vis spectrum indicate that these are charge transfer bands, and the large Stokes shift (120 nm) indicates a triplet origin for the emission. It is likely that there is significant mixing of the ligand centred and 3MLCT states and although the lower energy band is the most intense regardless of excitation wavelength, interestingly, the relative intensity is excitation dependent indicating true dual emission. The luminescence lifetime (τ) of the emission of Ptcyp was measured following excitation at (λex) 340 nm and fitted a mono-exponential decay indicating a lifetime of 4.73 ns (Fig. 4). While this is short for 3MLCT the presence of a large number of non-coordinated heteroatoms in the ligand structure is likely to lead to self-quenching giving a short lifetime. Although this lifetime in itself could be thought characteristic of a singlet process, the large Stokes shift makes the alternative explanation of a quenched triplet state more appealing.
A reproducible 15% decrease in the steady-state emission intensity is observed on progressing from an N2-saturated to an O2-saturated solution (S5†), again indicating likely contributions from triplet states. In any event, the large Stokes shift renders this complex appealing for cell imaging applications, regardless of the electronic nature of the excited state.
A binding assay of Ptcyp with CT-DNA was performed by monitoring the changes in the emission spectral pattern of Ptcyp (0.5 μM, excited at 328 nm) in the presence of increasing concentration of CT-DNA (0–5 μM) in an aqueous buffer (COMPOUND LINKS
Read more about this on ChemSpider
Download mol file of compoundNa–phosphate buffer; pH 7.4). Even though no appreciable change in the position of the charge transfer band of the complex was observed upon addition of DNA, the fluorescence intensity of the complex increases progressively with increasing concentration of DNA (Fig. 5), suggesting that Ptcyp-based emission is enhanced when it is bound to DNA. The concentration of the free complex CF was determined by eqn (1):32| | | CF = CT [(I/Io) − P]/(1 − P) | (1) |
where CT is the total concentration of the free and bound forms of the COMPOUND LINKS
Read more about this on ChemSpider
Download mol file of compoundplatinum(II) complex, I and Io are the emission intensity in the presence and absence of DNA, respectively, and P is the ratio of the observed emission intensity of the bound complex relative to that of the free complex. The Io and P values are obtained by plotting I/Ioversus 1/[DNA]. The concentration of the bound complex CB is equal to CT − CF. A plot of r/CFversus r, where r = CB/[DNA], is constructed according to eqn (2):| | | r/CF = K(1 − nr){(1 − nr)/[1 − (n − 1)r]}n−1 | (2) |
![Fluorescence spectra of PtII-complex Ptcyp in the presence of increasing concentration of DNA. [DNA] = 0–5 μM, [Ptcyp] = 0.5 μM.](/image/article/2011/MD/c1md00159k/c1md00159k-f5.gif) |
| | Fig. 5 Fluorescence spectra of PtII-complex Ptcyp in the presence of increasing concentration of DNA. [DNA] = 0–5 μM, [Ptcyp] = 0.5 μM. | |
The binding constant K was 4.62 × 10⁵ mol−1 dm3, which is similar to that of 4.5 × 10⁵ mol−1 dm3 obtained by absorption titration.
It has been suggested that DNA bound complexes have less access to COMPOUND LINKS
Read more about this on ChemSpider
Download mol file of compoundwater and therefore, they are likely to show increased fluorescence in aqueous solutions.33,34 One of the primary modes of quenching of the excited states of luminescent transition metal charge transfer species is the collisional quenching with COMPOUND LINKS
Read more about this on ChemSpider
Download mol file of compoundwater molecules, or interactions with dissolved COMPOUND LINKS
Read more about this on ChemSpider
Download mol file of compounddioxygen. It is generally thought that the intercalation protects the planar ligand from such interactions with the environment and thus leads to the enhanced emission intensity. While traditionally the interaction with COMPOUND LINKS
Read more about this on ChemSpider
Download mol file of compoundwater has been thought to be the most significant, the triplet ground state of COMPOUND LINKS
Read more about this on ChemSpider
Download mol file of compounddioxygen makes it a particularly efficient quencher for triplet excited states of certain transition metal complexes. It is also likely that the increased rigidity of the system leads to the reduced vibronic energy losses, and all these factors may have some role in explaining the characteristic increase in intensity observed upon interaction with DNA.
The ability of a complex to affect the fluorescence intensity of COMPOUND LINKS
Read more about this on ChemSpider
Download mol file of compoundethidium bromide (EB) in the EB–DNA adduct is a reliable tool to measure affinity of the complex for DNA because unbound (displaced) EB is known to rapidly lose its emission intensity due to surrounding COMPOUND LINKS
Read more about this on ChemSpider
Download mol file of compoundwater.35 Thus a measure of the relative propensities of EB and Ptcyp was assessed by fluorescence-based competitive binding experiments. The emission spectra of the EB–DNA adduct in the presence and absence of Ptcyp is shown in Fig. 6. The emission spectrum of Ptcyp recorded in the presence of EB only (S10†), discards any probable interaction of Ptcyp with EB. Addition of increasing concentrations of Ptcyp to CT-DNA solution pretreated with EB showed a linear decline in the emission intensity from the EB–DNA adduct, indicating displacement of EB by Ptcyp. It is also evident that in a solution of 10 μM of CT-DNA pretreated with EB, 0.75 μM of the complex caused ∼90% EB displacement. These results are suggestive of efficient DNA binding by Ptcyp. This surmise is well supported from the quenching plot of Io/I vs. [Ptcyp]/[DNA] (the inset of Fig. 6). It was found in good agreement with the linear Stern–Volmer equation with Stern–Volmer quenching constant (Ksv) = 1.08 M−1.
In order to check, whether Ptcyp displaces COMPOUND LINKS
Read more about this on ChemSpider
Download mol file of compoundethidium bromide (EB) in the EB–DNA adduct, a UV-vis titration experiment is performed. Free COMPOUND LINKS
Read more about this on ChemSpider
Download mol file of compoundethidium bromide shows absorbance at 490 nm. After addition of CT-DNA the intensity of the absorbance decreases. Addition of increasing concentrations of Ptcyp to the EB-DNA adduct showed a linear increase in the absorption intensity, indicating increasing concentration of free EB. It reaches saturation after addition of ∼0.75 μM of the complex (S6†).
Circular dichroism
Circular dichroism spectroscopy is useful in diagnosing changes in DNA morphology during drug–DNA interactions. The band due to base stacking (∼275 nm) and that due to right-handed helicity (∼245 nm) are quite sensitive to the mode of DNA interactions with small molecules.36 Therefore, changes in the CD spectrum of DNA upon interaction with extraneous species are often assigned as being related to corresponding changes in the DNA structure.37 Simple groove binding and electrostatic interactions of small molecules induce little or no perturbation in the base-stacking and helicity bands. In the case of the classical DNA intercalator methylene blue,38 the intercalation enhances the intensities of both the bands related to right-handed B conformation of CT DNA. The CD spectral variations of CT-DNA (100.0 μM, in 0.1 mM COMPOUND LINKS
Read more about this on ChemSpider
Download mol file of compoundNa–phosphate buffer (pH = 7.4)) were recorded in the presence of increasing amounts of Ptcyp up to [1]/[DNA] molar ratios of approximately 0.8 (Fig. 7). The observed CD spectrum showed a positive band at 278 nm due to base stacking and a negative band at 242 nm due to helicity which is characteristic of B-DNA (Fig. 7). It is interesting to observe that the CD spectrum of native DNA (solid line in Fig. 7) is drastically modified by the addition of increasing amounts of Ptcyp. The spectral patterns showed an increase in the intensity of both the positive and the negative bands. Similar changes in CD spectra have previously been shown to correlate with intercalation with the DNA.39 The results observed in Fig. 6 therefore suggest that Ptcyp binds with DNA by intercalation. Moreover, the negative DNA band was blue shifted by 15 nm, which may be correlated with the resultant change in the conformation of CT-DNA due to the binding of Pycyp. This observation is further supported from the gel electrophoresis result showing conversion of a circular supercoiled plasmid DNA into a nicked open conformation (Fig. 8 and 9).
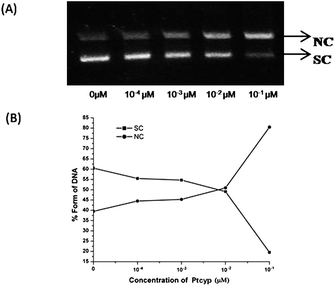
DNA cleavage study
Monitoring changes in the supercoiled structure of pBR322 DNA is a reliable tool to ascertain the DNA cleavage potential of a compound. The native circular plasmid DNA assumes a supercoiled structure (SC) which shows faster migration on agarose gel electrophoresis than its relaxed (non-supercoiled) form. In general, the relaxed form of plasmid DNA is generated due to the cleavage of one of the DNA strands, known as nicking of DNA, and the resultant opened circular DNA is known as the nicked circular (NC) form which migrates more slowly in the agarose gel. If both strands are cleaved, a linear L form is generated which migrates between SC and NC forms.40 In order to study whether Ptcyp enables DNA cleavage, different concentrations (50 and 500 μM) of Ptcyp were incubated with 0.5 μg pBR322 DNA for 24 and 48 h separately in 25 μL of the two separate reaction mixtures (a) aqueous: Tris–COMPOUND LINKS
Read more about this on ChemSpider
Download mol file of compoundCl buffer (pH 7.4) containing 50 mM COMPOUND LINKS
Read more about this on ChemSpider
Download mol file of compoundNaCl and (b) organic: 0.02 and 0.2% COMPOUND LINKS
Read more about this on ChemSpider
Download mol file of compoundDMSO. The samples were analyzed on 1% native agarose gel electrophoresis followed by COMPOUND LINKS
Read more about this on ChemSpider
Download mol file of compoundethidium bromide staining of the DNA bands. The gel electrophoretic pattern of pBR322 plasmid DNA in the presence of different concentrations of Ptcyp is shown in Fig. 8.
As compared to the untreated plasmid DNA sample, there was no change in the intensities of SC and NC forms of DNA when incubated with the complex in aqueous buffered solution up to 24 and 48 h. In contrast, when the DNA cleavage assay was performed in 0.02 and 0.2% COMPOUND LINKS
Read more about this on ChemSpider
Download mol file of compoundDMSO, as compared to the untreated plasmid DNA, at 50 μM of Ptcyp, the intensity of NC DNA increases with a concomitant decrease in SC DNA bands at 24 h of incubation (Fig. 8A). However, at 500 μM of Ptcyp, no DNA band could be seen in the COMPOUND LINKS
Read more about this on ChemSpider
Download mol file of compoundDMSO lane suggesting degradation of plasmid DNA in COMPOUND LINKS
Read more about this on ChemSpider
Download mol file of compoundDMSO solution (Fig. 8A). The DNA cleavage properties of the complex in COMPOUND LINKS
Read more about this on ChemSpider
Download mol file of compoundDMSO medium are further confirmed by appearance of an additional faster migrating DNA band when treated for up to 48 h with 50 μM of the complex followed by complete degradation of plasmid DNA at 500 μM (Fig. 8B). Thus, it is evident that though Ptcyp does not cleave DNA in aqueous media, its DNA cleavage ability is significantly increased in the presence of COMPOUND LINKS
Read more about this on ChemSpider
Download mol file of compoundDMSO in a concentration dependent manner. Elucidation of the mechanism of DNA cleavage by COMPOUND LINKS
Read more about this on ChemSpider
Download mol file of compoundplatinum complex Ptcyp in COMPOUND LINKS
Read more about this on ChemSpider
Download mol file of compoundDMSO requires further investigation. In the present context, it is speculated that cleavage of DNA by complex Ptcyp in the presence of COMPOUND LINKS
Read more about this on ChemSpider
Download mol file of compoundDMSO might involve reactive oxygen species (e.g. O2−˙). The logic is based on the observation that most of the oxidative reactions leading to DNA cleavage by transition metal complexes described so far involve COMPOUND LINKS
Read more about this on ChemSpider
Download mol file of compoundoxygen radicals.41,42
UV light-induced cleavage of plasmid DNA
Compounds capable of cleaving DNA on photo-activation are considered most suitable for therapeutic applications, as they can be photo-induced to give localized action and thereby unwanted DNA damage can be avoided.43,44 As DNA has been reported to be the preferred target of COMPOUND LINKS
Read more about this on ChemSpider
Download mol file of compoundplatinum complexes,45 the photonuclease activity of Ptcyp was studied after exposing an aqueous solution of DNA-Ptcyp to UV radiation at 312 nm (64 W) for 10 minutes. The complex caused a linear increase in the intensity of the NC DNA band accompanied by the similar decline in SC DNA in a concentration dependent manner in the aqueous buffer (Fig. 9A and B). This suggests that Ptcyp, upon UV irradiation, is able to produce nicks in the supercoiled plasmid DNA and hence shows a strong nuclease activity in aqueous medium. Thus, COMPOUND LINKS
Read more about this on ChemSpider
Download mol file of compoundDMSO and/or UV dependent nuclease activity of Ptcyp provided a biochemical mechanism to evaluate the anticancer potential of this complex against a number of cancer models. Enhancement in the activity of a modest anticancer compound upon photoactivation is an emerging strategy in cancer therapy.2 In general, UV rays can penetrate into the human body up to 1 mm depth. This is likely to restrict in vivo applications of the UV activated DNA cleavage property of Ptcyp, thus, limiting its future applications only against skin and oral cancers. Nonetheless, as both these types of tumors are common in population, the present findings would have immense applications, however, needs further studies on evaluating this complex against such cancer models. Indeed, with respect to the COMPOUND LINKS
Read more about this on ChemSpider
Download mol file of compoundplatinum complexes, a non-toxic COMPOUND LINKS
Read more about this on ChemSpider
Download mol file of compoundplatinum diazide has been reported to inhibit human bladder cancer cells upon irradiation in the UVA range.4 Also, photoactivation of a COMPOUND LINKS
Read more about this on ChemSpider
Download mol file of compoundplatinum complex by UV irradiation, in particular, has been demonstrated as a photoactivated cancer chemotherapy.25
Cell imaging studies
The localization of Ptcyp in live HeLa cells was followed by laser scanning confocal microscopy as an initial investigation of its applicability as a fluorescent probe for live-cell applications. To assess the intra-cellular localization of Ptcypin vivo, we incubated HeLa cells with Ptcyp in 1 × PBS as detailed in the Methods section. Fig. 10 and 11 show in situ localization of Ptcyp in live HeLa cells. The complex showed good uptake, with 100% of the sample showing luminescence attributed to Ptcyp; no auto fluorescence was detected at the 520 nm emission wavelength (panel E in Fig. 12). There are very few examples for the application of Pt complexes in live cell imaging in the literature.9,46,47 We observed weak Pt-based luminescence in the cytoplasm with no discernible pattern of localization indicating uptake of this complex by any cytoplasmic organelle (Fig. 11E) and thus suggesting very little accumulation of Ptcyp in the cytoplasm. However, maximum luminescence was observed in the nuclear region in the centre of the cells suggesting nuclear localization of the complex in HeLa cells.
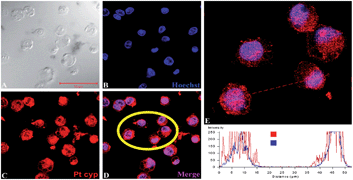 |
| | Fig. 10 Confocal images showing localization of Ptcyp (red fluorescence in C–E), DNA is counterstained with Hoechst (blue fluorescence in B, D and E). DIC image and merge image of Ptcyp and Hoechst are shown in panel A and panel D–E, respectively. The relative fluorescence intensities of Ptcyp (red) and Hoechst (blue) are shown in panel E. Cells inside yellow circle in D were measured for relative fluorescence intensity as shown in graph (panel E). Scale bar represents 50 μm. | |
 |
| | Fig. 11 Projections of confocal sections showing specific localization of Ptcyp in HeLa cells (D–E). DNA is stained with Hoechst (blue, B) and the merge image of DIC and Hoechst is shown in panel C. The orthogonal view (XX, XY) of the merge image is shown in panel F. Green circles in A, C, D and E represent the nuclear boundary while white ovals represent cell boundaries. White arrows in panel D and E point to the low concentration of Ptcyp while green arrows show intense localization of Ptcyp inside the nucleus. Scale bar represents 20 μm. | |
 |
| | Fig. 12 Confocal images showing specific localization of Ptcyp in HeLa cells (B). Blank experiment without Ptcyp was carried out in HeLa cells to see whether any auto fluorescence emanates from unstained cells. Note that there is no detectable auto fluorescence from HeLa cells (E) while Ptcyp positive cells show strong intracellular localization (red in B). Merge images of A and B, D and E are shown in C and F, respectively. | |
In order to confirm that this apparent localization in the nuclei was genuine, co-localisation experiments were undertaken by incubating cells with both Ptcyp and Hoechst34580, a stain which is known to bind strongly to DNA. The fluorescence of the two species can be differentiated due to the different emission profiles. It was observed that while the emission from Ptcyp was detected at 520 nm, the DNA stain was detected at 440 nm. However, the overlay of the fluorescence attributed to Hoechst and Ptcyp (B, D in Fig. 10 and B, E in Fig. 11) shows that the majority of Ptcyp has been localized in DNA-containing areas of the nucleus, almost mirroring the pattern of localization shown by the standard DNA stain. It appears therefore that Ptcyp is highly membrane permeable (including organellar membranes), showing good uptake, and strong irreversible binding to DNA resulting in its final localization in the cell nucleus. Interestingly, in contrast to the neutral cyclometallated species, Ptcyp does not appear to localize in the nucleoli, suggesting its preferential affinity for DNA than RNA. As all the cells appeared to maintain a healthy morphology throughout the experiment, Ptcyp could be useful for live cell imaging in cell biology research.
Experimental section
Materials and measurements
COMPOUND LINKS
Read more about this on ChemSpider
Download mol file of compoundEthidium bromide (EB) was purchased from Fluka COMPOUND LINKS
Read more about this on ChemSpider
Download mol file of compoundCo. whereas calf thymus (CT) DNA and the supercoiled (SC) plasmid DNA, pBR322 (4361 bp) were purchased from Bangalore Genei, India. The UV-visible and luminescence measurements were recorded in the range of 200–800 nm on a Shimadzu UV-1601 and a Perkin Elmer LS-45 luminescence spectrophotometer respectively.
Synthesis of PtII complex Ptcyp
Complex Ptcyp [C44H48O4N8P4F24Pt2] was prepared and characterized as described previously8 by us. The structure of the complex is shown in Fig. 1 and it is also optimized (S7†).48
In vitro cytotoxicity assay
The HeLa cells obtained from the NCCS, Pune, India, were cultured in DMEM supplemented with 10% fetal bovine serum and antibiotics (COMPOUND LINKS
Read more about this on ChemSpider
Download mol file of compoundpenicillin 100 unit per mL andstreptomycin 50 μg mL−1) and an antifungal agent (amphotericin B, 2.5 μg mL−1). Cells were maintained in a CO2 incubator with 5% CO2 at 37 °C. Approximately 2 × 10³ exponentially growing cells were seeded in a 96 well plate and after 24 h incubation, they were incubated with different concentrations (10−4–10−9 M) of Ptcyp and COMPOUND LINKS
Read more about this on ChemSpider
Download mol file of compoundcisplatin separately (five wells for each concentration) for further 24 h. The DL cells were collected from the mouse ascite as described previously.12 The experiments using DL cells, collected from the DL bearing mice, were performed in compliance with the institutional animal ethical committee guidelines. The viable DL cells, determined by the Trypan blue exclusion test, were seeded on to a 96 well plate in 100 μL of RPMI-1640 medium. DL cells were also maintained in a CO2 incubator and treated with Ptcyp and COMPOUND LINKS
Read more about this on ChemSpider
Download mol file of compoundcisplatin as described for the HeLa cells. Cell viability was determined by COMPOUND LINKS
Read more about this on ChemSpider
Download mol file of compound3-(4,5-dimethylthiazol-2-yl)-2,5-diphenyltetrazolium bromide (MTT) assay, which is based on the ability of viable cells to reduce a soluble yellow COMPOUND LINKS
Read more about this on ChemSpider
Download mol file of compoundtetrazolium salt into a blue formazan crystal.19,20 Briefly, after 24 h of the treatment, the MTT dye (10 μL/100 μL of medium), prepared in phosphate buffered saline (PBS), was added to all the wells. The plates were then incubated for 4 h at 37 °C, the medium was discarded and 100 μL of COMPOUND LINKS
Read more about this on ChemSpider
Download mol file of compoundDMSO was added to each well. Optical density was measured at 570 nm. The percentage of viable cells was determined by taking the cell counts in the untreated sets as 100%. By the help of semi-logarithmic dose–response plots, constructed using Graph Pad Prism5 software, the IC50 values were determined as concentration of the compound that resulted in DL cell death by 50%.
The absorption spectral titrations were performed using a fixed concentration of complex (1 × 10⁻⁵ M) with incremental addition of the solution of the CT-DNA in [COMPOUND LINKS
Read more about this on ChemSpider
Download mol file of compoundPt(II) complex]![[thin space (1/6-em)]](https://www.rsc.org/images/entities/char_2009.gif) :[DNA] ratios ranging from 0.1 to 0.6. Complex–DNA solutions were allowed to stand for 5 min before recording their absorption spectra. Absorbance was corrected for the minor dilution effects by monitoring the absorbance of CT-DNA in the reference set also. All absorptions scans were saved as ACSII files and further processed in Origin Pro 6.1 to produce all graphs shown.
:[DNA] ratios ranging from 0.1 to 0.6. Complex–DNA solutions were allowed to stand for 5 min before recording their absorption spectra. Absorbance was corrected for the minor dilution effects by monitoring the absorbance of CT-DNA in the reference set also. All absorptions scans were saved as ACSII files and further processed in Origin Pro 6.1 to produce all graphs shown.
Photophysical studies
Time-resolved fluorescence intensity of the dye was measured by employing a CW passively mode-locked frequency-doubled Nd-YAG laser (Vanguard, Spectra Physics, USA) driven rhodamine 6G dye tunable laser, which generates pulses of width ∼1 ps (repletion rate 4 MHz). The sample was excited by using the second harmonic output (304 nm) of an angle-tuned KDP crystal. Fluorescence decay curves were obtained by using a time-correlated, single-photon counting setup, coupled to a micro-channel plate photomultiplier (model 2809u; Hamamatsu Corp.). The instrument response function (IRF) was obtained at 304 nm using a dilute colloidal suspension of dried non-dairy coffee whitener. The half-width of the instrument response function was ∼40 ps, and the time per channel was 40 ps. The cut-off filter was used to prevent scattering of the excitation beam from the samples. The number of counts in the peak channel was at least 10000. In fluorescence lifetime measurements, the emission was monitored with the polarizer at the magic angle (54.7°) to eliminate any contribution from the decay of anisotropy. Time-resolved fluorescence decay data were fit to a function that is a sum of discrete exponentials:
where Σαi = 1, by the iterative deconvolution method. The correction factors for αi and τi were determined by the Marquardt method in non-linear least-squares analysis. Numerical calculation of the convolution integrals for intensity and partial derivatives was done with the Grinvald–Steinberg recursion equations. The mean lifetime, τm = Σαiτi, correlates with the average fluorescence yield of the system.
DNA binding experiments of the COMPOUND LINKS
Read more about this on ChemSpider
Download mol file of compoundplatinum complex Ptcyp are carried out in COMPOUND LINKS
Read more about this on ChemSpider
Download mol file of compoundNa–phosphate buffer (aqueous solution). The absorption ratio at 260 nm and 280 nm of CT DNA was found to be 1.9:1, showing that the DNA is sufficiently free from protein. The concentration of DNA is determined by UV-vis absorbance using the molar absorption coefficient of 6600 M−1 cm−1 at 260 nm. The complex Ptcyp exhibits fluorescence ∼λem 500 nm at the excitation wavelength (λex) 340 nm. Therefore, binding of the COMPOUND LINKS
Read more about this on ChemSpider
Download mol file of compoundplatinum complex to CT DNA was also studied by fluorescence spectroscopy. The binding of the COMPOUND LINKS
Read more about this on ChemSpider
Download mol file of compoundplatinum complex to CT DNA is performed by monitoring the changes in the emission spectral pattern of COMPOUND LINKS
Read more about this on ChemSpider
Download mol file of compoundplatinum complex Ptcyp (0.5 μM) in COMPOUND LINKS
Read more about this on ChemSpider
Download mol file of compoundNa–phosphate buffer (pH 7.4) in the presence of increasing concentrations of CT DNA (0–5 μM). After addition of DNA to the COMPOUND LINKS
Read more about this on ChemSpider
Download mol file of compoundplatinum complex, the resulting solution was allowed to equilibrate for 5 min at 25 °C, excited at 340 nm followed by recording the spectral changes.
Competitive DNA binding studies of Ptcyp with that of the COMPOUND LINKS
Read more about this on ChemSpider
Download mol file of compoundethidium bromide were carried out using recording of COMPOUND LINKS
Read more about this on ChemSpider
Download mol file of compoundethidium bromide fluorescence quenching after successive addition of 0–0.75 μM of complex Ptcyp to 10 μM DNA solutions containing 10 μM COMPOUND LINKS
Read more about this on ChemSpider
Download mol file of compoundethidium bromide in COMPOUND LINKS
Read more about this on ChemSpider
Download mol file of compoundNa–phosphate buffer (pH 7.4). The extent of COMPOUND LINKS
Read more about this on ChemSpider
Download mol file of compoundethidium bromide fluorescence quenching due to addition of Ptcyp was taken as a measure of strength of intercalation of Ptcyp with the DNA. For this experiment, samples were excited at λex 510 nm and emission spectra were recorded between 550 and 700 nm. Stern–Volmer quenching constants were calculated using the equation Io/I = 1 + Ksvr, where Io and I are the fluorescence intensities in the absence and presence of Ptcyp respectively, Ksv is a linear Stern–Volmer quenching constant and r is the ratio of the total concentration of the complex to that of DNA. The value of Ksv was given by the ratio of slope to intercept in a plot of Io/I versus [Ptcyp]/[DNA].
DNA cleavage studies
Monitoring the changes in a supercoiled structure of pBR322 DNA is a reliable tool to ascertain the DNA cleavage potential of a compound. In order to study whether the Ptcyp was able to cleave DNA, different concentrations (50 and 500 μM) of Ptcyp were incubated with 0.5 μg pBR322 DNA for 24 and 48 h separately in 25 μL of the two separate reaction mixtures: (a) aqueous: Tris–COMPOUND LINKS
Read more about this on ChemSpider
Download mol file of compoundCl buffer (pH 7.4) containing 50 mM COMPOUND LINKS
Read more about this on ChemSpider
Download mol file of compoundNaCl and (b) organic: 0.02 and 0.2% COMPOUND LINKS
Read more about this on ChemSpider
Download mol file of compoundDMSO. After incubation was over, samples were analyzed on native agarose gel electrophoresis followed by COMPOUND LINKS
Read more about this on ChemSpider
Download mol file of compoundethidium bromide staining of the DNA bands. In order to study the photo-cleavage property of the COMPOUND LINKS
Read more about this on ChemSpider
Download mol file of compoundplatinum complex Ptcyp in aqueous solution, different concentrations of the compound were incubated with 0.5 μg pBR322 DNA in 5 mM Tris–COMPOUND LINKS
Read more about this on ChemSpider
Download mol file of compoundCl buffer (pH 7.4) containing 50 mM COMPOUND LINKS
Read more about this on ChemSpider
Download mol file of compoundNaCl. The reaction mixtures are exposed to UV light (312 nm, 64 W) for 10 min. The samples are analyzed on 1% agarose gel electrophoresis in TAE buffer for 3 h at 50 V. The COMPOUND LINKS
Read more about this on ChemSpider
Download mol file of compoundethidium bromide stained DNA bands are photographed and quantified by AlphaImager 2200 software.
Circular dichroism studies
CD spectra were recorded on a JASCO J-810 spectropolarimeter at increasing complex/DNA ratio. Each sample solution was scanned in the range of 220–320 nm. The CD spectrum thus generated represents an average of three scans from which the buffer background had been subtracted. The concentration of DNA solution was 1.0 × 10⁻⁴ M.
HeLa cells, obtained from NCCS (National Centre for Cell Science, Pune, India), were grown in a culture flask containing DMEM (Delbeco Modified Eagle's Medium) supplemented with 10% FBS (Fetal Bovine Serum) and 5% CO2 at 37 °C. Cells were trypsinized with 0.05% trypsin–EDTA (GIBCO-25300) for 2 minutes followed by addition of 1 mL of fresh DMEM medium containing serum to inhibit trypsin activity. Cells were spun at 1200 rpm for 10 minutes and the sediment was suspended in 1 × PBS (pH 7.4), placed on polylysine coated slides and incubated for one hour at room temperature for adherence. Cells were incubated with Ptcyp (20 μM) for 30 min, briefly washed twice with 1 × PBS and then incubated with Hoechst34580 (1 μg mL−1) for 5 min followed by washing with PBS. Live cells were imaged by a ZEISS LSM-510 Meta confocal microscope. The excitation wavelength for Ptcyp is 488 nm (COMPOUND LINKS
Read more about this on ChemSpider
Download mol file of compoundArgon 488 Laser line) and emission for Ptcyp was collected at 520 nm. The excitation wavelength for Hoechst was 405 nm (Diode 405) and emission was recorded at 440 nm. Fluorescence intensities were measured by Zeiss LSM software.
Conclusion
The recently synthesized PtII complex Ptcyp constructed on the skeleton of a simple Schiff base COMPOUND LINKS
Read more about this on ChemSpider
Download mol file of compoundN,N′-bis(salicylidene)-p-phenylenediamine shows strong cytotoxicity against cancerous cell lines. It also binds with and cleaves DNA readily in aqueous medium containing 0.02 and 0.2% of COMPOUND LINKS
Read more about this on ChemSpider
Download mol file of compoundDMSO. The UV irradiation-induced nicking of supercoiled DNA in a buffer solution by this complex suggests that Ptcyp also shows photo-induced nuclease action in aqueous medium. The complex also offers a new DNA stain for fluorescence microscopic studies in vivo, one of the first Pt complexes demonstrated to be applicable in such studies, with the advantages of a transition metal fluorophore in terms of photophysical attributes.
Acknowledgements
Authors thank UGC, New Delhi, India, for financial assistance; DST-FIST & UGC CAS programme to the Department of Zoology for infrastructural facilities. The authors BK Maurya, RK Koiri and NK thank CSIR, New Delhi, for the award of JRF, SRF and RA respectively. One of the authors (SS) acknowledges Dr Geeta Rai, Molecular and Human Genetics, BHU, Varanasi, India for her help in the cell imaging study. We also thank Professor J.C. Dabrowiak, University of Syracruse, USA and Dr Vinod Bhakuni CDRI, Lucknow, India, for reading the manuscript and help in recording the CD spectra respectively.
Notes and references
- S. R. Rajski and R. M. Williams, Chem. Rev., 1998, 98, 2723–2795 CrossRef CAS.
- D. Crespy, K. Landfester, U. S. Schubert and A. Schiller, Chem. Commun., 2010, 46, 6651–6662 RSC.
- V. Brabec, Prog. Nucleic Acid Res. Mol. Biol., 2002, 71, 1–68 CrossRef CAS.
- P. J. Bednarski, R. Grunert, M. Zielzki, A. Wellner, F. S. Mackay and P. J. Sadler, Chem. Biol., 2006, 13, 61–67 CrossRef CAS.
- F. S. Mackay, J. A. Woods, P. Heringova, J. Kasparkova, A. M. Pizarro, S. A. Moggach, S. Parsons, V. Brabec and P. J. Sadler, Proc. Natl. Acad. Sci. U. S. A., 2007, 104, 20743–20748 CrossRef CAS.
- N. J. Farrer, J. A. Woods, V. P. Munk, F. S. Mackay and P. J. Sadler, Chem. Res. Toxicol., 2010, 23, 413–421 CrossRef CAS , and references therein.
- A. Hille, I. Ott, A. Kitanovic, I. Kitanovic, H. Alborzinia, E. Lederer, S. Woelfl, N. Metzler-Nolte, S. Schaefer, W. S. Sheldrick, C. Bischof, U. Schatzschneider and R. Gust, JBIC, J. Biol. Inorg. Chem., 2009, 14, 711–725 CrossRef CAS.
- N. Kumari, R. Prajapati and L. Mishra, Polyhedron, 2008, 27, 241–248 CrossRef CAS.
- S. W. Botchway, M. Charnley, J. W. Haycock, A. W. Parker, D. L. Rochester, J. A. Weinstein and J. A. G. Williams, Proc. Natl. Acad. Sci. U. S. A., 2008, 105, 16071–16076 CrossRef CAS.
- C. M. Che, S. C. Chan, H. F. Xiang, M. C. W. Chan, Y. Liu and Y. Wang, Chem. Commun., 2004, 1484 RSC.
- Y. Y. Lin, S. C. Chan, M. C. W. Chan, Y. J. Hou, N. Zhu, C. M. Che, Y. Liu and Y. Wang, Chem.–Eur. J., 2003, 9, 1263 CrossRef CAS.
- J. Kavitha, S. Y. Chang, Y. Chi, J. K. Yu, Y. H. Hu, P. T. Chou, S. M. Peng, G. H. Lee, Y. T. Tao, C. H. Chien and A. J. Carty, Adv. Funct. Mater., 2005, 15, 223 CrossRef CAS.
- S. D. Cummings and R. Eisenberg, J. Am. Chem. Soc., 1996, 118, 1949 CrossRef CAS.
- R. Ballardini, G. Varani, M. T. Indelli and F. Scandola, Inorg. Chem., 1986, 25, 3858 CrossRef CAS.
- D. Donges, J. K. Nagle and H. Yersin, Inorg. Chem., 1997, 36, 3040 CrossRef CAS.
- R. K. Koiri, S. K. Trigun, L. Mishra, K. Pandey, D. Dixit and S. K. Dubey, Invest. New Drugs, 2009, 27, 503–516 CrossRef CAS.
- R. Prajapati, S. K. Dubey, R. Gaur, R. K. Koiri, B. K. Maurya, S. K. Trigun and L. Mishra, Polyhedron, 2010, 29, 1055–1061 CrossRef CAS.
- N. Dixit, R. K. Koiri, B. K. Maurya, S. K. Trigun, C. Höbartner and L. Mishra, J. Inorg. Biochem., 2011, 105, 256–267 CrossRef CAS.
- T. J. Mosman, Immunol. Methods, 1983, 65, 55–63 CrossRef.
- M. C. Alley, D. A. Scudiero, A. Monks, M. L. Hursey, M. J. Czerwinski, D. L. Fine, B. J. Abbott, J. G. Mayo, R. H. Shoemaker and M. R. Boyd, Cancer Res., 1988, 48, 589–601 CAS.
- S. Wu-Chou, C. Shu-Ling, C. Tsai-Yun, C. Jiann-Shiuh and T. Chao-Jung, Jpn. J. Clin. Oncol., 2000, 30, 562–567 CrossRef.
- L. Giovagnini, C. Marzano, F. Bettio and D. Fregona, J. Inorg. Biochem., 2005, 99, 2139–2150 CrossRef CAS.
- G. Momekov, D. Ferdinandov, S. Konstantinov, S. Arpadjan, D. Tsekova, G. Gencheva, P. R. Bontchev and M. Karaivanova, Bioinorg. Chem. Appl., 2008, 2008, 1–8 CrossRef.
- S. Sarna and R. K. Bhola, Curr. Sci., 2007, 93, 1300–1304 CAS.
- F. S. Mackay, J. A. Woods, P. Heringova, J. Kasparkova, A. M. Pizarro, S. A. Moggach, S. Parsons, V. Brabec and P. J. Sadler, Proc. Natl. Acad. Sci. U. S. A., 2007, 104, 20743–20748 CrossRef CAS.
- E. Wong and C. M. Giandomenico, Chem. Rev., 1999, 99, 2451–2466 CrossRef CAS.
- M. J. McKeage, Expert Opin. Invest. Drugs, 2005, 14, 1033–1046 CrossRef CAS.
- S. Kashanian and J. E. N. Dolatabadi, Food Chem., 2009, 116, 743–747 CrossRef CAS.
- B. J. Hathaway, Struct. Bonding (Berlin, Ger.), 1984, 57, 55–118 CrossRef CAS.
- W. I. Sundquist and S. J. Lippard, Coord. Chem. Rev., 1990, 100, 293–322 CrossRef CAS.
- F. Arjmand, F. Sayeed and M. Muddassir, J. Photochem. Photobiol., B, 2011, 103, 166–179 CrossRef CAS.
- J. D. McGhee and P. H. Hippel, J. Mol. Biol., 1974, 86, 469–489 CrossRef CAS.
- C. V. Kumar, J. K. Barton and N. J. J. Turro, J. Am. Chem. Soc., 1985, 107, 5518–5523 CrossRef CAS.
- J. K. Barton, J. M. Goldberg, C. V. Kumar and N. J. J. Turro, J. Am. Chem. Soc., 1986, 108, 2081–2088 CrossRef CAS.
- J. B. Lepecq and C. Paoletti, J. Mol. Biol., 1967, 27, 87–106 CrossRef CAS.
- V. I. Ivanov, L. E. Minchenkova, A. K. Schyolkina and A. I. Poletayer, Biopolymers, 1973, 12, 89–110 CrossRef CAS.
- P. Lincoln, E. Tuite and B. J. Norden, J. Am. Chem. Soc., 1997, 119, 1454–1455 CrossRef CAS.
- B. Norden and F. Tjerneld, Biopolymers, 1982, 21, 1713–1734 CrossRef CAS.
- A. D. Richards and A. Rodger, Chem. Soc. Rev., 2007, 36, 471–483 RSC.
- B. Selvakumar, V. Rajendiran, P. U. Maheswari, H. S. Evans and M. Palaniandavar, J. Inorg. Biochem., 2006, 100, 316–330 CrossRef CAS.
- D. S. Sigman, A. Mazumder and D. M. Perrin, Chem. Rev., 1993, 93, 2295–2316 CrossRef CAS.
- M. A. De Rosch and W. C. Trogler, Inorg. Chem., 1990, 29, 2409–2416 CrossRef CAS.
- J. K. Bashkin, Comments Inorg. Chem., 1994, 16, 77–93 CrossRef CAS.
- E. D. Sternberg, D. Dolphin and C. Brückner, Tetrahedron, 1998, 54, 4151–4202 CrossRef CAS.
- E. R. Jamieson and S. J. Lippard, Chem. Rev., 1999, 99, 2467–2498 CrossRef CAS.
- R. R. de Haas, R. P. M. van Gijlswijk, E. B. van der Tol, H. J. M. A. A. Zijlmans and T. Bakker-Schut, J. Histochem. Cytochem., 1997, 45, 1279–1292 CrossRef CAS.
- R. R. de Haas, R. P. M. van Gijlswijk, E. B. van der Tol, J. Veuskens, H. E. van Gijssel, R. B. Tijdens, J. Bonnet, N. P. Verwoerd and H. J. Tanke, J. Histochem. Cytochem., 1999, 47, 183–196 CrossRef CAS.
- N. Kumari, R. Prajapati, M. Dixit and L. Mishra, Indian J. Chem., Sect. A: Inorg., Bio-inorg., Phys., Theor. Anal. Chem., 2009, 48, 1644–1651 Search PubMed.
Footnote |
| † Electronic supplementary information (ESI) available: Synthetic and characterization data, further figures and an optimized structure of complex Ptcyp are available. See DOI: 10.1039/c1md00159k |
|
| This journal is © The Royal Society of Chemistry 2011 |
Click here to see how this site uses Cookies. View our privacy policy here. ![UV-vis absorption spectra of PtII-complex Ptcyp in the presence of increasing concentration of DNA. [DNA] = 0–6 μM, [Ptcyp] = 10 μM.](/image/article/2011/MD/c1md00159k/c1md00159k-f3.gif)
![Fluorescence quenching pattern of ethidium bromide bound to DNA by the Pt complex. [DNA] = 10 μM, [Ptcyp] = 0–0.75 μM. {Inset: quenching plot of Io/I vs. [Ptcyp]/[DNA]}.](/image/article/2011/MD/c1md00159k/c1md00159k-f6.gif)
![Circular dichroism spectra of CT-DNA in the presence of increasing concentration of PtII complex Ptcyp in 0.1 mM Na–phosphate buffer. [DNA] = 100 μM, [Ptcyp] = 20–80 μM.](/image/article/2011/MD/c1md00159k/c1md00159k-f7.gif)