Piezoelectric microelectromechanical resonant sensors for chemical and biological detection
Wei
Pang
a,
Hongyuan
Zhao
a,
Eun Sok
Kim
b,
Hao
Zhang
*a,
Hongyu
Yu
c and
Xiaotang
Hu
a
aState Key Laboratory of Precision Measuring Technology and Instruments, Tianjin University, Tianjin, China 300072. E-mail: haozhang@tju.edu.cn; Tel: +86 (22)27407530
bDepartment of Electrical Engineering-Electrophysics, University of Southern California, LA, CA 90089, USA
cSchool of Earth and Space Exploration, Arizona State University, Tempe, Arizona 85287, USA
First published on 2nd November 2011
Abstract
Piezoelectric microelectromechanical systems (MEMS) resonant sensors, known for their excellent mass resolution, have been studied for many applications, including DNA hybridization, protein–ligand interactions, and immunosensor development. They have also been explored for detecting antigens, organic gas, toxic ions, and explosives. Most piezoelectric MEMS resonant sensors are acoustic sensors (with specific coating layers) that enable selective and label-free detection of biological events in real time. These label-free technologies have recently garnered significant attention for their sensitive and quantitative multi-parameter analysis of biological systems. Since piezoelectric MEMS resonant sensors do more than transform analyte mass or thickness into an electrical signal (e.g., frequency and impedance), special attention must be paid to their potential beyond microweighing, such as measuring elastic and viscous properties, and several types of sensors currently under development operate at different resonant modes (i.e., thickness extensional mode, thickness shear mode, lateral extensional mode, flexural mode, etc.). In this review, we provide an overview of recent developments in micromachined resonant sensors and activities relating to biochemical interfaces for acoustic sensors.
 Wei Pang | Wei Pang received a B.S. degree from Tsinghua University, Beijing, China in 2001, and a Ph.D. degree in Electrical Engineering from the University of Southern California, Los Angeles, CA, in 2006. He worked in the wireless semiconductor division of Avago Technologies, Fort Collins, CO. He is currently a Professor at the College of Precision Instrument and Optoelectronics Engineering, Tianjin University, China. He has published 48 refereed papers in the areas of MEMS for RF wireless communications, biological detection, wireless sensor platforms, and medical ultrasound. He is an author of two issued and 10 pending U.S. patents. |
 Eun Sok Kim | Eun Sok Kim received B.S., M.S., and Ph.D. degrees, all in electrical engineering, from the University of California, Berkeley, in 1982, 1987, and 1990, respectively. In Fall 1999, he joined the University of Southern California, Los Angeles, CA, and is currently a Professor and the Chair in the Ming Hsieh Department of Electrical Engineering - Electrophysics. Prof. Kim is an expert in piezoelectric and acoustic MEMS, having published more than 180 refereed papers and 10 issued patents in the field, and is a Fellow of the IEEE and the Institute of Physics (IOP). |
1. Introduction
As biomedical research continues to find new proteins or chemical markers (biomarkers) associated with specific diseases or conditions, interest grows in using detection as an alternative to symptomatic diagnosis. Developing techniques that detect sufficiently low quantities of these biomarkers is the ultimate goal in early disease detection.1 Because of the inherent complexity of biochemical pathways commonly altered in disease states, multiplexed analyses can provide a more informative biomolecular understanding of disease onset and progression. Importantly, when compared to conventional single-parameter assays, a detailed biomolecular insight gleaned from multi-parameter measurements has the potential to greatly improve disease diagnostics, prognostics, and theragnostics.High-information-content genomic and proteomic technologies, such as capillary sequencing, complementary DNA microarrays, two-dimensional polyacrylamide gel electrophoresis and mass spectrometry, have greatly increased the level of molecular clarity with which we now understand human biology. Coupled with immortalized cell lines and modern molecular and cell biology techniques, these genomic and proteomic tools are well suited to and established for use in research laboratories. Unfortunately, many of the measurement approaches are not rigorously quantitative and are not ideal for use in the clinic, where sample sizes and specialized training in analytical methods are limited.
One of the greatest challenges in many biological detection schemes and quantitative clinical bioanalyses arises because they require labeling, typically performed using fluorescent markers, enzymes, radioactive species, or quantum dots. These label-based techniques do not give real-time binding kinetics, as well as additional time and costs incurred to label the biomolecules. Often labels are connected to antigens or antibodies in a random way and, depending on their binding site, could interfere with the protein, reducing antigen-antibody chemical activity and compromising the antigen–antibody structure and function. For example, it was recently reported that the presence of a fluorescent label could have detrimental effects on the affinity of an antigen–antibody interaction.2 In addition, steric hindrance may become a problem in binding experiments where the size of the molecule becomes comparable to or less than its label size.3 As the desired detection limits move into ng mL−1 – pg mL−1 concentrations, labeled detection becomes increasingly difficult since common fluorescence techniques are simply not sensitive enough to distinguish very few fluoresced photons from the background.
For these and other reasons, there is a great interest in developing label-free detection systems that are equally or more sensitive than labeled detection techniques. Based upon measurements of an inherent molecular property, such as refractive index or mass, different classes of sensing methods have been proposed and show promise for use in label-free studies of bio-molecular interactions. The approaches include surface plasmon resonance (SPR) spectroscopy,4 photonic biosensors (e.g., ones based on photonic crystals,5 optical microcavity resonators,6 reflective interferometry, and imaging ellipsometry), sensors based on nanowires7 and nanotubes.8 These can be used to measure the binding-induced change in some electrical properties of the circuit in which the sensor is a vital component. Examples include micro-cantilevers using optical, electrostatic, and electromechanical methods for actuating and sensing cantilever motion,9quartz-crystal-microbalances (QCM),10 and thin film piezoelectric MEMS resonant mass sensors.
Today, the quartz crystal microbalance (QCM) is probably the most widely used mass-sensing method for detecting various chemical and biological agents. The QCM is a piezoelectric resonant sensor device operating with a resonance frequency of about 5–20 MHz. Its history began in 1959, when Sauerbrey published the essential relationship between the change in resonant frequency of a quartz crystal and the mass added to its surface.11 A typical thickness of QCM is hundreds of micrometres, and its lateral dimension is several millimetres. In sensing applications in the life sciences, an ideal sensor should have an active sensing area that is comparable to the size of its sensing target. For instance, in a biological study with a single cell,12 the surface dimension of the device in contact with the cell is designed to match the cell size, about tens of micrometres in diameter. A typical QCM, having a lateral dimension in the millimetre to centimetre range, presents a challenge for sensing micron-sized objects, such as single cells, molecules, small particles, etc., or for sensing in a limited space.
Recently, with MEMS fabrication and piezoelectric film deposition technologies progressing rapidly, micromachined piezoelectric resonant mass sensing devices have emerged as highly versatile sensors for detecting gases, chemicals, and biological entities. Recent research has demonstrated mass resolution on the order of ng cm−2 in liquid and absolute mass of picograms to femtograms. Microfabricated sensing devices can be designed in different shapes and sizes, and also formed into arrays with large numbers of elements. Such flexibility presents opportunities for novel label-free detectors with high sensitivity and very high level of multiplexing that are not easily matched by QCM or SPR. Size and design flexibility of the devices also offer possibilities for incorporating microfluidics and miniaturized lab-on-a-chip formats.13 Furthermore, the fabrication processes of thin film resonators are compatible with that of integrated circuits (IC), which enables on-chip integration of sensor and electronics, and low-cost mass production of miniature sensor systems. Johnston et al.14 demonstrated the first monolithic CMOS oscillator array by placing 24 solid mounted piezoelectric MEMS resonant devices directly above CMOS circuitry for mass sensing applications. These oscillators were designed to amplify the signal and strengthen the resonance, and particularly overcome energy loss associated with the resonator operating in liquid to sustain the oscillation. Instead of an oscillator, a frequency counter can also be integrated to measure the frequency shift, enabling a completely automated sensing and evaluation platform on a chip. An array of such mass sensors will allow simultaneous, multiplexed, highly-sensitive measurements of multiple targets on a single sensor chip, eliminating complex external instrumentation and spatial limitations.
Thin film piezoelectric MEMS resonant sensors are similar to QCM in that they generate acoustic waves and utilize measurement in the variation of the wave propagation properties as a signal for probing events on the surface of the sensor. The output signal of piezoelectric MEMS sensors is usually frequency, and the resonant frequency shift can imply a quantitative measurement of chemical or biological molecules bound to the chemically modified sensor surface. However, when compared with other types of biosensors, particularly SPR-based biosensors, the true power of piezoelectric sensors lies in the tremendous amount of information that can be obtained from measuring their acoustic impedance (e.g., the Q factor that represents the acoustic energy dissipation). Monitoring complex electrical impedance opens possibilities for a variety of potential sensor applications. For example, as additional properties of hybridized DNA are obtained, it becomes possible to quantitatively distinguish DNA molecules with the same molecular mass, but with different structures.15
This paper reviews the technologies and recent developments in the field of micromachined piezoelectric resonant mass sensors, with particular emphasis on their biological sensing applications in liquid environments and on recent work toward integrating these sensors into microfluidic systems. In what follows, we address the physical principles of different approaches (i.e., resonator modes) to constructing sensor devices, identify fundamental aspects of sensor performance, and present examples of surface modifications (required for resonators to become selective biosensors) for various biochemical applications. Finally, we present some perspectives on piezoelectric MEMS mass sensors, identifying several challenges associated with microgravimetry (effects other than mass changes).
2. Resonant modes
2.1 Thickness extensional mode (TE)
Thickness extensional mode is a longitudinal mode excited in a vertically grown piezoelectric material film by coupling the vertical electric field through the d33 piezoelectric coefficient. This is usually achieved by sandwiching the piezoelectric layer with top and bottom electrodes, and applying an AC voltage to the electrodes to excite a resonance. Two principal thin film resonator topologies are illustrated in Fig. 1, one with two air-solid interfaces and the other having one air-solid interface and one acoustic mirror stack on the substrate. Both wave velocity and resonant frequency of the TE mode are higher than those of any other possible modes for a given piezoelectric film and can offer the highest sensitivity. However, when a TE-mode resonator is immersed in a liquid, as needed for biosensing applications, it suffers great damping because acoustic energy is radiated into (and lost in) the liquid. | ||
| Fig. 1 Schematics of (a) a basic membrane type FBAR based on thickness extensional mode, with two air boundaries to reflect and confine acoustic wave within the membrane,56 and (b) a solidly mounted FBAR comprising an acoustic mirror (W/SiO2) on the basis of Bragg reflection on a CMOS integrated circuit substrate.14Reproduction of the figures has been made with permissions from the American Institute of Physics and the Institute of Electrical and Electronics Engineers. | ||
The deposition process (i.e., sputtering) of piezoelectric thin film with a c-axis oriented perpendicular to the plane of the substrate is mature, and TE mode bulk acoustic microresonators are currently used for RF-front-end filters in mobile handsets. The recent commercial success of the TE-mode-based microresonators indicates potential wide adaptation of piezoelectric MEMS resonators in mass sensing, especially since they are available to users at a very low cost.
2.2 Thickness shear mode (TS)
Excitation of the shear mode in thin film bulk acoustic resonators commonly requires a sputtering process to deposit piezoelectric film (e.g., AlN and ZnO) with an inclined c-axis.16,17 With the c-axis non-perpendicular to the plane of a piezoelectric film sandwiched between two electrodes (one on the top surface and the other on the bottom surface of the piezoelectric film), an alternating electric field applied between the two electrodes produces a shear deformation. Upon deformation, the top and bottom surfaces move in parallel but opposite directions, thereby generating acoustic waves that propagate in the thickness direction. Alternatively, a shear-wave can be generated with a lateral electric field applied between two patterned electrodes on one surface of the piezoelectric film.18 Yet another approach to generate thickness shear is to make the bottom electrode larger than the top electrode in order to create a lateral electric field in a piezoelectric film. This approach was used to obtain a sensor that measures density-viscosity product.19Thickness shear mode is, in general, considered to be better than thickness extensional mode for operation in liquid since a shear acoustic wave does not displace molecules perpendicular to the resonator surface, and there is considerably less loss radiated into the liquid than a longitudinal wave. However, the wave velocity and resonant frequency of a shear wave are lower than those of a longitudinal wave, and therefore, result in a lower mass sensitivity. During the last decade, the development of the thickness shear mode thin film device was strongly driven by its potential use as biosensors, especially for the anticipated high volume market of point-of-care (POC) applications.20
2.3 Lateral extensional mode (LE)
Lateral extensional mechanical stress can be produced by an electric field applied across the piezoelectric film thickness through the d31 piezoelectric coefficient. The lateral extensional stress excites a longitudinal wave traveling in a lateral direction, and the structure vibrates in a dilation-type contour mode. In this case, the resonant frequency is to the first order independent of the film thickness, but rather determined by the resonator's lateral dimension, which can be defined lithographically. The sidewalls of the piezoelectric film are used for mass sensing, and the quality factor (Q) in liquid can be high because the amount of the longitudinal wave transmitted to the liquid from the sidewall (defined by the film thickness and a lateral dimension) is relatively small.2.4 Flexural mode (Flex.)
Flexural mode vibration can be excited in cantilevers, clamped-clamped beams, or membranes by incorporating a thin layer of piezoelectric material to one or both sides of a structure layer (e.g., SiN, SiO2). When an alternating voltage is applied across the piezoelectric film, the film expands and contracts lengthwise at the input frequency, producing bending moment on the structure that supports the piezoelectric film. The bending moment causes the structure to vibrate flexurally at the same frequency as the applied voltage. The vibration amplitude is increased by about Q factor if the frequency of the applied voltage is the same as the resonant frequency of the structure. The resonant frequency of a cantilever is dependent on its effective spring constant and mass, and mass change due to an added mass contributes to a resonant frequency shift. After the capture of target molecules on a functionalized cantilever surface, absorption-induced surface stress change affects the stiffness of the cantilever, and may overwhelm mass loading effects.21 Typical cantilever resonators submersed in liquid have quality factors of 10–100 in the MHz range because of large viscous damping.22 One solution to the reduced Q is to enclose liquid inside a hollow cantilever and operate the cantilever in vacuum so that high Q factor and ultralow mass resolution may be maintained.23To summarize, grid and line representations of the deformation pattern associated with four modes mentioned earlier are depicted in Fig. 2, and SEM images of typical devices corresponding to each of the modes are shown in Fig. 3.
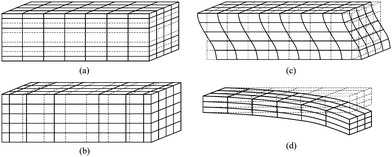 | ||
| Fig. 2 Grid diagrams for plane uniform particle displacement waves propagating in solids associated with (a) thickness extensional (TE) mode, (b) lateral extensional (LE) mode, (c) thickness shear (TS) mode, and (d) flexural mode. These four modes are common modes of wave propagating in piezoelectric MEMS resonators. | ||
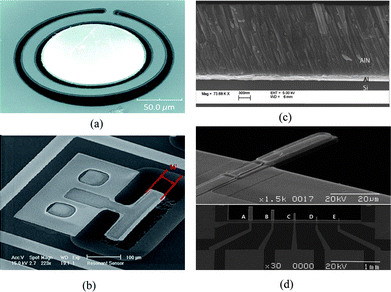 | ||
| Fig. 3 SEM photo of (a) a fabricated ring-shaped AlN FBAR based on lateral extensional mode or contour mode, the top surface is the sensing area;53 (b) a lateral extensional mode piezoelectric resonator whose resonant frequency is determined by its width, the sidewall is the active sensing area;43 (c) the cross section of a AlN film with an inclined c-axis for efficient excitation of thickness shear mode;17 (d) a fabricated flexural mode microcantilever (30 × 10 μm2) and other cantilevers with various shapes, a piezoelectric film (PZT) was integrated as a driving component on an elastic supporting layer of SiNx.62 Reproduced by the kind permissions of the American Institute of Physics and the Institute of Electrical and Electronics Engineers. | ||
3. Sensing mechanism
Sauerbrey first demonstrated that acoustic bulk wave resonators could be used as mass sensors, and developed an equation for measuring the characteristic frequency and its changes by using the resonator as the frequency-determining component of an oscillator circuit. The Sauerbrey equation is defined as | (1) |
The natural resonant frequency of an acoustic resonator could be estimated by the equation:
 | (2) |
 | (3) |
Indeed, in many applications acoustic sensors are used to convert a mass accumulated on the surface into a frequency shift. In biochemical applications, however, this basic understanding of the sensor principle can lead to misinterpreted experimental results, especially when working in a liquid environment. The sensor response is influenced by interfacial phenomena and viscoelastic properties of the adhered biomaterial. Moreover, effects other than mass changes, also called non-gravimetric effects, can be expected to contribute significantly to sensor response. For example, in references 24–26, the viscoelastic properties of the adsorbents were measured from either the change of the resonant frequency shift or the change of the quality factor. The sensor response corresponds well with theoretical models in the low viscosity regime, but deviates strongly for higher viscosities, and is explained by the elastic property of liquid.24
4. Performance criteria: mass sensitivity and mass detection resolution
Mass sensitivity and mass detection resolution are primary factors when evaluating the performance of a mass sensor. Other factors such as selectivity, repeatability, response time, stability, reliability are also of critical importance, and need to be considered for sensor design and structure, operating acoustic mode, device fabrication and packaging, coating material, etc. In this section, mass sensitivity and mass detection resolution will be discussed in detail.4.1 Mass sensitivity
Sensor sensitivity is commonly defined as the change in output signal obtained with an incremental change in the input signal to be detected. Correspondingly, the mass sensitivity of an acoustic wave mass sensor is characterized as the frequency change per unit mass accumulation on the sensor, which typically has a unit of [frequency]/[mass]. Because various definitions of mass sensitivity exist, however, several other units have also been used to describe mass sensitivity in the literature such as [frequency]/[mass per unit area], [ppm]/[mass per unit area], and [ppm]/[ppm].A mass sensitivity Sm of a piezoelectric mass sensor can be defined as27
 | (4) |
 | (5) |
 | (6) |
 | (7) |
 | (8) |
| Sm3 = f0·Sm | (9) |
 | (10) |
Mass sensitivity is an internal property of mass sensors, and solely dependent on the structural or mechanical parameters of the device, including device dimension, material density and thickness, frequency of operation, working acoustic mode, etc.
4.2 Mass detection resolution
A mass sensor provides a continuously changing output response within a range called dynamic range that is bounded by the sensor's saturation limit at its upper end. When liquid concentration is measured with a mass sensor, the sensor's response remains the same once the concentration goes beyond the saturation limit. The lower end of the dynamic range is limited by the mass detection resolution of the sensor. Before the mass detection resolution is discussed, the minimum detectable relative resonant frequency change L must be introduced: | (11) |
The minimum detectable relative resonant frequency change L is influenced by multiple factors, including resonator quality factor, coating material properties and thickness, coating material and analyte interactions, ambient environment conditions, system noise in measurement equipment or circuits, etc. The L can also be calculated in terms of measured Q factor and minimum detectable phase shift of impedance (ΔΦmin) as follows.
 | (12) |
Mass detection resolution R is related to mass sensitivity (S) and minimum detectable relative frequency change (L) by
 | (13) |
| MDM = R·A | (14) |
MDM represents the minimum mass change that can be detected by the entire mass sensor. It should not be confused with the minimum detectable mass per unit area. The term MDM is preferable when referring to mass sensors with extremely small size, such as micro and nano cantilevers. Typical published values of mass sensitivity and mass detection resolution of thin film bulk resonator sensors with four acoustic modes as well as QCM are summarized in Table 1.
| Mode | Thickness Extensional (TE) | Thickness Shear (TS) | Lateral Extensional (LE) | Flexural (Flex.) | QCM (TSM)10,60,86,87 |
|---|---|---|---|---|---|
| f 0 (MHz) | 8000,72 1040,40 650,35 390064 | 790,601160, 230,26 310018 | 60,43 160,53 50,45 0.06562 | 0.03,47 0.21,88 0.4,89 1.2,51 3.3,62 0.3462 | 5 ∼ 60 |

|

|

|

|

|
|
S
m (cm2 g−1)  |
9000 (8 GHz),33 3750 (8 GHz),72 726 (1 GHz)42 217000 (local, 2 GHz)70 | ∼1000 (790 MHz)60 365 (900 MHz)14 1150 (1160 MHz)58 | ∼100 (60 MHz),43 700 (160 MHz),53 622 (450 MHz)45 | 650 (210 kHz),88 165 (89 kHz),61 3000 (3.3 MHz),62 400 (340 kHz),62 | 14–54 |
| Q in air | 330,49 500–600,35 620,72 2000,30 | 285,60 408,24 310,58 | 1400,43,46 30053 | 65,90 677,62 808,79 2500 (2nd, 10kPa)79 | 20![[thin space (1/6-em)]](https://www.rsc.org/images/entities/char_2009.gif) 000–50 000–50![[thin space (1/6-em)]](https://www.rsc.org/images/entities/char_2009.gif) 000 000 |
| Q in water | 12,40 40 (2nd),42 130,54 18953 | 156,60 215,24 150,58 230 (2nd),82 | 64,43 189,53 7076 | 2590 | 2000–10![[thin space (1/6-em)]](https://www.rsc.org/images/entities/char_2009.gif) 000 000 |
| R in air (ng cm−2) | 1,34,42 | About half of that measured in water | 0.05,46 143 | ∼0.451 | 0.5–5 ng cm−2 |
| R in water (ng cm−2) | 4,42 10,42 0.3754 | 0.3,58 0.3,26 1,75 2.360 | ∼4,43 1.78,53 | ∼547 | 0.7–5 ng cm−2 |
5. Vapor sensing with TE, LE and Flex. mode resonators
This section describes piezoelectric MEMS resonant devices that have been applied successfully as vapor sensors. Table 2 provides a summary of these sensors, and their respective materials and detection limits.| Analyte | Minimum detected | Device layer | Ref. | Mode |
|---|---|---|---|---|
| silane (vapor) | 100 ng | AlN/SiN | 31 | TE |
| Acetone (vapor) | 1 pg (900 μm2) | AlN/SiO2 | 33 | |
| Methanol (vapor) | ∼1.6 pg (400 × 400 μm2) | AlN – Carboxylic acid-terminated thiol | 34 | |
| Isopropanol (vapor) | ∼0.5 pg (5000/μm2) | AlN/SiN | 32 | |
| H2/CO/Ethanol (vapor) | 2/40/500 (ppm) | AlN/Si3N4 – Pd/CoTTP/CoTTP | 29 | |
| Tobacco smoke (vapor) | 1 pg, 18 μg m−3 | AlN/Al | 30 | |
| Acetone/Ethylacetate (vapor) | 12/17.3 (kHz/ppm) | AlN/Si3N4 – SWCNT | 38 | |
| TNT, RDX (vapor) | 8 ppb/6 ppt | ZnO/Au – antibody | 35,36 | |
| DMMP (vapor) | 100 ppb | AlN/Au – 11-MUA, Cu2+ | 37 | |
| 11- MUA (in solution) | 2 pg (measured in air) | AlN/SiO2/PMMA | 33 | |
| Na+ (solution) | 0.1 μM | ZnO/SiN/TiO2 | 40 | |
| Hg2+ (solution) | 1 ppb | SU-8 probe/ZnO/SiN/Au | 42 | |
| Hg2+ (solution) | 1 nM or 0.2 ppb | ZnO/SiN/Au | 39 | |
| DMMP (vapor) | 1.8 kHz pg−1 | AlN/SiO2 – SWCNT | 44 | LE |
| DNT (vapor) | 1.5 ppb, and 15 ppt (MDM) | AlN – SWCNT, ssDNA | 45,46 | |
| Isopropanol (vapor) | 73 fg (500 μm2) | ZnO – Parylene | 43 | |
| Ethanol (vapor) | N.A. | ZnO – Novolac | 47 | Flex. |
5.1 TE mode resonator sensing
A ZnO-based TE-mode film bulk acoustic resonator (FBAR) has been used to sense relative humidity (RH). At a low RH, the FBAR responds to a water molecule replacing adsorbed oxygen on the ZnO surface, while at a high RH, mass loading effect of the water layer dominates the frequency decrease.28 Benetti et al. tested the feasibility of a TE-mode FBAR for sensing low concentrations of H2, CO, and ethanol with a fast and repeatable response.29 The performances of the sensor were tested using two different chemically interactive membranes: Pd and Co-tetra-phenyl-porphyrin (Co-TPP). The former is a well-known catalyst for H2, while the latter belongs to the family of metal-porphyrins, widely used in solid-state sensor applications.A miniaturized MEMS particulate matter (PM) monitor (weighing 114 g, a volume of approximately 245 cm3, and consuming less than 100 mW) has been designed with a 1.6 GHz FBAR, and shown to perform comparably with other commercial aerosol instruments, as presented in reference 30. Here, a heater was used to deposit particulates (from a sample stream) onto the FBAR surface through thermophoresis. An added mass of 1 pg could be resolved with the FBAR sensor, and the minimum detectable PM was 18 μg m−3.
Various layers have been coated on (or used as) FBAR surface for specific or nonspecific absorption (or adsorption) of different chemical vapors. Bare SiN film has been studied for sensing adsorption of silane and isopropanol vapors. A quasi-monolayer silane was detected to be 100 ng on surface area of 200 × 200 μm2,31 and minimum detectable mass for isopropanol vapor was calculated to be about 0.5 pg on a 50000 μm2 surface.32 A 20 nm thick uncured polymer layer has been used for sensing acetone in the vapor phase. The porous property of the polymer allowed less than 1 pg of absorbed acetone vapor on a surface area of 900 μm2.33Carboxylic acid-terminated thiol layers were shown to have greater affinity to methanol vapor than PMMA layers or fluorinated thiolate layers, and the minimum detectable mass of methanol gas was calculated to be about 1.6 pg.34
Recently, specific coatings have been studied for selective absorption of vapor traces of explosives or nerve gas. For example, vapor traces of TNT and RDX explosives were detected with antibody-coated FBAR sensors without a pre-concentrator at room temperature. The detection threshold was measured to be as low as 8 ppb for TNT and 6 ppt for RDX. The antibodies of TNT and RDX were immobilized onto the Au surface through Protein A, which helps to form a polarized bond between the Au surface and antibody. The bond makes the antibodies properly oriented for antigen–antibody binding.35 One year later, Lin et al. presented experimental results on selectivity and long-term reliability of the antibody-coated resonant mass sensors.36 The anti-TNT coated FBAR sensor was shown to produce a permanent frequency shift in response to TNT only among many other vapors such as perfume, acetone, methanol or isopropyl. The lifetime of anti-TNT coated on a gold surface was reported to be functionally good up to 30 days at room temperature. In addition, 100 ppb of dimethyl methylphosphonate (DMMP) vapor, used in the synthesis of nerve gas, has been detected by an AlN-based FBAR, the surface of which is coated with bilayer of Cu2+ and 11-mercaptoundecanoic acid (MUA).37
Single-walled carbon nanotubes (SWCNT) also hold promise for gas/vapor-detection at room temperature due to their high surface area to volume ratio and nano-sized characteristics. When TE-mode FBAR sensors are coated with ten-monolayer 75-wt.% Langmuir–Blodgett (LB) nanocomposite film (28 nm) of SWCNTs, they exhibit high sensitivity (e.g., 12 kHz per ppm of acetone, 17.3 kHz per ppm of ethylacetate), fast response (< 2–3 min), slow reversibility (about 1 h), and good repeatability (≤5% variation) of response toward tested organic vapors of acetone, ethylacetate, and toluene.38Fig. 4 shows the time response of various acetone vapor concentrations for a SWCNT-coated FBAR.
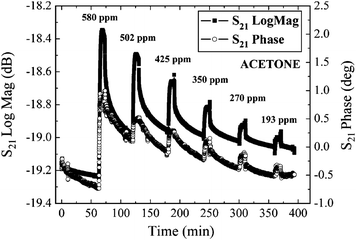 | ||
| Fig. 4 Fast and reversible time response of a typical FBAR coated with a ten-monolayer 75-wt.% SWCNT-based LB nano-composite film toward six different concentrations of acetone by measuring the S21 amplitude and phase at room temperature.38Reproduction of the figure has been made with permission from the Institute of Electrical and Electronics Engineers. | ||
The affinity of the Au surface and TiO2 layer to positive metal ions in solution has been detected by a back-etched TE-mode FBAR sensor (Fig. 5).39 Coated with a thin layer of Au on SiN, the sensor was tested for specific detection of Hg2+ in concentrations from 2 ppm to 0.2 ppb. The frequency shift was measured to be about 100 kHz for 10−5 M Hg2+, but nearly zero for 10−4 M Na+, K+, Mg2+, and Zn2+, proving the Au layer was selective to Hg2+ over other metal ions (Fig. 6). An FBAR coated with TiO2 was shown to have high affinity to Na+ (and also was sensitive to PH variation), because O− on TiO2 surface electrostatically interact with positive metal ions.40
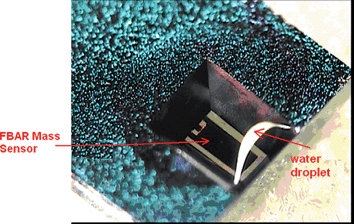 | ||
| Fig. 5 Photo of the membrane type FBAR sensor with its back side in direct contact with a water droplet, in which chemical or bio particles could be contained and detected by measuring the impedance of the FBAR.52Reproduction of the figure has been made with permission from the Institute of Electrical and Electronics Engineers. | ||
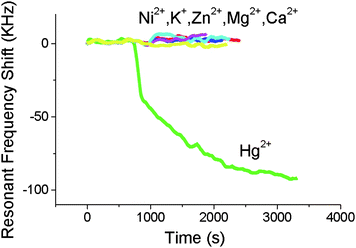 | ||
| Fig. 6 The effect of various metal ions on the resonant frequency of the FBAR coated with Au. The FBAR resonant frequency changes more than 100 kHz for 10−5 M Hg2+ while none of the other cations (all with a concentration of 10−4 M) can produce any significant frequency shift, indicating that the FBAR sensor could exhibit a high selectivity towards mercury ions over other challenging ions in water.39Reproduction of the figure has been made with permission from the Institute of Electrical and Electronics Engineers. | ||
Similar to micromachined probes integrated with microelectrodes for recording neural signals,41 Zhang et al. fabricated an FBAR mass sensor at the tip of a micromachined SU-8 probe (Fig. 7).42 The miniature size of an FBAR sensor is ideal for its integration with a microprobe, which in return acts as a solid carrier for the sensor and provides the sensor with easy access to the external signal processing circuits. The probe shank was about 1.5 mm long, 250 μm wide, and 15 μm thick, showing excellent structural flexibility and sturdiness. The FBAR sensor on the probe was successfully used to detect Hg2+ in liquids as low as 1 ppb, showing great potential for insertion into a fish to detect mercury levels.
 | ||
| Fig. 7 SEM pictures of a micromachined SU-8 microprobe on wafer.42Reproduction of the figures has been made with permission from the Institute of Electrical and Electronics Engineers. | ||
5.2 LE mode resonator sensing
LE mode piezoelectric resonators have also been the focus of several studies, and have shown comparable performance with TE-mode based sensors. Detection of isopropanol vapor has been demonstrated on the sidewalls of a parylene-coated LE mode resonator. A minimum detectable frequency shift of ∼1.6 ppm was observed due to the absorption of 73 fg isopropanol vapor.43An AlN contour mode MEMS resonator coated with SWCNTs has also been reported to be able to detect different concentrations of DMMP, with a measured sensitivity as high as 2.65 kHz pg−1.44 In another experiment, single-stranded DNAs were decorated onto SWCNTs to overcome the non-selectivity problem of bare SWCNTs and to enhance the adsorption of volatile organic compounds such as DNT (a stimulant for explosive vapors) and DMMP.45 An oscillator based on the resonator was also developed to read out the frequency shift. The oscillator exhibited an Allan Variance of ∼20 Hz, resulting in an estimated sensor resolution of 0.05 ng cm−2. The excellent resolution of the device allowed for a minimum detected concentration of DNT vapor of 15 ppb, but the minimum detectable value was expected to be as low as 15 ppt.46
5.3 Flexural mode resonator sensing
Adams et al. demonstrated a microcantilever chemical detection platform based on an array of piezoelectric microcantilevers. The power consumption of the sensor array, including the actuation, was measured to be in nanowatts, 4–5 orders of magnitude lower than other cantilever chemical detection platforms based on optical or piezoresistive detection. The platform comprised three cantilevers connected in series, and was shown to be able to detect ethanol vapor.476. Biosensing application
In the last several years, piezoelectric MEMS resonant devices have been increasingly studied as ultrasensitive biosensors. Table 3 summarizes recent achievements.| Analyte (in solution) | Minimum detected | Device layer and functionalization | Ref. | Mode |
|---|---|---|---|---|
| cDNA (with/without mismatch) | Single mismatch sequence | ZnO/Au – ssDNA | 48 | TE |
| cDNA | 60 μg ml−1 | ZnO/Au – thiol-modified ssDNA | 25 | |
| Streptavidin, cDNA | ∼350 pg, ∼120 pg | AlN/Au – Oligo with biotin/ssDNA | 49 | |
| Vroman effect (protein exchange) | Sub 10 ng cm−2 | ZnO/Au, Channel optimized | 54 | |
| Streptavidin | 120 pg | ZnO/Au – Biotin | 56 | |
| Human IgG | 630 pg | ZnO/Au – Antibody | 64 | |
| Mouse/goat anti-IgG | 1 μg ml−1 | ZnO/Au – mouse/goat IgG | 25 | |
| BSA | 1 μg ml−1 | ZnO/Au | 76 | |
| Anti-avidin | 2.3 ng cm−2 | ZnO/Au – Avidin | 60 | TS |
| Streptavidin, biotinated BSA | Single layer | AlN/Au | 57 | |
| Albumin | 1 mg ml−1 | AlN/Au | 58 | |
| Antibody to the synthetic antigen | 2.5 ng | AlN/Au – Synthetic antigen | 13 | |
| Thrombin | ∼1.4 fg (1.78 ng cm−2) | AlN/Au/COOH-SAM, Aptamer | 53 | LE |
| Anti-goat IgG, Anti-HBsAg | 16.1 ng, N.A. | PZT/Au – Goat IgG/HbsAg IgG | 61 | Flex. |
| T-sequence/K20-Thiol/K40-Thiol DNA | 37/11/114 fg (measured in air) | PZT/Au – Anti thiol group | 51 | |
| Prostate-specific antigen (PSA) | < 1 ng ml−1 | PZT/Au–Calix-SAM, PSA antibody | 55 | |
| Human insulin | 0.5 fg | PZT/Au – Anti human insulin | 51 | |
| CRP antigen | 93 ng | PZT/Au–Calix-SAM, CRP antibody | 90 | |
| CRP antigen | 34 pg | PZT/Au–Calix-SAM, CRP antibody | 59 | |
| Myoglobin antigen | 1 ng ml−1 | PZT/Au–streptavidin, Site-directly biotinlated Myoglobin antibody | 56 | |
| Human IgG | 3 fg Hz−1 | Pb(Zr0.52Ti0.48)O3/Au–SAM, Streptavidin | 62 |
6.1 Detection of DNA hybridization
Microsensors capable of detecting DNA sequences are a promising tool for gene sequence analysis, gene profiling and mutation studies, and virus and bacteria detection. The micron size level and the ease of forming an array of large number of microsensors present unprecedented opportunities for clinical diagnostic tools, combinatory drug discovery, counter-bioterrorism technology, etc. A number of biosensors (electrochemical, optical, mechanical, and piezoelectric) developed in recent years for sequence-specific oligonucleotide detection, identification of genetically modified organisms, gene mutation studies, etc. offer label-free detection of DNA sequence, unlike traditional gel electrophoresis.A label-free biosensor based on an air-backed FBAR for detection of DNA sequences was developed by Zhang et al.;48 the illustration of the surface modification and hybridization process is shown in Fig. 8. The FBAR's resonant frequency (about 1 GHz) was shown to shift to a lower value by about 70 kHz when a target complementary single-strand DNA sequence (15 mer long) was hybridized with a DNA probe sequence on an Au-coated FBAR surface. When a single-mismatched sequence was brought to the probe sequence, the resonant frequency shift was 35% (∼25 kHz) of that (∼70 kHz) obtained with the complementary sequence (Fig. 9), indicating the sensor was capable of distinguishing the complementary DNA from a single-nucleotide mismatch DNA sequence. The feasibility of detecting DNA hybridization has also been demonstrated with a 2 GHz solid-mounted FBAR employing a Bragg acoustic mirror on top of a silicon substrate.49 The 100 nm thick gold top electrode was used for immobilization of DNA oligos that were thiol-coupled to the gold electrode using on-wafer dispensing.
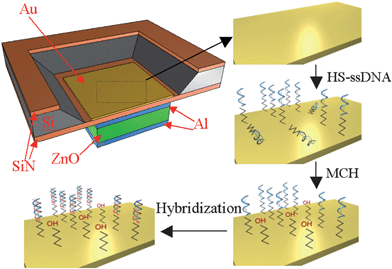 | ||
| Fig. 8 Illustration of FBAR device being treated with HS-ssDNA and MCH for mixed monolayer formation and then hybridized with a target DNA sequence. The resonant frequency of the HS-DNA immobilized FBAR decreases when hybridized with the target DNA complement.48Reproduction of the figures has been made with permission from the Institute of Electrical and Electronics Engineers. | ||
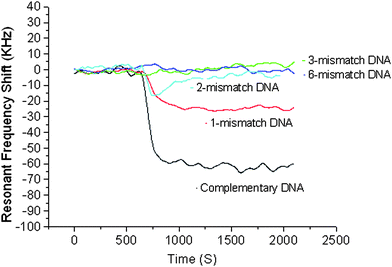 | ||
| Fig. 9 The resonant frequency shift of the FBAR on whose surface is immobilized with DNA. With the single-mismatch sequence, the resonant frequency shift was 35% (∼25 kHz) of that (∼70 kHz) obtained with the complementary sequence, while no noticeable resonance shift was observed with two or more mismatches, indicating the capability of distinguishing the c-DNA from a single-mismatch sequence with the FBAR sensor.48Reproduction of the figure has been made with permission from the Institute of Electrical and Electronics Engineers. | ||
Nirschl et al. reported investigations on the use of TS-mode FBAR array for a label-free, multiplexed detection of DNA with 25 mer long ssDNA immobilized on sensor surfaces.25 In order to demonstrate that the sensors can be stored between the immobilization of the probe DNA and the hybridization measurement without losing their functionality, the functionalized sensors were stored at 4 °C for several days. Then a 0.5 mg ml−1 BSA solution and 60 μg ml−1 complementary DNA were brought to the sensor surface in that order. The frequency shifts caused by non-specific binding of the BSA and the hybridized cDNA were 113 kHz and 171 kHz, respectively.
The main advantages of FBARs for DNA sensing are that they offer label-free, real-time detection as well as their micron size. Moreover, FBARs can easily be made into an array for combinatory detection of gene expression without expensive optical scanning or imaging. Recently, Nirschl et al. demonstrated an array of 64 integrated CMOS oscillator-driven FBAR sensors for multiplexed detection of DNA.50 A portion of such an array is shown in Fig. 10. Here, sensors functionalized with two different ss-DNA probes are interlaced in location on the array, and then exposed to two corresponding complementary DNA sequence analytes in dilute human blood serum (1![[thin space (1/6-em)]](https://www.rsc.org/images/entities/char_2009.gif) :
:![[thin space (1/6-em)]](https://www.rsc.org/images/entities/char_2009.gif) 100). The experiment showed that two different DNA sequences could be detected on a single chip at the same time without considerable non-specific binding from the human blood serum. The CMOS-integrated FBAR, utilizing voltage-controlled oscillators as a simple and efficient way for readout, was measured to have a comparable mass resolution with FBAR and QCM whose frequency is tracked with a network analyzer.
100). The experiment showed that two different DNA sequences could be detected on a single chip at the same time without considerable non-specific binding from the human blood serum. The CMOS-integrated FBAR, utilizing voltage-controlled oscillators as a simple and efficient way for readout, was measured to have a comparable mass resolution with FBAR and QCM whose frequency is tracked with a network analyzer.
 | ||
| Fig. 10 The FBAR array with some of the pixels functionalized. The black squares are drops of liquid containing probes and Lipa-DEA. The squares appearing in white are uncovered gold pixels.50Reproduction of the figure has been made with permission from the Molecular Diversity Preservation International. | ||
A microcantilever driven by PZT thin film was coated with Thiol layer, and used to detect poly T-sequence DNA, K20-Thiol DNA, and K40-Thiol DNA.51 The Thiol-coated cantilever probe was immersed in DNA solution for adsorption, and measured out of the solution (i.e., in air). The calculated mass of the poly T-sequence DNA, K20-Thiol DNA and K40-Thiol DNA were 37, 11, and 114 fg, respectively.
6.2 Protein detection
FBAR sensors have been used to detect various kinds of proteins. This is accomplished by immersing the sensor into protein-containing solutions,52,53 or by integrating a fluid channel above the sensor's surface.13,54,55Fig. 11 shows a ring shaped LE-mode resonator with water droplets that are in contact with the surface. A pre-modified surface with high affinity (specific or nonspecific) to protein enables molecules or layers to accumulate, and the mass loading effect of the accumulated protein causes a decrease of the resonant frequency. Quality factor degradation has been observed for a shear mode FBAR sensor due to the viscoelastic properties of the functional layer and the protein layer itself.26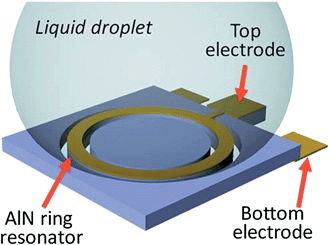 | ||
| Fig. 11 The contour mode FBAR has a suspended circular-shaped AlN ring sandwiched between the top and bottom Au electrodes. A liquid droplet is in direct contact with the top electrode. The AlN ring is excited in its radial directions, in which the vibration displacement is parallel to the resonator/liquid interface. The shear viscous damping, instead of the squeeze damping in LE-mode FBARs, alleviates the acoustic energy loss and consequently results in high Qs.53Reproduction of the figure has been made with permission from the American Institute of Physics. | ||
Streptavidin (SA) protein adsorption according to key-lock principles has been tested on a solid mounted FBAR49 and a membrane type FBAR.56 In both experiments, oligos with biotin groups were previously immobilized on the resonator surfaces, followed by the introduction of SA solution. A schematic of the modification and hybridization process is shown in Fig. 12. The biotin group of the immobilized oligos can form a strong complex with SA. On bare Au surface, OH- monolayer was compared with biotin monolayer in the experiment to prove biotin's specific affinity to SA molecules (Fig. 13). A total of 350 and 120 pg of SA were detected on the solid-mounted FBAR and the membrane type one, with a resolution of 25 and 10 ng cm−2, respectively.
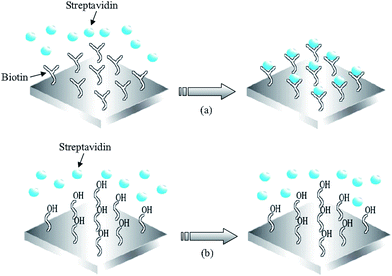 | ||
| Fig. 12 (a) Schematics of streptavidin binding to biotin modified FBAR surface, utilizing the strong receptor-ligand interactions between streptavidin and biotin to specifically catch streptavidin in solution; (b) The 11-mercapto-1-undecanol modified surface prevents interact of streptavidin with the Au-surface of the FBAR device.56Reproduction of the figures has been made with permission from the American Institute of Physics. | ||
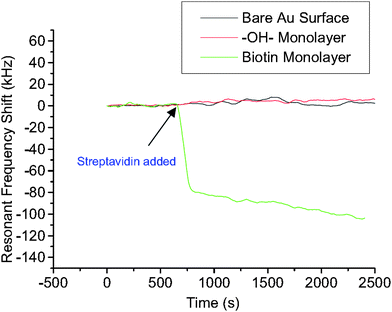 | ||
| Fig. 13 Comparison of resonant frequency shifts of three FBAR devices when exposed to streptavidin solution (5 × 10⁻⁷ M): the biotin immobilized (5 × 10⁻⁴ M EZ-Link™ biotin-HPDP, 24 h treatment) device showed significant resonant frequency drop (∼100 kHz), while with the 11-mercapto-1-undecanol coated device no noticeable shift was observed. Also the bare Au-coated device showed only a slight shift over a long period of time, probably due to nonspecific protein absorption on the gold surface.56Reproduction of the figure has been made with permission from the American Institute of Physics. | ||
In FBAR, where the frequency of operations is about 100 times higher than QCM, the viscous properties of the various layers and media are expected to have much higher influence on the sensing performance, even if the elastic modulus and viscosity are assumed to be frequency independent. Also, the detection distance in the thickness direction is expected to be shorter with FBAR than QCM. Thus, one needs to consider the limitations stemming from the higher frequency and shorter detection distance. This concept has been studied for shear mode FBAR sensors in combination with viscoelastic protein films in viscous media by alternating injections of SA and bt-BSA and cross-linking (stepwise) fibrinogen with EDC/NHS activation of carboxyl groups.57 A reversed (positive) frequency shift occurs when approximately 20 SA/bt-BSA layers (about 100–200 nm thick) are absorbed onto the sensor surface (Fig. 14). The resonant frequency becomes almost insensitive to film thickness at around 40 SA/bt-BSA layers, well beyond the number of protein layers usually used in biosensor applications. The same sensor has been used to detect albumin solution in three different concentrations, and a detecting saturation of 4 mg ml−1 has been observed.58 Since BSA is smaller than typical antibodies, it has also been used in several antibody-antigen related experiments to fill the gaps between the antibody molecules for immunosensors and to prevent nonspecific binding of antigen on the transducer surface in subsequent processes, with its concentration being 10 mg ml−1 in 55, 1 mg ml−1 in 59 and 60 and 0.5 mg ml−1 in 25.
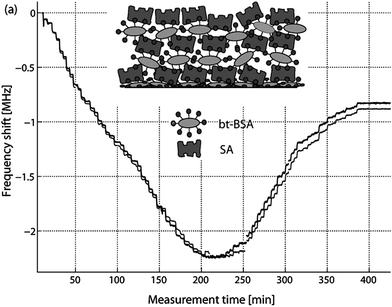 | ||
| Fig. 14 Measured frequency shift during stepwise injection of alternating strepavidin (SA) and biotinated BSA (bt-BSA) to an 800 MHz TS-mode FBAR. A reverse frequency shift was observed at around 20 SA/bt-BSA layers, and the frequency became insensitive at around 40 SA/bt-BSA layers. The two curves in the figure correspond to the series resonance (grey) and the parallel resonance (dark grey). A similar experiment was also repeated with 1.0 and 1.2 GHz FBAR sensors with thinner AlN, which showed the reverse frequency shift to occur at less number of layers with increasing frequency.57Reproduction of the figure has been made with permission from Elsevier. | ||
Recrystallization of the bacterial surface-layer protein (S-layer) B. sphaericus NCTC 9602 has been studied in 25, including the kinetics of S-layer monomer adsorption (from the solution) and its recrystallization at the sensor surface (Fig. 15). A rigorous quantitative analysis of measured frequency shifts of FBAR revealed that the initial time dependence of the S-layer adsorption and recrystallization was dominated by at least two different processes; the first is associated with monomer adsorption at the bare resonator surface, and the second corresponds to monomer deposition on S-layer patches already formed at the surface.
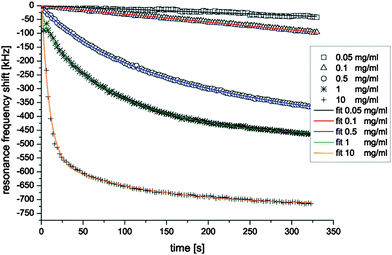 | ||
| Fig. 15 FBAR frequency shifts during the first 325 s of adsorption and recrystallization of S-layer monomers of Bacillus sphaericus NCTC 9602 into 2D protein layers at the gold surface of a FBAR at concentrations ranging from 0.05 to 10 mg ml−1. The different symbols are measured data; the solid lines are curves obtained by fitting the experimental data with exponential function. A good agreement between the measured data and the fit functions reveals that the initial time dependence of the S-layer adsorption and recrystallization could be fitted by a sum of at least two exponential functions.25Reproduction of the figure has been made with permission from Elsevier. | ||
The Vroman effect, the process of a competitive adsorption and exchange of proteins on a given surface, has been confirmed54 through mass detection by a TE mode FBAR sensor with optimized channel height. A high molecular weight protein, IgG (150 kDa), first displaces the former surface layer of a low molecular weight protein, albumin (67 kDa), and then the IgG itself is replaced by fibrinogen (340 kDa), an even higher weight protein. Displacement by a lighter protein was not observed. With a mass resolution as low as 0.37 ng cm−2, the TE mode FBAR was able to detect mass deposition of 510 and 810 ng cm−2 of albumin and fibrinogen in solution, respectively.
6.3 Immunosensors
PZT-based thin film resonant sensors have been fabricated for detecting various antibody-antigen reactions. Most of these types of sensors utilize a cantilever or membrane that flexurally vibrates at kHz. Xu et al. fabricated a membrane-based sensor array using goat IgG and HBsAg as the probe molecules, which were immobilized on square piezoelectric membranes to detect goat anti-IgG and anti-HBsAg,61 and obtained a nearly linear relationship between the frequency change and the antibody concentration below 40 μg cm−2. A micromachined PZT unimorph cantilever with an evaporated 30/150 nm thick Cr/Au layer was also used as a sensor for protein–protein interaction measurements.59 Over the Cr/Au, C-reactive protein (CRP) antibody was immobilized on Calix crown SAMs, which have a special property of recognizing ammonium ions in proteins, consequently, allowing the proteins such as antibodies to immobilize on its surface. The CRP binding in this experiment causes a frequency shift two orders of magnitude larger than that theoretically calculated if only mass loading effect is considered, and is thought to produce a compressive stress on the cantilever surface. The same cantilever was also reported for label-free detection of a prostate-specific antigen (PSA) in a liquid environment. The specific binding of a PSA antigen–antibody was confirmed by using a high concentration BSA solution as a surface blocker and fluorescence imager. In the early stage of the PSA antigen–antibody interaction, the resonant frequency of the cantilever changed drastically, possibly due to the binding kinetics of the Langmuir isotherm effect and diffusion, and also by the effects of a small volume reaction chamber.55Human insulin binding to immobilized human anti-insulin has also been measured using a microcantilever driven by a PZT film. A frequency shift of 217 Hz was measured, and is thought to be due to 0.45 fg, according to the sensing model of the resonant cantilever.51 In another study, a multi-sized piezoelectric microcantilever array demonstrated the capability of allowing for dynamic and simultaneous analysis of adsorption-induced mass and surface stress. With human IgG antibody molecules immobilized on the cantilever surface, this sensor platform was shown to be able to provide simultaneous and quantitative information about the physical properties of biomolecules.62
Kang et al. significantly improved the limit for detecting label-free myoglobin using site-directed immobilization on the surface of a self-actuating PZT cantilever sensor.63 The site-directed antibody was biotinylated after the binding region of randomly biotinylated antibody was reduced to hinge region to increase the number of effective binding sites, and the sensitivity was enhanced about 10 times. This biosensor can be used for diagnosing acute myocardial infarction at the clinical level of ng ml−1.
An FBAR sensor based on the TE or TS mode typically operates at GHz, and has minimum detectable mass comparable to that of a flexural mode resonant sensor. A ZnO-based FBAR sensor has been demonstrated for multiplexed detection of the antibody–antigen interactions in reference 25. Specific binding is observed only between goat IgG and goat anti-IgG, or between mouse IgG and mouse anti-IgG, without cross interaction among them (Fig. 16). The results show the possibility of detecting two different analytes using two distinguished functionalizations on one sensor chip in a single flow cell. Xu et al. characterized ring-shaped contour mode FBAR with an aptamer, a thrombin binding pair for a biosensor, and showed mass resolution of 1.78 ng cm−2 and minimum detectable mass of as little as 200 fg of thrombin.53 With improved noise floor as a result of optimizing the channel height, the ultimate minimum detectable mass was calculated by us to be as small as 1.4 fg in a liquid environment.
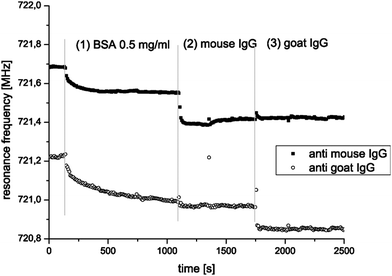 | ||
| Fig. 16 Parallel monitoring of two FBAR pixels; one with immobilized mouse anti-IgG, the other with immobilized goat anti-IgG. The sensors are rinsed with BSA first, then with mouse IgG and finally with goat IgG. It can be seen that BSA adsorbs on both pixels (1), mouse IgG binds only at the sensor functionalized with mouse anti-IgG (2), and goat IgG binds only on the pixels functionalized with goat anti-IgG (3).25Reproduction of the figure has been made with permission from Elsevier. | ||
A competitive antibody–antigen association process has been described in another study that compares the shear mode FBAR and QCM for drug molecule detection for substances such as cocaine and heroin.13 For an avidin/anti-avidin system, the mass resolution of the shear mode FBAR is shown to be better than that of a QCM system in liquid.60 The general rule—namely, a higher resonant frequency gives a higher sensitivity—was confirmed in reference 64, where interactions between human IgG and human anti-IgG with a solid-mounted FBAR sensor were detected.
7. Opportunities for improved sensors
7.1 Sensitivity improvements
For a resonant mass sensor, its sensitivity is known to be inversely proportional to its mass or the length of the wave propagation path, thus approximately proportional to the operating resonant frequency. This relationship is confirmed in reference 33, where mass sensitivity of a 8 GHz TE-mode SMR with multiple layers of Al (100 nm)/AlN (300 nm)/Pt (100 nm) was calculated to be 9000 cm2 g−1 by the Nowotny and Benes model. This was further confirmed by results in another study, which showed measurements about one order of magnitude higher than the sensitivity (726 cm2 g−1) of a 1 GHz FBAR with an Al/ZnO/Al/SiN (200 nm/2000 nm/200 nm/200 nm) structure.52Sensitivity was also found to increase when a low acoustic impedance electrode layer was introduced. The resonator with a low impedance electrode layer has higher sensitivity than one with a bare piezoelectric layer alone. For example, when the thickness of the Al electrodes is almost one fourth of the total resonator thickness, the composite resonator has about two times higher sensitivity than the bare FBAR without electrodes.26 In reference 33, TE-mode sensor sensitivity was simulated to increase from approximately 9000 cm2 g−1 to 11000 cm2 g−1 when the Al (100 nm) top electrode was replaced with SiO2 (20 nm) on Al (80 nm) due to the relatively low acoustic impedance of the SiO2 material. In another experiment, the sensitivity is shown to degrade nearly three times when the 100 nm Al top electrode is replaced with a 60 nm platinum electrode which has high acoustic impedance. A similar phenomenon was also observed in reference 65, where a high impedance Au layer is used as the electrode.
If an FBAR is composed of a significant amount of non-symmetric non-piezoelectric layers (e.g., metals and dielectrics), the mass sensitivity of a TE-mode sensor is found to behave in a more complicated way, though the trend correlates well with stress and displacement distributions within a composite structure.66 For a four-layer structure FBAR (Mo/AlN/Mo/SiO2) operating at the fundamental mode, the sensitivity is improved from 10![[thin space (1/6-em)]](https://www.rsc.org/images/entities/char_2009.gif) 000 cm2 g−1 to 40
000 cm2 g−1 to 40![[thin space (1/6-em)]](https://www.rsc.org/images/entities/char_2009.gif) 000 cm2 g−1, as the thickness ratio of SiO2 to AlN increases from 0.1 to 0.9. However, in the second harmonic mode case, as the ratio of SiO2 to AlN increases, the sensitivity decreases rapidly at first and then recovers partially.
000 cm2 g−1, as the thickness ratio of SiO2 to AlN increases from 0.1 to 0.9. However, in the second harmonic mode case, as the ratio of SiO2 to AlN increases, the sensitivity decreases rapidly at first and then recovers partially.
Higher harmonics of a longitudinal mode have been studied for improving sensitivity and for minimizing the cross sensitivity between mass and temperature. In reference 67, the odd harmonics (from the fundamental to the 7th) of a symmetric FBAR were measured to show a monotonic increase in mass sensitivity as the harmonic increases; the temperature sensitivity, however, remained nearly unchanged.
Localized mass loading (rather than mass loading over the whole sensor surface) has been studied by Campanella et al.68–70 who varied thickness, area and location of a small mass that was added to a limited area of the sensor surface. Since the mass sensitivity is usually proportional to the square of the radial displacement,71 the highest sensitivity is therefore located at the center of the resonator. As only a very small fraction of the overall electrode area is loaded, the sensor measures absolute mass (not mass per unit area), compared to the uniform-mass-addition case shown in reference 68. Mass sensitivity is also higher with smaller amounts of absolute applied mass. This discovery could be used to detect localized particles and allows the application of FBAR as a biological mass sensor where selective spatial detection is required. More importantly, it predicts the minimum detectable mass of FBAR within the attogram range and its potential capability of detecting mass changes in single proteins or DNA molecules. In reference 69, the authors confirmed the dependence of the FBAR sensitivity of localized-mass on both the location and size of the mass by finite-element-modeling (FEM) analysis.
7.2 Quality (Q) factor improvements
In general, Q of an acoustic resonator is set by many different damping mechanisms such as anchor loss, thermo-elastic damping, phonon–phonon interactions, intrinsic material defects and viscous damping. In the case of FBAR, the Qs at the parallel resonance (Qp) and at the series resonance (Qs) are found to increase and decrease, respectively, with increasing lateral size of the resonator.72 Viscous damping is mainly responsible for Qreduction of FBAR in liquid, and can be simulated with the BVD model by adding resistance and inductance in the motional arm.52 A degradation of quality factor by an order of magnitude or more has been observed for TE-mode FBAR in liquid,32,40,43,52,73 due to strong coupling of longitudinal-mode wave to water which results in great energy loss through compression damping.31 For GHz TE-mode FBAR, the second harmonic operation with its frequency about twice that of fundamental resonance was found to have a Q value of about 40 in liquid,39,49 though the fundamental mode has a Q of only 12 in liquid.40 The Q improvement translated into an improvement of minimum detectable mass from 10 to 4 ng cm−2 when the GHz FBAR was operated at the second harmonic frequency, rather than the fundamental.When the height of liquid over FBAR surface is on the order of the acoustic wavelength (i.e., micron range), the Q was simulated to vary periodically as the liquid height was monotonically increased, peaking when the height was equal to an odd integer multiple of the quarter wavelength.54 With the liquid height comparable to that of the FBAR thickness, Q values of 35–40 (at 2.2GHz), 65–120 (at 1.05GHz), 85–110 (at 600 MHz) were measured in liquid.
Since shear mode wave is known to couple less to liquid than a longitudinal mode wave, the Q would degrade in liquid much less with shear wave than longitudinal wave.14,24,26,58,60,65,74 With a shear mode FBAR operating at around 1 GHz, a Q of 150–230 in liquid (285–408 in air) has been reported. This is much better than 10–40 for TE-mode FBAR,31,32,73 and with a shear mode FBAR, a mass resolution as low as 1 ng cm−2 for in-liquid detection has been reported.75 The best first shear mode FBAR reported so far is a TS-mode FBAR that was measured to have a Q of 215 in water.24 A TS-mode FBAR was fabricated with the c-axis (of the piezoelectric film) tilt as large as 30°,26 in order to obtain a high Q value suitable for sensing in both water and 75% glycerol sensing environments. When an SiO2 layer is added to a TS-mode FBAR, the Q and the mass sensitivity at the fundamental resonant frequency were found to increase and decrease, respectively, as the thickness of SiO2 increases, indicating a tradeoff between the Q factor and the sensitivity.58 A second harmonic operation has about half the mass sensitivity of what can be obtained with a fundamental operation for a non-composite (i.e., metal/piezo/metal/support-layer) FBAR, but has about a third of the dissipation at a fundamental operation in liquid, resulting in an overall gain in mass resolution.65 It is also shown that both the mass sensitivity and Q of the second harmonic mode are rather insensitive towards small variations in the SiO2 thickness rendering such devices suitable for mass fabrication.
A lateral extensional (LE) mode FBAR43 has a lower level of fluid–solid interaction than a TE mode FBAR or a flexural mode cantilever. Measured Q values for the fundamental LE mode in various liquids ranging from air to a Newtonian fluid of 300 cP viscosity are higher than those of flexural modes and are comparable to those of the shear modes.76 Thickness-field-excited contour mode FBARs have been reported to have a relatively high Q in liquid. In case of contour mode FBAR, the top surface, rather than the sidewalls (used by LE mode FBAR), acts as the sensing surface, and is in contact with liquid.44,46,53,77
In case of flexurally vibrating piezoelectric resonators, viscous damping from the surrounding environment is a dominant factor responsible for Qdegradation at atmospheric pressure or in liquid. Under a reduced ambient pressure (i.e., not under liquid), energy dissipation within the vibrating structure and/or to the substrate through anchor(s) becomes more dominant than the viscous damping.78 The Q of a flexurally vibrating structure is ultimately limited by thermoelastic damping, when the viscous damping and the anchor loss are reduced to a negligible level. If the Q is dominated by the loss in the vibrating structure, the Q has been shown to markedly improve by partially, other than fully covering the cantilever with a piezoelectric film. Also, a high-mode vibration and/or reduced size of both the PZT film and cantilever has been shown to be effective in improving the Q.79
7.3 Reducing temperature induced effect
As temperature also affects the resonant frequency, a temperature-compensating technique may be needed for some applications. Passive temperature compensation with SiO2 that has a unique positive temperature coefficient of frequency unlike many other materials has been shown to effectively compensate the negative temperature coefficient of frequency of conventional FBAR to minimize the frequency drift or fluctuation as a function of temperature.80 An FBAR with SiO2 compensation was shown to have less than 80 ppm frequency drift over a 120 °C temperature range.81 Effects of SiO2 layer on modes separation (into TE and TS modes), effective electromechanical coefficient, and temperature compensation have been simulated for both 1st and 2nd harmonic of TE mode and TS mode.82 Second harmonic operation offers tradeoffs between temperature compensation and electromechanical coupling and between frequency of operation and quality factor.With a FBAR based voltage controlled oscillator (VCO) that has a large tunability (−4305 ppm V−1), the frequency of the oscillator was kept within l ppm K−1 over a 5 °C range by applying a control voltage to the VCO as a function of temperature.83 Digitally switched capacitors were used to obtain a temperature-compensated 1.5 GHz FBAR with ±10 ppm frequency drift over a 0 to 100 °C temperature range.84
Interestingly, a lateral-field-excited shear mode FBAR was reported to show a positive thermal coefficient of resonant frequency.85 It is conceivable that the shear wave velocity increases as temperature rises, given that the lateral thermal expansion of ZnO is significantly greater than the thickness-directed thermal expansion, and may result in an increase in the apparent stiffness tensor pertaining to the shear coupling (c44) with increasing temperature.
Temperature may influence the sensor performance indirectly, as temperature affects fluid properties such as viscosity.24 The temperature effect on the FBAR, though, can readily be measured and subtracted from the effects due to the fluid under study.
8. Conclusions and perspectives
Piezoelectric MEMS mass sensors have already proven to be efficient tools for accurate sensing of chemical vapors and biomolecules in gaseous or aqueous environments. The versatility of these sensors is limited only by the surface chemistries or functionalization techniques that selectively bind analytes of interest. Although initial applications of these resonant sensors focus on the use of the Sauerbrey equation, the frequency shifts have been observed to be affected by several interferences, resulting in considerable deviations from what the Sauerbrey equation predicts. Potential applications such as quantification of cell adhesion and determination of viscoelastic properties of adherent cells may require taking advantage of physical principles that underlie these deviations and allow piezoelectric MEMS sensors to become a more versatile tool—one that can sense a number of material-specific parameters of immobilized layers (e.g., DNA, proteins or cells) such as their elastic moduli, surface charge densities, and viscosities. The power of piezoelectric MEMS resonant sensors is the vast quantity of available information that can be obtained, as well as the reliable determination of thermodynamic and kinetic data.Piezoelectric MEMS resonators are particularly well suited for use with simple electronic setups, as they feature low insertion losses and sharp resonance frequencies. The latter is of great importance for the insertion of such devices into oscillator circuits. Many piezoelectric MEMS resonators (e.g., FBAR) are already mass produced with batch silicon micromachining techniques based on integrated circuit (IC) process technology. As the resonator and its associated electronics can be realized with standard industrial processes, a small scale, label-free biosensor system could feature a large number of single sensor devices formed into a cost-effective sensor array which can be read out in real time and in parallel, and eventually have a significant impact on medicine, proteomics, and many other fields.
For practical applications, long term stability and reproducibility are additional factors that have not been well characterized for the resonant sensors. While significant progress has been made towards resonant biosensing in liquids, the mass resolution of piezoelectric MEMS resonant sensor is poorer than that of optical methods like SPR, since the quality factor of the resonator in liquid is reduced by viscous damping and still relatively low. The quality factor may be improved as techniques to control and constrain the propagation of acoustic energy are developed through appropriate designs of the boundary conditions and geometry.
References
- M. M. Elrick, J. L. Walgren, M. D. Mitchell and D. C. Thompson, Proteomics: Recent applications and new technologies, Basic Clin. Pharmacol. Toxicol., 2006, 98, 432–441 CrossRef CAS.
- Y. S. Sun, J. P. Landry, Y. Y. Fei and X. D. Zhu, Effect of Fluorescently Labeling Protein Probes on Kinetics of Protein–Ligand Reactions, Langmuir, 2008, 24, 13399–13405 CrossRef CAS.
- N. Ramachandran, D. N. Larson, P. R. H. Stark, E. Hainsworth and J. LaBaer, Emerging tools for real-time label-free detection of interactions on functional protein microarrays, FEBS J., 2005, 272, 5412–5425 CrossRef CAS.
- J. Homola, S. S. Yee and G. Gauglitz, Surface plasmon resonance sensors: review, Sens. Actuators, B, 1999, 54, 3–15 CrossRef.
- B. Cunningham, P. Li, B. Lin and J. Pepper, Colorimetric resonant reflection as a direct biochemical assay technique, Sens. Actuators, B, 2002, 81, 316–328 CrossRef.
- F. Vollmer and S. Arnold, Whispering-gallery-mode biosensing: label-free detection down to single molecules, Nat. Methods, 2008, 5, 591–596 CrossRef CAS.
- Y. Cui, Q. Wei, H. Park and C. M. Lieber, Nanowire Nanosensors for Highly Sensitive and Selective Detection of Biological and Chemical Species, Science, 2001, 293, 1289–1292 CrossRef CAS.
- B. L. Allen, P. D. Kichambare and A. Star, Carbon nanotube field-effect-transistor-based biosensors, Adv. Mater., 2007, 19, 1439–1451 CrossRef CAS.
- C. Ziegler, Cantilever-based biosensors, Analytical and Bioanalytical Chemistry, 2004, 379, 946–959 CAS.
- C. K. O′Sullivan and G. G. Guilbault, Commercial quartz crystal microbalances - theory and applications, Biosens. Bioelectron., 1999, 14, 663–670 CrossRef.
- G. Sauerbrey, Use of vibrating quartz for thin film weighing and microweighing (in German), Z. Phys., 1959, 155, 206–222 CrossRef CAS.
- S. Meyburg, G. Wrobel, R. Stockmann, J. Moers, S. Ingebrandt and A. Offenhausser, Single cell recordings with pairs of complementary transistors, Appl. Phys. Lett., 2006, 89, 013901 CrossRef.
- G. Wingqvist, J. Bjurstrom, A. C. Hellgren and I. Katardjiev, Immunosensor utilizing a shear mode thin film bulk acoustic sensor, Sens. Actuators, B, 2007, 127, 248–252 CrossRef.
- M. L. Johnston, I. Kymissis and K. L. Shepard, FBAR-CMOS Oscillator Array for Mass-Sensing Applications, IEEE Sens. J., 2010, 1042–1047 CrossRef CAS.
- A. Tsortos, G. Papadakis, K. Mitsakakis, K. A. Melzak and E. Gizeli, Quantitative determination of size and shape of surface-bound DNA using an acoustic wave sensor, Biophys. J., 2008, 94, 2706–2715 CrossRef CAS.
- J. S. Wang and K. M. Lakin, c-axis inclined ZnO piezoelectric shear wave films, Appl. Phys. Lett., 1983, 42, 352–354 CrossRef CAS.
- J. Bjurstrom, G. Wingqvist and I. Katardjiev, Synthesis of textured thin piezoelectric AlN films with a nonzero C-axis mean tilt for the fabrication of shear mode resonators, IEEE Trans. Ultrason. Ferroelectr. Freq. Control, 2006, 53, 2095–2100 CrossRef.
- A. Dickherber, C. D. Corso, W. Hunt, Lateral Field Excitation (LFE) of Thickness Shear Mode (TSM) Acoustic Waves in Thin Film Bulk Acoustic Resonators (FBAR) as a Potential Biosensor, Engineering in Medicine and Biology Society, 2006. EMBS ′06. 28th Annual International Conference of the IEEE, 2006, pp. 4590–4593 Search PubMed.
- C. D. Corso, A. Dickherber, W. D. Hunt, A Thickness Shear Mode Zinc Oxide Liquid Sensor with Off-axis Excitation, Sensors, 2007 IEEE, 2007, pp. 930–933 Search PubMed.
- G. Wingqvist, AlN-based sputter-deposited shear mode thin film bulk acoustic resonator (FBAR) for biosensor applications - A review, Surface and Coatings Technology, 2007, 205, 1279–1286 Search PubMed.
- T. Thundat, E. A. Wachter, S. L. Sharp and R. J. Warmack, Detection of mercury vapor using resonating microcantilevers, Appl. Phys. Lett., 1995, 66, 1695–1697 CrossRef CAS.
- M. S. Weinberg, C. E. Dube, A. Petrovich and A. M. Zapata, Fluid damping in resonant flexural plate wave device, J. Microelectromech. Syst., 2003, 12, 567–576 CrossRef.
- T. P. Burg, M. Godin, S. M. Knudsen, W. Shen, G. Carlson, J. S. Foster, K. Babcock and S. R. Manalis, Weighing of biomolecules, single cells and single nanoparticles in fluid, Nature, 2007, 446, 1066–1069 CrossRef CAS.
- W. Jan, L. Mathias, P. Robert, P. Dana, S. Matthias, High Frequency Viscosity Sensing with FBARs, International Frequency Control Symposium and Exposition, 2006 IEEE, 2006, pp. 117–122 Search PubMed.
- M. Nirschl, A. Bluher, C. Erler, B. Katzschner, I. Vikholm-Lundin, S. Auer, J. Voros, W. Pompe, M. Schreiter and M. Mertig, Film bulk acoustic resonators for DNA and protein detection and investigation of in vitro bacterial S-layer formation, Sens. Actuators, A, 2009, 156, 180–184 CrossRef.
- G. Wingqvist, J. Bjurstrom, L. Liljeholm, V. Yantchev and I. Katardjiev, Shear mode AlN thin film electro-acoustic resonant sensor operation in viscous media, Sens. Actuators, B, 2007, 123, 466–473 CrossRef.
- S. W. Wenzel and R. M. White, Analytic comparison of the sensitivities of bulk-wave, surface-wave, and flexural plate-wave ultrasonic gravimetric sensors, Appl. Phys. Lett., 1989, 54, 1976–1978 CrossRef.
- X. T. Qiu, R. Tang, J. Zhu, J. Oiler, C. J. Yu, Z. Y. Wang and H. Y. Yu, Experiment and theoretical analysis of relative humidity sensor based on film bulk acoustic-wave resonator, Sens. Actuators, B, 2010, 147, 381–384 CrossRef.
- M. Benetti, D. Cannata, F. Di Pietrantonio, V. Foglietti and E. Verona, Microbalance chemical sensor based on thin-film bulk acoustic wave resonators, Appl. Phys. Lett., 2005, 87, 173504 CrossRef.
- J. P. Black, A. Elium, R. M. White, M. G. Apte, L. A. Gundel, R. Cambie, MEMS-Enabled Miniaturized Particulate Matter Monitor Employing 1.6 GHz Aluminum Nitride Thin-Film Bulk Acoustic Wave Resonator (FBAR) and Thermophoretic Precipitator, Ultrasonics Symposium, 2007. IEEE, 2007, pp. 476–479 Search PubMed.
- R. Brederlow, S. Zauner, A. L. Scholtz, K. Aufinger, W. Simburger, C. Paulus, A. Martin, M. Fritz, H. J. Timme, H. Heiss, S. Marksteiner, L. Elbrecht, R. Aigner, R. Thewes, Biochemical sensors based on bulk acoustic wave resonators, Electron Devices Meeting, 2003. IEDM ′03 Technical Digest. IEEE International, 2003, pp. 992–994 Search PubMed.
- Z. Hao, K. Eun Sok, Vapor and liquid mass sensing by micromachined acoustic resonator, Micro Electro Mechanical Systems, 2003. MEMS-03 Kyoto. IEEE The Sixteenth Annual International Conference on, 2003, pp. 470–473 Search PubMed.
- S. Rey-Mermet, R. Lanz and P. Muralt, Bulk acoustic wave resonator operating at 8 GHz for gravimetric sensing of organic films, Sens. Actuators, B, 2006, 114, 681–686 CrossRef.
- R. P. O′Toole, S. G. Burns, G. J. Bastiaans and M. D. Porter, Thin aluminum nitride film resonators: miniaturized high sensitivity mass sensors, Anal. Chem., 1992, 64, 1289–1294 CrossRef.
- A. Lin, Y. Hongyu, M. S. Waters, K. Eun Sok, S. D. Goodman, Explosive trace detection with FBAR-based sensor, Micro Electro Mechanical Systems, 2008. MEMS 2008. IEEE 21st International Conference on, 2008, pp. 208–211 Search PubMed.
- A. Lin, K. Eun Sok, Selectivity and Long-Term Reliability of Resonant Explosive-Vapor-Trace Detection based on Antigen-Antibody Binding, Micro Electro Mechanical Systems, 2009. MEMS 2009. IEEE 22nd International Conference on, 2009, pp. 316–319 Search PubMed.
- D. Chen, Y. Xu, J. Wang and L. Zhang, Nerve gas sensor using film bulk acoustic resonator modified with a self-assembled Cu2+/11-mercaptoundecanoic acid bilayer, Sens. Actuators, B, 2010, 150, 483–486 CrossRef.
- M. Penza, P. Aversa, G. Cassano, D. Suriano, W. Wlodarski, M. Benetti, D. Cannata, F. Di Pietrantonio and E. Verona, Thin-Film Bulk-Acoustic-Resonator Gas Sensor Functionalized With a Nanocomposite Langmuir–Blodgett Layer of Carbon Nanotubes, IEEE Trans. Electron Devices, 2008, 1237–1243 CrossRef CAS.
- H. Zhang, M. S. Marma, K. Eun Sok, C. E. McKenna, M. E. Thompson, Mercury ion sensing by film-bulk-acoustic-resonator mass sensor, Sensors, 2005 IEEE, 2005, pp. 203–206 Search PubMed.
- Z. Hao, M. S. Marma, K. Eun Sok, C. E. McKenna, M. E. Thompson, Implantable resonant mass sensor for liquid biochemical sensing, Micro Electro Mechanical Systems, 2004. 17th IEEE International Conference on. (MEMS), 2004, pp. 347–350 Search PubMed.
- K. D. Wise, J. B. Angell and A. Starr, An Integrated-Circuit Approach to Extracellular Microelectrodes, IEEE Trans. Biomed. Eng., 1970, 238–247 CrossRef CAS.
- H. Zhang, W. Pang and E. S. Kim, Micromachined SU-8 Probe Integrated with Film-bulk-acoustic Resonant Mass Sensor, Micro Electro Mechanical Systems, 2006. MEMS 2006 Istanbul. 19th IEEE International Conference on, 2006, pp. 82–85 Search PubMed.
- W. Pang, L. Yan, H. Zhang, H. Y. Yu, E. S. Kim and W. C. Tang, Femtogram mass sensing platform based on lateral extensional mode piezoelectric resonator, Appl. Phys. Lett., 2006, 88, 243503 CrossRef.
- M. Rinaldi, C. Zuniga, S. Nipun, M. Taheri, G. Piazza, S. M. Khamis, A. T. Johnson, Gravimetric chemical sensor based on the direct integration of SWNTS on ALN Contour-Mode MEMS resonators, Frequency Control Symposium, 2008 IEEE International, 2008, pp. 443–448 Search PubMed.
- C. Zuniga, M. Rinaldi, S. M. Khamis, A. T. Johnson and G. Piazza, Nanoenabled microelectromechanical sensor for volatile organic chemical detection, Appl. Phys. Lett., 2009, 94, 223122 CrossRef.
- M. Rinaldi, B. Duick, C. Zuniga, C. Zuo, G. Piazza, SS-DNA functionalized ultra-thin-film ALN Contour-mode Resonators with self-sustained oscillator for volatile organic chemical detection, Micro Electro Mechanical Systems (MEMS), 2010 IEEE 23rd International Conference on, 2010, pp. 132–135 Search PubMed.
- J. D. Adams, G. Parrott, C. Bauer, T. Sant, L. Manning, M. Jones, B. Rogers, D. McCorkle and T. L. Ferrell, Nanowatt chemical vapor detection with a self-sensing, piezoelectric microcantilever array, Appl. Phys. Lett., 2003, 83, 3428–3430 CrossRef CAS.
- H. Zhang, M. S. Marma, S. K. Bahl, E. S. Kim and C. E. McKenna, Sequence Specific Label-Free DNA Sensing Using Film-Bulk-Acoustic-Resonators, Sensors Journal, IEEE 7, 2007, 1587–1588 CAS.
- R. Gabl, H. D. Feucht, H. Zeininger, G. Eckstein, M. Schreiter, R. Primig, D. Pitzer and W. Wersing, First results on label-free detection of DNA and protein molecules using a novel integrated sensor technology based on gravimetric detection principles, Biosens. Bioelectron., 2004, 19, 615–620 CrossRef CAS.
- M. Nirschl, A. Rantala, K. Tukkiniemi, S. Auer, A. C. Hellgren, D. Pitzer, M. Schreiter and I. Vikholm-Lundin, CMOS-Integrated Film Bulk Acoustic Resonators for Label-Free Biosensing, Sensors, 2010, 10, 4180–4193 CrossRef CAS.
- Y. Lee, G. Lim and W. Moon, A self-excited micro cantilever biosensor actuated by PZT using the mass micro balancing technique, Sens. Actuators, A, 2006, 130, 105–110 CrossRef.
- H. Zhang and E. S. Kim, Micromachined Acoustic Resonant Mass Sensor, Microelectromechanical Systems, Journal of, 2005, 14, 699–706 CAS.
- W. C. Xu, S. Choi and J. Chae, A contour-mode film bulk acoustic resonator of high quality factor in a liquid environment for biosensing applications, Appl. Phys. Lett., 2010, 96, 053703 CrossRef.
- C. Seokheun, X. Wencheng, Z. Xu, C. Junseok, Characterization of a high-Q in-liquid longitudinal-mode film bulk acoustic resonator for real-time in situ monitoring of competitive protein adsorption, Micro Electro Mechanical Systems (MEMS), 2010 IEEE 23rd International Conference on, 2010, pp. 739–742 Search PubMed.
- K. S. Hwang, J. H. Lee, J. Park, D. S. Yoon, J. H. Park and T. S. Kim, In situ quantitative analysis of a prostate-specific antigen (PSA) using a nanomechanical PZT cantilever, Lab Chip, 2004, 4, 547–552 RSC.
- H. Zhang, W. Pang, M. S. Marma, C. Y. Lee, S. Kamal-Bahl, E. S. Kim and C. E. McKenna, Label-free detection of protein–ligand interactions in real time using micromachined bulk acoustic resonators, Appl. Phys. Lett., 2010, 96, 123702 CrossRef.
- G. Wingqvist, H. Anderson, C. Lennartsson, T. Weissbach, V. Yantchev and A. L. Spetz, On the applicability of high frequency acoustic shear mode biosensing in view of thickness limitations set by the film resonance, Biosens. Bioelectron., 2009, 24, 3387–3390 CrossRef CAS.
- G. Wingqvist, J. Bjurstrom, L. Liljeholm, I. Katardjiev, A. L. Spetz, Shear mode AlN thin film electroacoustic resonator for biosensor applications, Sensors, 2005 IEEE, 2005, pp. 50–53 Search PubMed.
- J. H. Lee, T. S. Kim and K. H. Yoon, Effect of mass and stress on resonant frequency shift of functionalized Pb(Zr0.52Ti0.48)O3 thin film microcantilever for the detection of C-reactive protein, Appl. Phys. Lett., 2004, 84, 3187–3189 CrossRef CAS.
- J. Weber, W. M. Albers, J. Tuppurainen, M. Link, R. Gabl, W. Wersing and M. Schreiter, Shear mode FBARs as highly sensitive liquid biosensors, Sens. Actuators, A, 2006, 128, 84–88 CrossRef.
- T. Xu, Z. H. Wang, J. M. Miao, L. Yu and C. M. Li, Micro-machined piezoelectric membrane-based immunosensor array, Biosens. Bioelectron., 2008, 24, 638–643 CrossRef CAS.
- S. Shin, J. P. Kim, S. J. Sim and J. Lee, A multisized piezoelectric microcantilever biosensor array for the quantitative analysis of mass and surface stress, Appl. Phys. Lett., 2008, 93, 102902 CrossRef.
- G. Y. Kang, G. Y. Han, J. Y. Kang, I. H. Cho, H. H. Park, S. H. Paek and T. S. Kim, Label-free protein assay with site-directly immobilized antibody using self-actuating PZT cantilever, Sens. Actuators, B, 2006, 117, 332–338 CrossRef.
- Z. Yan, X. Y. Zhou, G. K. H. Pang, T. Zhang, W. L. Liu, J. G. Cheng, Z. T. Song, S. L. Feng, L. H. Lai, J. Z. Chen and Y. Wang, ZnO-based film bulk acoustic resonator for high sensitivity biosensor applications, Appl. Phys. Lett., 2007, 90, 143503 CrossRef.
- G. Wingqvist, V. Yantchev and I. Katardjiev, Mass sensitivity of multilayer thin film resonant BAW sensors, Sens. Actuators, A, 2008, 148, 88–95 CrossRef.
- W. Pang, H. Zhang, R. C Ruby, H. Yu and E. S. Kim, Analytical and experimental study on the second harmonic mode response of a bulk acoustic wave resonator, J. Micromech. Microeng., 2010, 20, 115015 CrossRef.
- M. Loschonsky, D. Eisele, L. M. Reindl, Mass Sensitive Thin Film Bulk Acoustic Wave Resonators, International Frequency Control Symposium and Exposition, 2006 IEEE, 2006, pp. 111–116 Search PubMed.
- H. Campanella, J. Esteve, J. Montserrat, A. Uranga, G. Abadal, N. Barniol and A. Romano-Rodriguez, Localized and distributed mass detectors with high sensitivity based on thin-film bulk acoustic resonators, Appl. Phys. Lett., 2006, 89, 033507 CrossRef.
- H. Campanella, E. Martincic, P. Nouet, A. Uranga and J. Esteve, Analytical and Finite-Element Modeling of Localized-Mass Sensitivity of Thin-Film Bulk Acoustic-Wave Resonators (FBAR), IEEE Sens. J., 2009, 9, 892–901 CrossRef CAS.
- H. Campanella, A. Uranga, A. Romano-Rodriguez, J. Montserrat, G. Abadal, N. Barniol and J. Esteve, Localized-mass detection based on thin-film bulk acoustic wave resonators (FBAR): Area and mass location aspects, Sens. Actuators, A, 2008, 142, 322–328 CrossRef.
- F. Josse, Y. Lee, S. J. Martin and R. W. Cernosek, Analysis of the radial dependence of mass sensitivity for modified-electrode quartz crystal resonators, Anal. Chem., 1998, 70, 237–247 CrossRef CAS.
- J. Weber, M. Link, R. Primig, D. Pitzer, W. Wersing and M. Schreiter, Investigation of the scaling rules determining the performance of film bulk acoustic resonators operating as mass sensors, IEEE Trans. Ultrason. Ferroelectr. Freq. Control, 2007, 54, 405–412 CrossRef.
- H. Zhang, M. S. Marma, E. S. Kim, C. E. McKenna and M. E. Thompson, A film bulk acoustic resonator in liquid environments, J. Micromech. Microeng., 2005, 15, 1911–1916 CrossRef.
- M. Link, M. Schreiter, J. Weber, R. Primig, D. Pitzer and R. Gabl, Solidly mounted ZnO shear mode film bulk acoustic resonators for sensing applications in liquids, IEEE Trans. Ultrason. Ferroelectr. Freq. Control, 2006, 53, 492–496 CrossRef.
- K. Tukkiniemi, A. Rantala, M. Nirschl, D. Pitzer, T. Huber and M. Schreiter, Fully integrated FBAR sensor matrix for mass detection, Proceedings of the Eurosensors Xxiii Conference, 2009, 1, 1051–1054 Search PubMed.
- C. Castille, I. Dufour and C. Lucat, Longitudinal vibration mode of piezoelectric thick-film cantilever-based sensors in liquid media, Appl. Phys. Lett., 2010, 96, 154102 CrossRef.
- C. Zuniga, M. Rinaldi, G. Piazza, Quality factor of MEMS and NEMS AlN Contour Mode Resonators in liquid media, Ultrasonics Symposium (IUS), 2009 IEEE International, 2009, pp. 2568–2571 Search PubMed.
- J. Lu, T. Ikehara, Y. Zhang, R. Maeda and T. Mihara, Energy dissipation mechanisms in lead zirconate titanate thin film transduced micro cantilevers, Japanese Journal of Applied Physics Part 1-Regular Papers Brief Communications & Review Papers, 2006, 45, 8795–8800 CAS.
- J. Lu, T. Ikehara, Y. Zhang, T. Mihara, T. Itoh and R. Maeda, High quality factor silicon cantilever transduced by piezoelectric lead zirconate titanate film for mass sensing applications, Japanese Journal of Applied Physics Part 1-Regular Papers Brief Communications & Review Papers, 2007, 46, 7643–7647 CAS.
- Y. Hongyu, P. Wei, Z. Hao, K. Eun Sok, Film bulk acoustic resonator at 4.4 GHz with ultra low temperature coefficient of resonant frequency, Micro Electro Mechanical Systems, 2005. MEMS 2005. 18th IEEE International Conference on, 2005, pp. 28–31 Search PubMed.
- W. Pang, R. C. Ruby, R. Parker, P. W. Fisher, M. A. Unkrich and J. D. Larson, A temperature-stable film bulk acoustic wave oscillator, IEEE Electron Device Lett., 2008, 29, 315–318 CrossRef.
- J. Bjurstrom, G. Wingqvist, V. Yantchev and I. Katardjiev, Temperature compensation of liquid FBAR sensors, J. Micromech. Microeng., 2007, 17, 651–658 CrossRef.
- Z. Xu, X. Wencheng, A. Abbaspour-Tamijani, C. Junseok, Thermal Analysis and Characterization of a High Q Film Bulk Acoustic Resonator (FBAR) as Biosensers in Liquids, Micro Electro Mechanical Systems, 2009. MEMS 2009. IEEE 22nd International Conference on, 2009, pp. 939–942 Search PubMed.
- S. Rai, Y. Su, W. Pang, R. Ruby and B. Otis, A Digitally Compensated 1.5 GHz CMOS/FBAR Frequency Reference, IEEE Trans. Ultrason. Ferroelectr. Freq. Control, 2010, 57, 552–561 CrossRef.
- A. Dickherber, C. D. Corso and W. D. Hunt, Optimization and characterization of a ZnO biosensor array, Sens. Actuators, A, 2008, 144, 7–12 CrossRef.
- K. Ping, S. Doerner, T. Schneider, D. Allara, P. Hauptmann and S. Tadigadapa, A Micromachined Quartz Resonator Array for Biosensing Applications, Microelectromechanical Systems, Journal of, 2009, 18, 522–530 Search PubMed.
- L. Rodriguez-Pardo, J. Fariña, C. Gabrielli, H. Perrot and R. Brendel, Resolution in quartz crystal oscillator circuits for high sensitivity microbalance sensors in damping media, Sens. Actuators, B, 2004, 103, 318–324 CrossRef.
- D. W. Chun, K. S. Hwang, K. Eom, J. H. Lee, B. H. Cha, W. Y. Lee, D. S. Yoon and T. S. Kim, Detection of the Au thin-layer in the Hz per picogram regime based on the microcantilevers, Sens. Actuators, A, 2007, 135, 857–862 CrossRef.
- Z. Y. Shen, W. Y. Shih and W. H. Shih, Self-exciting, self-sensing PbZr0.53Ti0.47O3/SiO2 piezoelectric microcantilevers with femtogram/Hertz sensitivity, Appl. Phys. Lett., 2006, 89, 023506 CrossRef.
- T. Y. Kwon, K. Eom, J. H. Park, D. S. Yoon, T. S. Kimc and H. L. Lee, In situ real-time monitoring of biomolecular interactions based on resonating microcantilevers immersed in a viscous fluid, Appl. Phys. Lett., 2007, 90, 223903 CrossRef.
| This journal is © The Royal Society of Chemistry 2012 |
