 Open Access Article
A facile building-block synthesis of multifunctional lanthanide MOFs†
Stefania
Tanase
*ab,
Marjo C.
Mittelmeijer-Hazeleger
a,
Gadi
Rothenberg
*a,
Corine
Mathonière
c,
Véronique
Jubera
c,
Jan M. M.
Smits
d and
René
de Gelder
d
aVan't Hoff Institute for Molecular Sciences, University of Amsterdam, Science Park 904, 1098 XH, Amsterdam, The Netherlands. E-mail: s.grecea@uva.nl; g.rothenberg@uva.nl
bLeiden Institute of Chemistry, Gorlaeus Laboratories, Leiden University, PO Box 9502, 2300 RA, Leiden, The Netherlands
cCNRS, Université de Bordeaux, ICMCB, 87 av. Dr A. Schweitzer, Pessac, F-33608, France
dRadboud University Nijmegen, Institute for Molecules and Materials, Toernooiveld 1, 6525 ED, Nijmegen, The Netherlands
First published on 26th August 2011
Abstract
We report a building blocks approach providing a direct route to multifunctional MOFs, that display photoluminescent properties, robustness, porosity and in some cases unique magnetic properties. The self-assembly of [Mo(CN)8]4− with several in situ prepared lanthanide building blocks gives 3D robust porous networks with open channels. This approach solves the coordination problem, allowing exact placement of the lanthanide ions within the structure. Our MOFs feature good thermal stability and permanent porosity thanks to the strong carboxylate and cyanide linkages. The fact that we have both nitrogen-containing ligand and a π-system means that these MOFs can be excited using low-energy photons. Efficient visible emission was observed for MOFs containing Eu(III) and Tb(III). Surprisingly, the Tb-MOF shows ferromagnetic behavior, proving that the magnetic interaction between Tb(III) ions is strong enough to compensate the ligand field effects.
Introduction
Metal organic frameworks (MOFs) are three-dimensional porous structures consisting of metal ions or clusters of metal ions linked together by organic molecules. They are extensively studied for their functional properties and applications in materials science.1–12 Their pores can act as molecular filters, containers or even tiny chemical reactors.1–6,8,11–13 The sorption capabilities may also be combined with magnetic and optically active features.7,9,14One of the most exciting applications of MOFs lies in the field of luminescent sensors.14,15 They can be used as analytical sensors or as barcode systems for biological applications.14–16 Constructing such sensor MOFs typically involves assembling lanthanide ions through multifunctional bridging ligands.14,15 However, lanthanides have large coordination spheres and flexible coordination geometries, so inserting them into highly ordered structures is no easy task. One way of overcoming this drawback is by associating the lanthanide ions with transition metal ions.17–20 The problem is that in such a one-pot approach, we cannot control the lanthanide position in the MOF structure. This is a crucial point, because the positioning of the luminescent ion ultimately determines the optical properties. Furthermore, research on lanthanide MOFs is mainly focused on magnetic and photoluminescent properties.14,15 Most lanthanide MOFs lack porosity and therefore their possible applications in gas storage is less explored.
To solve this problem, we present here an elegant synthetic approach for making multifunctional MOFs. We use the affinity of lanthanide ions towards ligands containing hybrid oxygen-nitrogen donors, making in situ lanthanide building-blocks. Then, we assemble these together with [Mo(CN)8]4−, obtaining the desired MOFs. This gives robust hybrid 3D porous networks, with interesting luminescent and magnetic properties.
Results and discussion
Synthesis and characterization of multifunctional MOFs
In a typical reaction (eqn (1)), aqueous solutions of [Mo(CN)8]4−, Ln(NO3)3 and 5-methyl-2-pyrazine carboxylic acid (Hmpca) were mixed in a 1![[thin space (1/6-em)]](https://www.rsc.org/images/entities/char_2009.gif) :1:2 molar ratio. An equal volume of methanol was then layered slowly onto this mixture. The MOFs formed by self-assembly over 24 h and were then isolated by simple decantation and filtration (see experimental section for details). The general formula of these MOFs is [Ln(mpca)2(CH3OH)2Ln(H2O)6Mo(CN)8]·xCH3OH (where Ln = Nd, Eu, Gd, Tb, Er). Very good isolated yields (78–87%) were obtained with various lanthanide ions. Although the crystallinity of the compounds is maintained upon removing the crystals from the mother liquid, the guest methanol molecules are easily replaced by eight water molecules as indicated by elemental, IR spectroscopic, and thermogravimetric analysis (see Table 1 and supporting information†). XRD studies show that all compounds are isostructural (see supporting information for details). The powder XRD pattern of all Ln-MOFs samples shows small shifts in the peak positions and some peaks are also missing (Fig. S3). This suggests structural rearrangements upon replacement of methanol with water molecules. Note that the methyl group of the mpca ligand plays a key role in the MOF formation. Control experiments confirmed that using other alkyl derivatives of pyrazinecarboxylic acid does not give any product.
:1:2 molar ratio. An equal volume of methanol was then layered slowly onto this mixture. The MOFs formed by self-assembly over 24 h and were then isolated by simple decantation and filtration (see experimental section for details). The general formula of these MOFs is [Ln(mpca)2(CH3OH)2Ln(H2O)6Mo(CN)8]·xCH3OH (where Ln = Nd, Eu, Gd, Tb, Er). Very good isolated yields (78–87%) were obtained with various lanthanide ions. Although the crystallinity of the compounds is maintained upon removing the crystals from the mother liquid, the guest methanol molecules are easily replaced by eight water molecules as indicated by elemental, IR spectroscopic, and thermogravimetric analysis (see Table 1 and supporting information†). XRD studies show that all compounds are isostructural (see supporting information for details). The powder XRD pattern of all Ln-MOFs samples shows small shifts in the peak positions and some peaks are also missing (Fig. S3). This suggests structural rearrangements upon replacement of methanol with water molecules. Note that the methyl group of the mpca ligand plays a key role in the MOF formation. Control experiments confirmed that using other alkyl derivatives of pyrazinecarboxylic acid does not give any product. | (1) |
| Ln-MOF | Isolated Yield (%) |
![[small nu, Greek, macron]](https://www.rsc.org/images/entities/char_e0ce.gif) C≡N (cm−1) C≡N (cm−1) |
Surface Area (m2 g−1) | χMTb (cm−3 K mol−1) |
|---|---|---|---|---|
| a [Ln(mpca)2(CH3OH)2Ln(H2O)6Mo(CN)8]·8H2O (where Ln = Nd, Eu, Gd, Tb, Er). b χM is the paramagnetic susceptibility measured at T = 300 K. Values in brackets are calculated based on the free ion approximation. | ||||
| Nd | 80 | 2122 | 205 | 3.25 (3.28) |
| 2105 | ||||
| Eu | 87 | 2122 | 169 | 3.15 (3.20) |
| 2105 | ||||
| Gd | 85 | 2124 | 179 | 15.47 (15.76) |
| 2105 | ||||
| Tb | 82 | 2125 | n.d. | 29.76 (23.50) |
| 2104 | ||||
| Er | 78 | 2125 | n.d. | 22.72 (22.96) |
| 2104 |
The IR spectra of Ln-MOFs are basically identical (Figure S1), in agreement with the fact that all MOFs have identical three dimensional structures. The most noticeable feature of the IR spectra concerns the existence of bands at ca. 2122 and 2105 cm−1, which are assigned to the characteristic C≡N stretching vibrations. The very strong peak at 2122 cm−1 confirms the predominant existence of the bridging cyanide groups, indicating the formation of Ln-NC-Mo bridges. All spectra show the presence of the COO− stretching vibrations around 1605 and 1490 cm−1, thus confirming the presence of the carboxylate groups of the organic ligand. These bands appear as medium to strong absorptions which are shifted to lower frequencies as compared with the free 2-methylpyrazine carboxylic acid. As for the pyrazine ring, the C≡N stretching frequencies undergo a shift from 1395 cm−1 for the free ligand to ca. 1575 cm−1 upon coordination. These shifts are due to strong coordination of the ring nitrogens with the lanthanide ions, supporting their assignment as chelating ligands.
The absorption spectra collected in the range 200–1400 nm at room temperature of Nd-, Eu- and Er-MOFs as well as of the compound K4[Mo(CN)8] are shown in Figure S4 in the ESI†. The absorption properties bellow 450 nm are ascribed to the π–π* transitions within the ligand and the charge transfer transitions of [Mo(CN)8]4−. In the absorption spectrum of Eu-MOF, the charge transfer transitions of [Mo(CN)8]4− are shifted toward lower energies as compared with the other Ln(III)–Mo(IV) compounds. The EuIII 4f–4f transition lines expected at around 394 nm and 465 nm cannot be distinguished from the large UV absorption band. Eu-MOF is also interesting. The band at 450 nm suggests a peculiar charge transfer which is not observed in the other MOFs. We assign this band to the Eu(III) to Mo(IV) charge transfer. The absorption spectrum of Nd-MOF is rich in bands in the visible and near infrared region. These bands are caused by the transitions from the ground 4I9/2 level to the excited J levels of 4f3 configuration of Nd(III). The excited levels of the visible and near ultraviolet bands are primarily determined by interelectronic repulsion parameters and to a smaller extent by the spin–orbit coupling. The levels producing bands in the infrared being essentially the members of the ground term are separated by multiples. The observed peaks for Nd-MOF correspond to the following transitions: 590 nm (4I9/2 → 4G5/2, 2G7/2); 688 nm (4I9/2 → 4F9/2); 752 nm (4I9/2 → 4F7/2, 4S3/2); 805 nm (4I9/2 → 2H9/2, 4F5/2); 892 nm (4I9/2 → 4F3/2). While Nd(III) has a 4f3 configuration, Er(III) is three electrons shy of the 4f14 configuration. The terms are therefore the same, with and inversion of the order of multiplets. The various levels are more separated in Er-MOF than for Nd-MOF. The ground state of Er(III) is 4I15/2. The observed absorption peaks for Er-MOF correspond to the following transitions: 527 nm (4I15/2 → 2H11/2); 662 nm (4I15/2 → 4F9/2); 811 nm (4I15/2 → 4I9/2); 998 nm (4I15/2 → 4I11/2).
Crystal structure determination
All five MOFs showed the same open-channel structure (Fig. 1 top). A good refinement of the crystal structure was possible only for the europium(III) derivative (Table 2 and Table 3). We discuss below the structure of Eu-MOF. The [Mo(CN)8]4− building block is connected to three [Eu(mpca)2(CH3OH)]+ units viacyanido bridges, forming a 2D network of alternating diamond-like Eu2Mo2(CN)4 features and octagonal Eu4Mo4(CN)8 rings. The coordination geometry of [Mo(CN)8]4− is a distorted square antiprism, wherein the twist angle between the two square faces equals 52.61°. The Mo–C bond lengths are in the range 2.135(7)–2.170(2) Å, and the C–N bonds in the range 1.140(7)–1.321(7) Å. Three bridging cyanido ligands coordinate to the europium(III) ion, Eu1, in two different ways: two of them are nearly linear (Eu1–N32–C32 = 165.7(4)°, Eu1–N33–C33 = 172.1(5)°), while one is bent (Eu1–N31–C31 = 155.7(5)°). The coordination polyhedron of Eu1 is a distorted tricapped trigonal prism, wherein the twist angle between the trigonal planes is 26.68°. Accordingly, the adjacent Eu⋯Mo distances fall in the range 5.662–5.743 Å.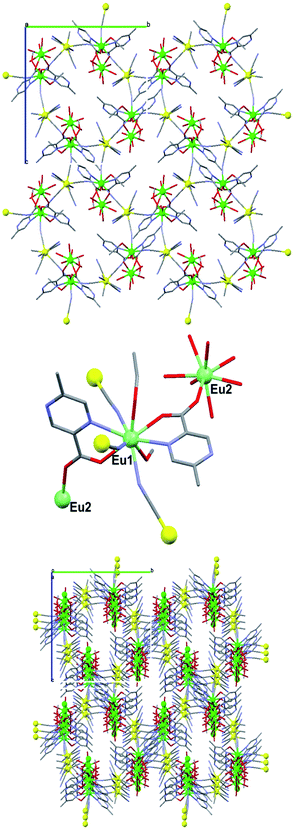 | ||
| Fig. 1 The connection between Eu(III) and Mo(IV) in Eu-MOF (top), the connection via the Eu(III) of the 2D planes (middle) and the resulting three-dimensional structure (bottom). Color code: green, europium; yellow, molybdenum; red, oxygen; blue, nitrogen; grey, carbon. Hydrogen atoms and the non-coordinated solvent molecules are omitted for clarity. | ||
| EuMOF | |
|---|---|
| Formula Weight | 1184.58 |
| Crystal System | Monoclinic |
| Space Group | P21/c |
| a/Å | 10.8137(13) |
| b/Å | 19.040(2) |
| c/Å | 19.246(4) |
| α (°) | 90 |
| β (°) | 98.338(11) |
| γ (°) | 90 |
| V/Å3 | 3920.8(10) |
| Z | 4 |
| Dcalc (Mg m−3) | 2.0075 |
| μ (MoKα) (mm−1) | 3.561 |
| Crystal size/mm | 0.23 × 0.13 × 0.11 |
| T/K | 208(2) |
| Data Collected | 57131 |
| Unique data | 8650 |
| R int | 0.0276 |
| R(F) [I > 2σ(I)] | 7236 |
| R w (F2) | 0.0378 |
| S | 1.219 |
| Δρmin, Δρmax/e Å−3 | −1.535, 1.250 |
| Bond lengths | |
|---|---|
| Eu(1)–O(19) | 2.42 |
| Eu(1)–O(29) | 2.40 |
| Eu(1)–O(41) | 2.45 |
| Eu(1)–O(43) | 2.50 |
| Eu(1)–N(10) | 2.62 |
| Eu(1)–N(20) | 2.62 |
| Eu(1)–N(31) | 2.48 |
| Eu(1)–N(32) | 2.46 |
| Eu(1)–N(33) | 2.44 |
| Eu(2)–O(18) | 2.42 |
| Eu(2)–O(51) | 2.42 |
| Eu(2)–O(52) | 2.46 |
| Eu(2)–O(53) | 2.39 |
| Eu(2)–O(54) | 2.35 |
| Eu(2)–O(55) | 2.45 |
| Eu(2)–O(56) | 2.34 |
| Eu(2)–O(28)b | 2.32 |
| Mo(1)–C(31) | 2.13 |
| Mo(1)–C(34) | 2.15 |
| Mo(1)–C(35) | 2.14 |
| Mo(1)–C(36) | 2.16 |
| Mo(1)–C(37) | 2.15 |
| Mo(1)–C(38) | 2.17 |
| Bond angles | |
| O(19)–Eu(1)–O(29) | 136.34 |
| O(19)–Eu(1)–O(41) | 70.02 |
| O(19)–Eu(1)–O(43) | 69.37 |
| O(29)–Eu(1)–O(41) | 136.26 |
| O(43)–Eu(1)–N(32) | 140.92 |
| O(43)–Eu(1)–N(33) | 77.07 |
| N(10)–Eu(1)–N(20) | 139.06 |
| O(18)–Eu(2)–O(51) | 125.69 |
| O(18)–Eu(2)–O(52) | 72.62 |
| O(18)–Eu(2)–O(53) | 72.33 |
| O(51)–Eu(2)–O(54) | 78.15 |
| O(51)–Eu(2)–O(55) | 70.26 |
| O(51)–Eu(2)–O(56) | 69.71 |
| C(31)–Mo(1)–C(36) | 72.78 |
| C(31)–Mo(1)–C(37) | 134.60 |
| C(31)–Mo(1)–C(38) | 123.29 |
| C(35)–Mo(1)–C(37) | 72.51 |
| C(35)–Mo(1)–C(38) | 145.72 |
The most remarkable structural feature is the connection of the 2D networks through a second europium(III) center, Eu2. This connection occurs via the carboxylato group of one mpca ligand, giving a 3D structure with open channels (Fig. 1, bottom). Within these channels, voids of 128 Å3 do exist; the shortest H-H distance is about 2.5 Å. The Eu2 center is nine-coordinated. It binds to two bidentate anionic mpca ligands, three cyanide ions, one water molecule and one methanol molecule (Fig. 1, middle). Bond lengths of Eu2–O range from 2.329(2)–2.461(2) Å. The coordination geometry around Eu2 is a slightly distorted square antiprism, with a twist angle of 46.76°. It is the europium-carboxylate bonds that strengthen the 3D structure. Their energy is comparatively large due to enhanced electrostatic attraction. Moreover, the size of the carboxylate functionality allows both bridging and chelation of Eu(III) ions. The structure is further stabilized by multiple hydrogen-bonding between water, methanol and the cyanido ligands.
Network stability and adsorption properties
Our new MOFs have a unique 3D open-channel structure. This enables the removal of all guest solvent molecules. The result is a framework with coordinative unsaturated and lanthanide ions that can bind a variety of substrates. However, porosity by itself is not sufficient. A good porous network should retain its structure even when all the guest molecules are gone. Therefore, we tested the thermal stability and robustness of Ln-MOFs using thermal gravimetric analysis (TGA). This, combined with a simultaneous evolved gas analysis, showed that all samples exhibit similar mass losses when heated (Fig. 2 and supporting information). Fig. 2, top, shows the TGA behaviour for Eu-MOF. The first step (30–165 °C) corresponds to the loss of both lattice and coordinated solvent molecules. X-ray diffraction measurements after dehydration showed that in most of the cases single crystals still extinguished polarized light, but no longer diffracted X-rays. A good quality powder XRD pattern was obtained only for the Eu-MOF. Small shifts in the peak intensity and position suggest that structural rearrangements take place upon dehydration. We also studied the porosity of Nd-, Eu- and Gd-MOFs using CO2 sorption measurements (Fig. 2, bottom). After activation for two hours in vacuum at 200 °C, the dehydrated forms of Nd, Eu and Gd MOFs show a microporous structure, with surfaces areas of 160–200 m2 g−1 (Table 1). The surface areas are calculated using Dubinin-Raduskewitsch formula. Nd-MOF shows larger CO2 sorption as compared with Eu- and Gd-MOFs. This is in agreement with the larger ionic radius of Nd(III) which makes the channel diameters in Nd-MOF bigger than those of Eu- and Gd-MOFs. | ||
| Fig. 2 TGA curve of Eu-MOF (top) and the CO2 isotherms of Nd-, Eu- and Gd-MOFs at 273 K (bottom). | ||
Curiously, Nd-MOF is also a rare example of a coordination network that shows pronounced hysteresis behaviour upon sorption-desorption of CO2, thanks to the structural flexibility of the [Mo(CN)8]4− units. This reflects a dynamic behaviour. Adsorbing CO2, the framework expands to accommodate more guest molecules. When all the CO2 molecules are desorbed, the structure returns to its initial state.
Photoluminescent properties
The emissive properties of a lanthanide ion are governed by two factors: the ease of excitation on one hand and the non-radiative deactivation on the other. Eu(III) and Tb(III) are especially interesting due to their emission in the visible range. The problem is that the absorption coefficients for these ions are very low because of the weak 4f–4f transitions involved. Moreover, strong absorption due to the ligand to lanthanide(III) charge transfer or even 5d–4f transition can be observed. This is common for compounds containing Eu(III) or Tb(III), respectively. Fortunately, the global absorption of the lanthanide materials can be improved by using highly absorbent chelating ligands that serve as sensitizers (the so-called antenna effect21). The key factor is however the good matching between the spectral distribution of the sensitizers absorption and/or emission bands and the 4f–4f transitions of the lanthanide. The efficiency of the energy transfer depends on the energy gap between the excited triplet state of the ligand and the excited level of the lanthanide ion. Then, the spectral distribution and intensity of the luminescence is related to several parameters. These include the environment of the lanthanide ion, the type of coordinated ligand and its ability to act as an efficient sensitizer, and the presence of coordinated water molecules or hydroxyl groups which can quench part of the radiative processes. The lanthanide-centered emission can be sensitized with π-systems, at ca. 275 nm.21 Alternatively, nitrogen-containing ligands that bind directly to the ion can also enhance its emission.22,23 Our MOFs contain both a nitrogen ligand and a π-system, meaning that one can expect an efficient antenna effect at low energy.As the lowest excited states of Gd(III) are located at higher energy than the lowest energy excited states of the ligand, no emission is expected for Gd-MOF. Nd(III) and Er(III) are infrared emitting ions whereas Eu(III) and Tb(III) present radiative transitions in the visible range. To detect whether the lanthanide ion can be sensitized by the ligand, we studied the emissive properties of Nd-, Eu-, Tb- and Er-MOFs upon excitation with UV light at 383 nm. This wavelength corresponds to absorption from the ground state to the lowest singlet level of the ligand (see Supplementary Information, Figure S1).21,24
Nd-MOF showed emission at the usual wavelength of 1060 nm, assigned to the 4F3/2 → 4I11/2 transition of Nd(III). Unfortunately, no emission was observed for Er-MOF. The emission spectra of Eu- and Tb-MOFs principally arise from transitions originating at 5D0 and 5D4 levels, respectively (Fig. 3). The spectrum of Eu-MOF shows a weak broad band in the 5D0 → 7F1 transition region. The hypersensitive transition, 5D0 → 7F2, gives the more intense lines with a shoulder at lower frequency (Fig. 1). The resolution of the acquisition is not sufficient to detect the splitting of the 5D0 → 7FJ (J = 3, 4) transitions at room temperature. This lack of precision can also be related to a non-well crystallized environment around the lanthanide ion. The emission spectrum of Tb-MOF shows all the transitions from the emitting 5D4 level to the ground-state manifold. The maximum of the emission is located in the green range of the electromagnetic spectrum; it is due to 5D4 → 7F5 transitions.
 | ||
| Fig. 3 Emission spectra of Eu-MOF (red) and Tb-MOF (green) at λex = 383 nm. | ||
The lifetimes were calculated for all the luminescent compositions at the maximum of the emission. Nd-, Eu- and Tb- MOFs have values equal to 91 ns, 1 ms and 1 ms, respectively. These values are shorter than those generally observed in inorganic materials. In coordination compounds, the weak vibronic coupling between lanthanide ions and coordinated water molecules facilitates the non-radiative deactivation.25 This is particularly visible for the Nd-MOF. The lifetimes obtained for Eu- and Tb-MOFs are slightly shorter than those observed for compounds involving organic ligands with similar excited triplet state levels (de-excitation process involving the excited triplet state of the ligands).26,27 This reflects the direct coordination of water molecules to the Eu(III) and Tb(III) ions.
Magnetic properties
Most lanthanide ions have a large unquenched orbital angular momentum. Thus, their ground states are split by the spin–orbit coupling and the crystal field effects. Since the former are considerably larger than the latter, the orbital component of the magnetic moment is the important one. Indeed, the intrinsic magnetic anisotropy of lanthanide ions is the reason why MOFs containing such ions are so interesting for data storage28 and magnetic refrigeration29 applications.With this in mind, we studied the temperature-dependent magnetic susceptibilities of all MOFs (Fig. 4, top). Note that our MOFs contain a diamagnetic Mo(IV) ion and paramagnetic lanthanide ions connected through carboxylate bridges. Interestingly, the magnetic properties of Nd-, Eu-, and Er- MOFs are indeed dominated by the presence of strong ligand field effects, but Tb-MOF is different. Gd-MOF is of particular interest due the presence of the isotropic Gd(III) ions. These enable an easy interpretation of the magnetic properties with no complications due to the spin–orbit coupling. Starting at room temperature, the χMT values of Gd-MOF are constant down to 10 K. They then decrease slightly to 14.76 cm3Kmol−1 at 1.8 K. The global feature is characteristic of almost no magnetic interactions. A Curie–Weiss fit between 1.8 and 300 K gave the parameters C = 15.35 cm3Kmol−1 and θ = −1.2 K. This result is supported by the reduced molar magnetization at 2 K (Fig. 4b). The saturation magnetization value at 5 T is close to 14 Nβ, and the experimental data show only small deviation from the Brillouin curve (Fig. 5).30
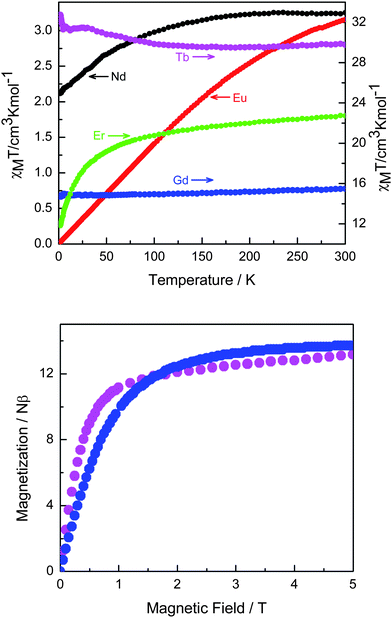 | ||
| Fig. 4 Temperature dependence of the χMT products for all MOFs (top). Field dependence of the magnetization recorded at 2 K for Gd- (blue circles) and Tb- (violet circles) MOFs (bottom). | ||
 | ||
| Fig. 5 Field dependence of the magnetization recorded at 2 K for Gd-MOF and the corresponding Brillouin curve calculated assuming gGd = 2. Inset: The Curie–Weiss fit between 1.8 and 300 K giving the parameters C = 15.35 cm3Kmol−1 and θ = −1.2 K. | ||
The terbium-containing MOF is a most peculiar case. Here, the 4f8 ground electronic configuration of Tb(III) yields 7F6 as the ground state and the nearest excited multiplet 7F5 is just little over 2020 cm−1 above. The ligand field splits the 7F6 ground state of Tb(III) in a set of six doublets and one singlet. At lower temperature, the depopulation of these sublevels leads to a deviation from the Curie law. This behavior usually results in a decrease of the χMT product even in the absence of any exchange interaction. But here, surprisingly, when the sample is cooled down from 300 K, the χMT value increases slowly reaching 31.48 cm3Kmol−1 at 27 K. It then decreases slowly to about 31.3 cm3Kmol−1 at 14 K, and increasing again to 32.74 cm3Kmol−1 at 1.8 K. This indicates a ferromagnetic coupling between the two Tb(III) ions, suggesting that the magnetic interaction is strong enough to compensate the ligand field effects. 31,32 Indeed, as shown in the insert of the upper panel in Figure S8 (Supplementary Material), a plot of χ−1versus T in the temperature range below 10 K indicates a positive intercept, characteristic for a ferromagnetic interaction, with a Curie–Weiss temperature of θW ≅ 0.1 K. We have shown previously that the excited levels of the Tb(III) ion are already depopulated below about 10 K.33 The presence of the ferromagnetic interaction between the two Tb(III) ions is also supported by the field dependence of the magnetization at 1.8 K (Fig. 4 bottom) which shows a step increase below 1 T. A subsequent slow and nearly linear increase of magnetization up to 5 T reflects the contributions from the excited levels of the Tb(III) ion. 33 This is supported by the fact that the slope of the linear part yields a susceptibility value about equal to that measured at 100 K.
Conclusions
We show that the self-assembly of [Mo(CN)8]4−, Ln(NO3)3 and 5-methyl-2-pyrazine carboxylic acid gives 3D robust porous networks with open channels. This is the first example of self-assembling lanthanide MOFs using a building-block approach. These MOFs feature good thermal stability and permanent porosity, thanks to the strong carboxylate and cyanide linkages. The permanent micropores (ca. 2–3 nm) can host a variety of molecules, with a wide range of applications, from photochemistry to chemical sensing. Notably, the ferromagnetic behaviour of the Tb-MOF combined with its porosity opens exciting opportunities for developing switchable anisotropic magnetic materials. Overall, we foresee that this simple and quantitative synthesis route will form the basis of new scientific advances in the rapidly growing field of MOFs.Experimental
Materials and instrumentation
Starting materials were purchased from Aldrich and all manipulations were performed using materials as received. The complex K4[Mo(CN)8]·4H2O was synthesized according to the published procedure.C, H, and N analyses were performed with a Perkin–Elmer 2400 series II analyzer. Infrared spectra (4000–300 cm−1, resol. 4 cm−1) were recorded on a Perkin–Elmer Paragon 1000 FTIR spectrometer equipped with a Golden Gate ATR device, using the reflectance technique. Diffuse reflectance spectra were obtained on a Perkin–Elmer Lambda 900 spectrophotometer using MgO as a reference. The excitation and emission spectra were recorded with a Perkin Elmer LS50B luminescence spectrometer. The intensity of the emission spectra was corrected for the sensitivity of the detector. Luminescent lifetime was measured using an excimer laser pumped dye laser (Lambda Physik) for excitation (pulse width ∼20 ns) and 0.2 m Acton Research monochromator with a RCA C31034 photomultiplier tube for detection of the emission. Luminescence decay curves were recorded using a Tektronix 200 MHz digital oscilloscope. The TGA was measured using a Setaram TG85 16–18 thermo balance. The heating rate was 5 °C min−1 in helium. The evolved gas was introduced and analysed in a mass spectrometer of Pfeiffer. The CO2 adsorption was performed in a Fisons Sorptomatic 1990. The temperature of the sample was kept constant at 273 K using a Haake DC10 thermostatted bath equipped with a circulating cooler DK15. Temperature dependent magnetic susceptibility and magnetization measurements were performed with a Quantum Design MPMS-5 5T SQUID magnetometer in the temperature range 1.8–300 K and up to 5 T. Samples were embedded in solid icosane to prevent torquing. Data were corrected for the magnetization of the sample holder and for diamagnetic contributions as estimated from the Pascal constants. For Tb-MOF, the temperature dependence of the magnetization was measured in various magnetic fields (0.05, 0.1, 0.2 and 0.5 T). However, no differences in the magnetization curves were observed.
X-ray crystal structure analysis
Intensity data for a single crystal Eu-MOF were collected using Mo-Kα radiation (λ = 0.71073 Å) on a Nonius KappaCCD diffractometer. The intensity data were corrected for Lorentz and polarization effects, for absorption (ψ-scan absorption correction) and extinction. The structures were solved by Patterson methods. The programs EvalCCD, DIRDIF96 and SHELXL-97 (references are provided in the cif file) were used for data reduction, structure solution and structure refinement, respectively. Refinement of F2 was done against all reflections. The weighted R factor, wR, and goodness of fit S are based on F2. Conventional R factors are based on F, with F set to zero for negative F2. All non-hydrogen atoms were refined with anisotropic displacement parameters. All hydrogens were placed at calculated positions and were refined riding on the parent atoms. Geometric calculations and molecular graphics were performed with the PLATON package. The crystal structure has been deposited at the Cambridge Crystallographic Data Centre and allocated the deposition number 811854.X-ray powder diffraction data were collected on a Philips X'Pert diffractometer, equipped with the X'Celerator, using Cu-Kα radiation. The patterns were measured in the range between 10° and 140° in steps of 0.021 (2°), counting time 10 s.
General procedure for the synthesis of Ln-MOFs
The reaction of Ln(NO3)3·6H2O (0.23 mmol), 5-methyl-2-pyrazinecarboxylic acid (0.46 mmol) and K4[Mo(CN)8]·2H2O (0.23 mmol) in water gives an orange clear solution. The slow diffusion of methanol into this solution gives well-shaped orange crystals in all cases., cm−1): 3158 br, 2122 s, 2105 m, 1606 m, 1573 m, 1488 w, 1415 m, 1328 m, 1295 m, 1194 m, 1050 s, 806 m, 727 w, 555 w. UV-Vis (λmax, nm): 286, 318, 366, 533, 585, 693, 752, 805, 887, 995, 1200.
, cm−1): 3162 br, 2122 s, 2105 m, 1605 m, 1573 m, 1488 w, 1414 m, 1328 m, 1296 m, 1194 m, 1051 s, 806 m, 727 w, 555 w. UV-Vis (λmax, nm): 286, 311, 380, 450.
, cm−1): 3176 br, 2124 s, 2105 m, 1607 m, 1575 m, 1490 w, 1417 m, 1329 m, 1297 m, 1197 m, 1051 s, 806 m, 727 w, 556 w. UV-Vis (λmax, nm): 285, 310, 380, 445.
, cm−1): 3191 br, 2125 s, 2104 m, 1608 m, 1575 m, 1494 w, 1417 m, 1329 m, 1296 m, 1196 m, 1053 s, 804 m, 727 w, 560 w. UV-Vis (λmax, nm): 260, 308, 384, 530, 550, 662, 807, 998. UV-Vis (λmax, nm): 285, 309, 380, 452.
, cm−1): 3191 br, 2125 s, 2104 m, 1607 m, 1575 m, 1494 w, 1417 m, 1329 m, 1296 m, 1196 m, 1053 s, 804 m, 727 w, 560 w. UV-Vis (λmax, nm): 260, 308, 384, 530, 550, 662, 807, 998.
Acknowledgements
We thank Prof. J. Reedijk (Leiden University) for discussions and Prof. M. D. Ward and Dr S. Faulkner for luminescence measurements of Nd and Er MOFs. S. T. thanks the Netherlands Organization for Scientific Research (NWO) for a Veni grant. S.T. and C. M. thank the NWO and the French Ministry of Research and Foreign Affairs for funding in the frame of Van Gogh EGIDE program.Notes and references
- C. B. Aakeroy, N. R. Champness and C. Janiak, CrystEngComm, 2010, 12, 22–43 RSC.
- R. Custelcean and B. A. Moyer, Eur. J. Inorg. Chem., 2007, 10, 1321–1340 CrossRef.
- A. B. Descalzo, R. Martinez-Manez, R. Sancenon, K. Hoffmann and K. Rurack, Angew. Chem., Int. Ed., 2006, 45, 5924–5948 CrossRef CAS.
- D. Farrusseng, S. Aguado and C. Pinel, Angew. Chem., Int. Ed., 2009, 48, 7502–7513 CrossRef CAS.
- R. J. Kuppler, D. J. Timmons, Q. R. Fang, J. R. Li, T. A. Makal, M. D. Young, D. Q. Yuan, D. Zhao, W. J. Zhuang and H. C. Zhou, Coord. Chem. Rev., 2009, 253, 3042–3066 CrossRef CAS.
- D. Maspoch, D. Ruiz-Molina and J. Veciana, Chem. Soc. Rev., 2007, 36, 770–818 RSC.
- B. Nowicka, M. Rains, K. Stadnicka and B. Sieklucka, Inorg. Chem., 2007, 46, 8123–8125 CrossRef CAS.
- E. R. Parnham and R. E. Morris, Acc. Chem. Res., 2007, 40, 1005–1013 CrossRef CAS.
- N. Roques, V. Mugnaini, J. Veciana, Magnetic and Porous Molecule-Based Materials, in: Functional Metal–Organic Frameworks: Gas Storage, Separation and Catalysis, Springer-Verlag Berlin, Berlin, 2010, pp. 207–258 Search PubMed.
- M. Savonnet, D. Bazer-Bachi, N. Bats, J. Perez-Pellitero, E. Jeanneau, V. Lecocq, C. Pinel and D. Farrusseng, J. Am. Chem. Soc., 2010, 132, 4518 CrossRef CAS.
- M. P. Suh and H. R. Moon, Adv. Inorg. Chem., 2007, 59, 39–79 CAS.
- U. S. Ozkan, Design of Heterogeneous Catalysts, Wiley-VCH, 2009 Search PubMed.
- C. Z. Mu, F. Xu and W. Lei, Progr. Chem., 2007, 19, 1345–1356 Search PubMed.
- M. D. Allendorf, C. A. Bauer, R. K. Bhakta and R. J. T. Houk, Chem. Soc. Rev., 2009, 38, 1330–1352 RSC.
- V. Hong, A. A. Kislukhin and M. G. Finn, J. Am. Chem. Soc., 2009, 131, 9986–9994 CrossRef CAS.
- K. A. White, D. A. Chengelis, K. A. Gogick, J. Stehman, N. L. Rosi and S. Petoud, J. Am. Chem. Soc., 2009, 131, 18069 CrossRef.
- F. Bouchama, M. B. Thathagar, D. Rothenberg, D. Farrusseng and C. Mirodatos, Langmuir, 2004, 20, 477–483 CrossRef CAS.
- Y. G. Huang, F. L. Jiang and M. C. Hong, Coord. Chem. Rev., 2009, 253, 2814–2834 CrossRef CAS.
- X. J. Zhang, Y. H. Xing, Z. Sun, J. Han, Y. H. Zhang, M. F. Ge and S. Y. Niu, Cryst. Growth Des., 2007, 7, 2041–2046 CrossRef CAS.
- Y. Q. Sun and G. Y. Yang, Dalton Trans., 2007, 3771–3781 RSC.
- G. Blasse, B. C. Grabmaier, Luminescent Materials, Springer, Berlin, 1994 Search PubMed.
- M. Heitzmann, F. Bravard, C. Gateau, N. Boubals, C. Berthon, J. Pecaut, M. C. Charbonnel and P. Delangle, Inorg. Chem., 2009, 48, 246–256 CrossRef CAS.
- N. Weibel, L. J. Charbonniere, M. Guardigli, A. Roda and R. Ziessel, J. Am. Chem. Soc., 2004, 126, 4888–4896 CrossRef CAS.
- A. Datcu, N. Roques, V. Jubera, I. Imaz, D. Maspoch, J. P. Sutter, C. Rovira and J. Veciana, Chem. Eur. J., 2011, 13, 3644–3656 Search PubMed.
- W. D. Horrocks and D. R. Sudnick, J. Am. Chem. Soc., 1979, 101, 334–340 CrossRef CAS.
- N. M. Shavaleev, R. Scopelliti, F. Gumy and J. C. G. Bunzli, Inorg. Chem., 2009, 48, 6178–6191 CrossRef CAS.
- V. F. Zolin, V. I. Tsaryuk, V. A. Kudryashova, K. P. Zhuravlev, P. Gawryszewska, J. Legendziewicz and R. Szostak, J. Alloys Compd., 2008, 451, 149–152 Search PubMed.
- F. Branzoli, P. Carretta, M. Filibian, G. Zoppellaro, M. J. Graf, J. R. Galan-Mascaros, O. Fuhr, S. Brink and M. Ruben, J. Am. Chem. Soc., 2009, 131, 4387–4396 CrossRef CAS.
- B. G. Shen, J. R. Sun, F. X. Hu, H. W. Zhang and Z. H. Cheng, Adv. Mater., 2009, 21, 4545–4564 CrossRef CAS.
- Assuming a gGd value equal to 2.00.
- N. Ishikawa, O. Satoshi and Y. Kaizu, Angew. Chem., Int. Ed., 2005, 44, 731–733 CrossRef CAS.
- Z. H. Zhang, Y. Song, T. Okamura, Y. Hasegawa, W. Y. Sun and N. Ueyama, Inorg. Chem., 2006, 45, 2896–2902 CrossRef CAS.
- F. Prins, E. Pasca, L. J. de Jongh, H. Kooijman, A. L. Spek and S. Tanase, Angew. Chem., Int. Ed., 2007, 46, 6081–6084 CrossRef CAS.
Footnote |
| † Electronic Supplementary Information (ESI) available: IR and optical spectra, XRD and TGA data, decay time curve of Nd-MOF and magnetic properties of Tb-MOF. CCDC reference number 811854. For ESI and crystallographic data in CIF or other electronic format see DOI: 10.1039/c1jm12789f |
| This journal is © The Royal Society of Chemistry 2011 |