Open Access Article
DOI:
10.1039/C0JM03446K
(Paper)
J. Mater. Chem., 2011,
21, 4175-4181
An ionic terfluorene derivative for saturated deep-blue solid state light-emitting electrochemical cells†
Received
13th October 2010
, Accepted 12th January 2011
First published on 8th February 2011
Abstract
In this study, we obtained saturated deep-blue electroluminescence (EL) from solid state light-emitting electrochemical cells (LECs) incorporating the ionic terfluorene derivative 1, which we synthesized through covalent tethering of methylimidazolium moieties as pendent groups of terfluorene. Compound 1 exhibited the deep-blue emission, extremely high quantum yield, and reversible redox behavior that are characteristic of terfluorene derivatives. LEC devices incorporating terfluorene 1 exhibited deep-blue EL with CIE coordinates of (0.159, 0.115) and (0.151, 0.122) in the absence and presence, respectively, of the ionic liquid (IL) BMIM·PF6. The peak external quantum efficiency and peak power efficiency of 1 in the presence of the IL reached 1.14% and 1.24 lm W−1, respectively. These CIE coordinates are the most saturated blue emissions ever reported for LECs.
Introduction
Solid state light-emitting electrochemical cells (LECs) possess several advantages over conventional organic light-emitting diodes (OLEDs). In LECs, electrochemically doped regions induced by spatially separated ions under a bias form ohmic contacts with electrodes, resulting in balanced carrier injection and low operating voltages and, consequently, high power efficiencies.1,2 As such, LECs generally require only a single emissive layer, which can be processed readily from solution, and, conveniently, they can feature air-stable electrodes, whereas OLEDs typically require more sophisticated multilayer structures and low-work-function cathodes.3,4
Recently, cationic Ir complexes have been widely explored for their use in LECs because of their high luminescence efficiencies, tunable light emission colors, and high compatibility with ionic electrolytes.5 By tailoring the structures of their chelating ligands, emissions from cationic Ir complexes can cover such a large color range to achieve full-color displays and white light emissions.5b,c,k To date, however, the development of efficient saturated blue-emitting ionic Ir complexes has lagged behind those of other colors. The complexes that have been prepared with large optical band gaps have mainly exhibited emissions in the bluish-green region. Recently, Heet al. reported a blue-emitting cationic Ir complex exhibiting electroluminescence (EL) centered at 460 nm.6 Bolink et al. found that the origin of the large spectral shift in the EL, ranging from 476 to 560 nm, of the blue-emitting cationic Ir complex [Ir(ppy-F2)2Me4phen]PF6 was related to the concentration of the ionic transition metal complex in the thin film.7 The difficulty in effecting color-shifting toward the deep-blue region with Ir-based cationic complexes is mainly due to the intrinsically narrow energy gaps in such cationic complexes relative to those of neutral ones [e.g., Ir(dfppy)2(pic), where dfppy is 2-(2,4-difluorophenyl)pyridine and pic is picolinic acid], thereby limiting the possibility of spectral tuning through molecular design.8 Moreover, thermal population to accessible ligand field states (a possible non-radiative decay pathway) leads to low emission efficiencies, which further restricts the development of blue-emitting cationic Ir complexes.9 Therefore, alternative approaches for the development of saturated blue-emitting materials for the use in LECs remain in high demand to complete the emitting color gap of cationic Ir complexes.
Polyfluorenes (PFs) are widely used as efficient blue emitters in polymer light-emitting diodes (PLEDs) because they generally possess high photoluminescence (PL) quantum efficiencies and high thermal stabilities.10 The rigidity of the coplanar fluorene structure in the conjugated backbone and the flexibility of functionalization on the C9 position have crucial effects on the characteristics and processability of the resulting polymers, as well as modulating their intermolecular interactions when in the form of thin films. LECs based on PF/polyethylene oxide (PEO) mixtures were reported by Yang et al. as early as 1997. Blue-green LECs incorporating an emissive layer blend comprising a PF featuring polyether-type side groups and lithium triflate has achieved an external quantum efficiency (EQE) of 4%.11 In this case, however, the emission resulted mainly from aggregation of PF, shifting the emission wavelength to the green region.12 Although much effort has been exerted to improve the compatibility of the polymer and the ionic electrolytes [e.g., introducing oligo(ethylene glycol) units at the C9 positions of the PF or directly end-capping C9-substituted alkyl chains with ionic species],14 no LECs based on PFs have yet avoided the phenomena of green emission generated from either aggregation or keto defects.10c
In this study, to avoid the intrinsic tendency of aggregation that is widely observed for PF derivatives, we selected members of the terfluorene family—low-molecular-weight analogues of PFs—to realize saturated blue-emitting LECs. Terfluorene derivatives possess emission wavelengths in the deep-blue region with ultra-high luminance quantum yields (close to unity).15 They also exhibit bipolar carrier transport capability (μh, μe > 10−4 cm2 V−1s−1), which is beneficial to device performance.16 Herein, we report the use of a terfluorene-based ionic compound (1) to achieve saturated deep-blue EL from two LEC devices: device I and device II provided Commission Internationale de l'Eclairage (CIE)17 coordinates (x, y) of (0.151, 0.122) and (0.159, 0.115), respectively, extremely close to the blue coordinates (0.14, 0.08) in the NTSC color gamut. We prepared the ionic terfluorene derivative 1 through simple attachment of 1-methylimidazolium moieties to the terminal positions of the alkyl substituents of the central fluorene moiety. It renders a hydrophobic terfluorene core bearing movable anions, enabling the formation of homogeneous films through spin-coating and, consequently, efficient blue-emitting LECs.
Results and discussion
Synthesis
Scheme 1 outlines the synthesis of the ionic compound 1. We obtained the key bromo-substituted intermediate 1-Br in 68% yield after performing a modified one-pot Suzuki coupling18 of 2-bromo-9,9-dihexylfluorene (2)19 with 2,7-dibromo-9,9-bis(6-bromohexyl)fluorene (3).20 We isolated compound 1 in 81% yield after treating 1-Br with an excess of 1-methylimidazole, followed by ion exchange with potassium hexafluorophosphate.
 |
| | Scheme 1 Synthesis of 1. | |
Photophysical properties
Fig. 1 depicts the UV–Vis absorption and PL spectra of 1 in solution (acetonitrile, 10−5 M) and in the form of neat films. Table 1 summarizes the photophysical data. To speed up the device response, the ionic liquid (IL) 1-butyl-3-methylimidazolium hexafluorophosphate (BMIM·PF6) is commonly used as an additive providing additional mobile anions.21 Therefore, we also examined the emission properties of thin films of 1 in the presence of BMIM·PF6 (10 wt%). In solution, 1 exhibits an absorption signal centered at 352 nm, which we assign to the lowest π–π* transition of the terfluorene backbone. In its PL spectrum, 1 reveals intense fluorescence with an emission maximum centered at 393 nm along with vibronic features at ca. 413 and 441 nm and an excellent quantum yield of 100%. These PL features are characteristic of terfluorene derivatives.15 The absorption spectra of neat films of 1 exhibited spectral broadening, possibly due to its wide conformational distribution and a certain degree of intermolecular interactions in the solid state. Nevertheless, no significant emission peaks appeared in the green region in the solid state PL spectra of 1. Instead, we observed only slightly red-shifted emission signals, centered at 417 and 418 nm, which we attribute to an enhanced molecular polarization effect.22 The emission quantum yields of 1 in the form of neat films remained high (up to 0.76) despite the presence of intermolecular interactions. More importantly, the addition of the IL in the neat film did not affect the emission properties of 1. The highly retained PL properties and the high emission quantum yield of 1 in neat film, compared with those of PF derivatives, suggested that 1 would be suitable for use as a deep-blue emitter in LECs.
 |
| | Fig. 1 Absorption (left-hand axis) and PL (right-hand axis) spectra of 1 in MeCN solution (10−5 M) and in neat films in the presence and absence of BMIM·PF6 (10 wt%). | |
Table 1 Physical properties of 1
| |
λ
max,PL (nm)b |
PLQY
c |
E
1/2
ox
(V)d |
E
1/2
red (V)e |
ΔE1/2 (V)f |
| Solutiona |
Film |
Solutiona |
Film |
|
Measured in CH2Cl2 (10−5 M) at room temperature.
PL peak wavelength.
Photoluminescence quantum yields.
Oxidation potential vs.ferrocene/ferrocenium redox couple.
Reduction potential vs.ferrocene/ferrocenium redox couple.
The electrochemical gap E1/2 is the difference between E1/2ox and E1/2red.
0.1 M TBAPF6 in MeCN.
0.1 M TBAP in THF.
|
|
1
|
393 |
418 |
1.00 |
0.76 |
+0.87, +1.02g |
–2.69, −2.89h |
3.56 |
|
1 with 10 wt% BMIM·PF6 |
— |
417 |
— |
0.75 |
— |
— |
— |
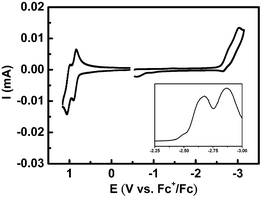
Fig. 2 displays the electrochemical characteristics of 1, as probed using cyclic voltammetry. We observed two discrete reversible oxidation potentials [at 0.87 and 1.02 V (vs.Fc/Fc+)] for 1 in acetonitrile (0.1 M nBu4NPF6 as supporting electrolyte) and two reversible reduction potentials [at −2.69 and −2.89 V (vs.Fc/Fc+)] for 1 in THF (0.1 M nBu4NClO4 as supporting electrolyte). We assign both the oxidation and reduction peaks to electron transfer processes that occurred on the terfluorene backbone, verifying the prominent bipolar carrier transport observed in terfluorene derivatives. The reductions were relatively poorly resolved, with a lower peak current during the positive sweep relative to that of the oxidations, presumably because the pendent imidazolium units could interact with the reduced species and, consequently, retard the diffusion toward the electrode.23 The pronounced potential differences in the oxidation (150 mV) and reduction (200 mV) regions indicate efficient resonance delocalization of the radical cation and the radical anion over the entire terfluorene backbone.
The addition of polar salts into conjugated polymer films can result in the formation of aggregates or phase separation as a result of discrepancies in polarity.24 To study the effect of BMIM·PF6 on the morphology of the neat film of 1, we used atomic force microscopy (AFM) to probe the surface. AFM images of films of 1 on ITO glass substrates, in the presence and absence of BMIM·PF6, exhibited no significant differences (see ESI†), with root-mean-square (RMS) roughness values of 6.44 and 7.79 nm, respectively. At a doping concentration of BMIM·PF6 in 1 of 1![[thin space (1/6-em)]](https://www.rsc.org/images/entities/char_2009.gif) :1.77 (molar ratio), we observed no particular aggregation features or phase separation, giving uniform spin-coated thin films. The comparable roughness values for the two samples indicate the high compatibility between 1 and the added salt, presumably imparted by the ionic nature of 1. Remarkably, the composite thin film of 1 in the presence of BMIM·PF6 did not exhibit particular emission quenching: the emission quantum yield was comparable with that of the thin film of 1 formed in the absence of BMIM·PF6 (Table 1).
:1.77 (molar ratio), we observed no particular aggregation features or phase separation, giving uniform spin-coated thin films. The comparable roughness values for the two samples indicate the high compatibility between 1 and the added salt, presumably imparted by the ionic nature of 1. Remarkably, the composite thin film of 1 in the presence of BMIM·PF6 did not exhibit particular emission quenching: the emission quantum yield was comparable with that of the thin film of 1 formed in the absence of BMIM·PF6 (Table 1).
Electroluminescence
The promising physical properties of the ionic terfluorene 1 rendered it suitable for LEC applications. Table 2 summarizes the device characteristics of structures having the configuration glass substrate/ITO/poly(3,4-ethylenedioxythiophene):poly(styrene sulfonate) (PEDOT:PSS, 30 nm)/emissive layer (ca. 200 nm)/Al (100 nm), where the emissive layer was a film of compound 1 for device I and a film of compound 1 containing 10 wt% BMIM·PF6 for device II. In device II, we added BMIM·PF6 to enhance the ionic conductivity.21 Measurements of both device properties were performed under constant bias voltages.
Table 2
LEC device characteristics
| Device |
Bias voltage (V) |
λ
max,EL (nm)a |
CIE (x, y)b |
t
max (min)c |
L
max (cd m−2)d |
η
ext,max (%)e |
η
p,max
(lm W−1)f |
Lifetime (min)g |
|
EL peak wavelength.
CIE coordinates of EL spectra.
Time required to reach the maximal brightness.
Maximal brightness achieved at a constant bias voltage.
Maximal external quantum efficiency achieved at a constant bias voltage.
Maximal power efficiency achieved at a constant bias voltage.
The time for the brightness of the device to decay from the maximum to half of the maximum under a constant bias voltage.
|
|
I
|
3.4 |
424 |
(0.151, 0.122) |
161 |
0.31 |
1.04 |
0.63 |
462 |
| 3.8 |
62 |
1.48 |
0.99 |
0.52 |
156 |
| 4.2 |
35 |
2.43 |
0.69 |
0.31 |
78 |
|
II
|
3.2 |
423 |
(0.159, 0.115) |
51 |
0.34 |
1.14 |
1.24 |
427 |
| 3.4 |
30 |
0.52 |
1.03 |
0.72 |
211 |
| 3.6 |
11 |
1.69 |
0.77 |
0.47 |
49 |
Fig. 3 compares the EL spectra of the LEC devices after 0.5 h of operation with the PL spectra of their emissive layers. The similarity of the EL spectra of both devices indicates that the addition of BMIM·PF6 did not alter the EL of 1. Notably, the signals in the EL spectra are broadened relative to those in the PL spectra. The longer emission wavelengths (450–500 nm) were significantly enhanced under electrical driving; presumably, this spectral change is primarily related to thermal rearrangement of the molecules and, consequently, the enhanced formation of intermolecular excimer species.25 Possibly because of its shorter conjugation length, the excimer EL emission band of the ionic terfluorene 1 was, however, predominantly centered in the sky-blue region (Fig. 3), whereas LECs based on PF derivatives13,14 or copolymers containing crown ether spacers26 exhibit significant green or yellow interchain excimer emissions. Therefore, the LEC devices based on 1 retained their deep-blue EL emissions, with CIE coordinates for the EL signals of devices I and II of (0.151, 0.122) and (0.159, 0.115), respectively. The inset to Fig. 4 reveals that the CIE coordinates of the EL signals for both LEC devices approached the blue apex of the National Television System Committee (NTSC) color gamut—indeed, they are the bluest EL emissions ever to have been reported for blue LECs.6,7,27 Thus, the ionic terfluorene 1 is a promising candidate for use as a deep-blue emitting material in LECs. To check potential spectral shifts of EL over the device lifetime, the EL spectra after 5 h of continuous operation for device I under 3.8 V and device II under 3.4 V are also shown in Fig. 3. It is noted that only slightly broadened EL spectra were observed after a long operation time at which the brightness decreased to lower than half of the peak value (Fig. 4). Such a result indicates that the ionic terfluorene 1 exhibits stable EL spectrum during electrical driving.
 |
| | Fig. 3
EL spectra of device I under 3.8 V (circle) and device II under 3.4 V (square) after 0.5 h (open symbol) and 5 h (solid symbol) of operation. PL spectra of the emissive layers are presented for comparison. Inset: CIE coordinates of the EL and PL spectra. | |
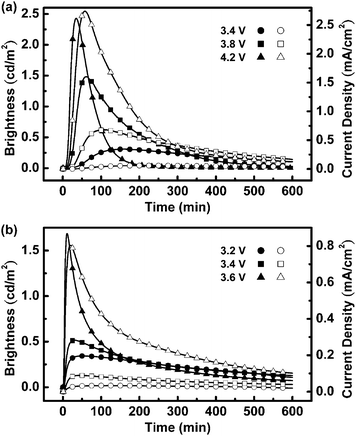 |
| | Fig. 4 Brightness (solid symbols) and current density (open symbols) plotted with respect to time under a constant bias voltage of (a) 3.4–4.2 V for device I and (b) 3.2–3.6 V for device II. | |
Fig. 4 presents the time-dependent brightness and current densities of devices I and II when operated under various bias voltages. The driving voltages were chosen to be close to the energy gap of 1 (3.56 eV in solution, Table 1) to improve the device stability.5f Since the energy gaps in films are usually smaller than those in solution because of environmental polarization, LEC devices based on 1 can be turned on at a bias voltage as low as 3.2 V (Fig. 4). Brightness and current densities of LEC devices based on 1 under lower bias voltages consequently show relative lower values. These LEC devices exhibited similar electrical characteristics. The brightness and device current first increased with time after the bias was applied, reaching maximum values before undergoing gradual decreases over time. The time required for the brightness to reach its maximum value decreased as the bias voltage increased (Table 2), presumably because a higher accumulation rate of mobile ions facilitated the formation of doped regions under a higher electric field. Under the same bias voltage, device II required a significantly shorter time for its brightness to reach the maximum value relative to that of device I (e.g., 30 and 161 min, respectively, at 3.4 V). This result indicates that the additional mobile ions provided by the electrolyte BMIM·PF6 increased the rate of accumulation of ions near the electrodes, leading to accelerated formation of doped regions. The decreases in brightness and current densities over time after reaching the maximum values are associated with degradation of the emissive material during LEC operation. The maximum brightness and current density obtained in the first measurement were not fully recoverable in subsequent measurements, even under the same driving conditions. Under a constant bias, the lifetime of each device, defined as the time required for the brightness of the device to decay from the maximum value to half of the maximum value, decreased upon increasing the bias voltage. For instance (Table 2), the lifetime of device I (device II) decreased from 462 to 78 min (427 to 49 min) upon increasing the bias voltage from 3.4 to 4.2 V (from 3.2 to 3.6 V). We suspect that the higher current density induced by a higher bias voltage led to a higher rate of irreversible multiple oxidation and subsequent decomposition of the emissive material,21,28 thereby accelerating the degradation of the LEC devices. Similarly, device II, which exhibited higher current densities induced by more mobile ions, had shorter lifetimes than device I under the same bias voltage (Table 2).
Fig. 5 presents the time-dependent EQEs and corresponding power efficiencies of devices I and II operated under various bias voltages. Both devices exhibited similar time evolutions of their EQEs. Immediately after a forward bias was applied, the EQE was rather low because of unbalanced carrier injection. During the formation of the doped regions near the electrodes, the balance of the carrier injection was improved and, accordingly, the EQE of the device increased rapidly. The peak EQE and peak power efficiency were 1.04% and 0.63 lm W−1, respectively, for device I under 3.4 V and 1.14% and 1.24 lm W−1, respectively, for device II under 3.2 V. The EQEs (∼1%) of fluorescent LEC devices based on 1 are lower than the upper limits (∼3.8%) that one would expect from the photoluminescence quantum yields (PLQYs) of neat films of 1 (0.76, Table 1), when considering an optical out-coupling efficiency of ca. 20% from a typical layered light-emitting device structure and ∼25% singlet state population. Such results may mainly result from imperfect carrier balance of neat films of 1. Addition of BMIM·PF6 (device II) decreased the operating voltage and, therefore, increased the power efficiency relative to that of the parent neat-film device (device 1). Thus, LEC devices based on 1 can exhibit deep-blue EL emission and moderate device efficiencies, making them potential candidates for use in full-color power-effective displays.
 |
| | Fig. 5
EQE (solid symbols) and power efficiency (open symbols) plotted with respect to time under a constant bias voltage of (a) 3.4–4.2 V for device I and (b) 3.2–3.6 V for device II. | |
Conclusions
We have synthesized an efficient deep-blue-emitting terfluorene derivative, 1, that allows the realization of saturated deep-blue-emitting LECs. We achieved the essential ionic character required for LECs by chemically tethering methylimidazolium moieties as pendent groups to the terfluorene. The introduction of these methylimidazolium moieties not only allowed uniformly spin-coated thin films to be formed (without particular aggregation features or phase separation) in either the absence or presence of the IL BMIM·PF6 but also retained the attractive characteristics (deep-blue emission, extremely high quantum yield, reversible redox behavior) of terfluorene derivatives. An LEC device incorporating a neat film of 1 achieved a deep-blue EL emission centered at 424 nm with CIE coordinates of (0.151, 0.122), an EQE of 1.04%, and a peak power efficiency of 0.63 lm W−1 under 3.4 V. Incorporating the IL BMIM·PF6 in the emitting layer of device II increased the accumulation rate of mobile ions near the electrodes, leading to accelerated formation of doped regions. The highest peak EQE and power efficiency of device II were 1.14% and 1.24 lm W−1, respectively, at 3.2 V. The CIE coordinates of the EL signals from these two devices approached the blue apex of the NTSC color gamut—notably, these values represent the bluest EL emissions ever obtained from LECs.
Experimental section
General experiments
1H and 13C NMR spectra of compounds were recorded at room temperature using a 400 MHz spectrometer. Photophysical characteristics of complexes in solutions were recorded at room temperature using 10−5 M MeCN solutions of all compounds, which were carefully purged with N2 prior to measurements. The neat and BMIM·PF6-blended films for PL studies were spin-coated onto quartz substrates from MeCN solutions. The thickness of each spin-coated film was ca. 200 nm, as measured using profilometry. UV–Vis absorption spectra were recorded using a Hitachi U2800A spectrophotometer. PL spectra were recorded using a Hitachi F9500 fluorescence spectrophotometer. PLQYs for solution and thin-film samples were determined using a calibrated integrating sphere system (Hamamatsu C9920). Oxidation and reduction potentials of 1 were determined using cyclic voltammetry (CV); a CH Instruments model 619B electrochemical analyzer was operated at a scan rate of 100 mV s−1 using either an MeCN or THF solution (1.0 mM). A glassy carbon electrode and a Pt wire were used as the working and counter electrodes, respectively. All potentials were recorded versus the Ag/AgCl (saturated) reference electrode and calibrated with the ferrocene/ferrocenium redox couple (reversible oxidation potential at 0.44 V in ACN and 0.56 V in THF). Oxidation CV was performed using 0.1 M tetra-n-butylammonium hexafluorophosphate (TBAPF6) in MeCN as the supporting electrolyte; for reduction CV, 0.1 M tetra-n-butylammonium perchlorate (TBAP) in THF was used as the supporting electrolyte. AFM images of films of 1 spin-coated onto PEDOT:PSS/ITO glass in the presence and absence of BMIM·PF6 were obtained using a scanning probe microscope (Nano Navi L-trace II) operated in tapping mode.
2,7-Bis(9,9-dihexylfluorene-2-yl)-9,9-bis(6-bromohexyl)fluorene (1-Br).
A mixture of 2-bromo-9,9-dihexylfluorene (860 mg, 2.08 mmol), bis(pinacolato)diborane (528 mg, 2.08 mmol, donated by Frontier Scientific), bis(dibenzylideneacetone)palladium(0) (24 mg, 0.04 mmol), biphenyl-2-yl-dicyclohexylphosphane (58 mg, 0.16 mmol), potassium acetate (408 mg, 4.16 mmol), and dioxane (7 mL) was heated under reflux for 2 h. A solution of 2,7-dibromo-9,9-bis(6-bromohexyl)fluorene (650 mg, 1.00 mmol) and potassium phosphate (2.12 g, 10 mmol) in dioxane (2 mL) and deionized water (2 mL) was added and the resulting mixture was heated under reflux for an additional 30 min. After rotary evaporation of the dioxane, the aqueous mixture was extracted with CH2Cl2 and the combined extracts were dried (MgSO4) and evaporated. The crude product was purified through column chromatography (SiO2; CHCl3/hexane, 1:6) to afford 1-Br (786 mg, 68%) as a sticky colorless liquid. 1H NMR (CDCl3, 400 MHz) δ 7.82 (d, J = 8.0 Hz, 2H), 7.79 (d, J = 8.0 Hz, 2H), 7.74 (d, J = 8.0 Hz, 2H), 7.69–7.62 (m, 8H), 7.38–7.30 (m, 6H), 3.28 (t, J = 6.4 Hz, 4H), 2.12 (quin, J = 4.0, 4H), 2.07–2.02 (m, 8H), 1.69 (quin, J = 6.4 Hz, 4H), 1.26 (quin, J = 8.0 Hz, 4H), 1.20–1.08 (m, 28H), 0.87–0.70 (m, 24H); 13C NMR (CDCl3, 100 MHz) δ 151.3, 151.2, 150.8, 140.6, 140.5, 140.3, 140.1, 139.8, 126.9, 126.7, 126.2, 125.9, 122.8, 121.2, 119.9, 119.8, 119.6, 55.3, 55.2, 40.4, 40.3, 34.0, 32.7, 31.6, 29.8, 29.2, 27.9, 23.9, 23.8, 22.7, 14.2; HRMS (m/z, ESI+) calcd for C75H9679Br2 1154.5879, found 1154.5894; calcd for C75H9679Br81Br 1156.5858, found 1156.5863; calcd for C75H9681Br2 1158.5838, found 1154.5857.
2,7-Bis(9,9-dihexylfluorene-2-yl)-9,9-bis[6-(3-methylimidazolium)hexyl]fluorene bis(hexafluorophosphate) (1).
A solution of 2,7-bis(9,9-dihexylfluorene-2-yl)-9,9-bis(6-bromohexyl)fluorene (780 mg, 0.670 mmol) and 1-methylimidazole (0.124 mL, 1.55 mmol) in toluene (2 mL) was heated under reflux for 16 h. After cooling, the reaction mixture was concentrated and then a solution of KPF6 (700 mg, 3.80 mmol) in water (30 mL) was added. The mixture was stirred for 10 min and then the product was extracted with CH2Cl2 (5 × 10 mL); the combined extracts were dried (MgSO4) and concentrated under rotary evaporation; the residue was then dried under vacuum (0.5 Torr) at room temperature to yield 1 (820 mg, 81%) as a pale yellow solid. 1H NMR (DMSO-d6, 400 MHz) δ 8.91 (s, 2H), 7.93 (d, J = 8.0 Hz, 2H), 7.88 (d, J = 8.0 Hz, 2H), 7.84–7.82 (m, 6H), 7.77 (d, J = 8.0 Hz, 2H), 7.74 (d, J = 8.0 Hz, 2H), 7.57–7.56 (m, 4H), 7.44 (dd, J = 8.0, 2.8 Hz, 2H), 7.33 (t, J = 2.8 Hz, 4H), 3.96 (t, J = 7.2 Hz, 4H), 3.73 (s, 6H), 2.14–1.99 (m, 12H), 1.54 (quin, J = 7.2 Hz, 4H), 1.09–0.97 (m, 32H), 0.70 (t, J = 7.2 Hz, 12H), 0.58–0.55 (m, 12H); 13C NMR (DMSO-d6, 100 MHz) δ 151.6, 151.5, 150.8, 140.6, 140.4, 140.0, 139.7, 139.5, 136.7, 127.6, 127.3, 126.2, 126.1, 123.9, 123.3, 122.5, 121.1, 120.8, 120.6, 120.3, 55.4, 55.2, 49.1, 36.0, 31.3, 31.2, 29.8, 29.4, 29.2, 25.9, 24.1, 23.7, 22.2, 14.1; HRMS (m/z, ESI+) calcd for C83H108N4 1160.8563, found 1160.8575.
Fabrication and characterization of LEC devices
ITO-coated glass substrates were cleaned and treated with UV/ozone prior to use. A PEDOT:PSS layer was spin-coated onto the ITO substrate in air and then the structure was baked at 150 °C for 30 min. For device I, the emissive layer (ca. 200 nm) was spin-coated from an MeCN solution of 1. To reduce the turn-on time of the LEC device, the IL BMIM·PF6 was added to enhance the ionic conductivity of the thin film of 1.21 For device II, the emissive layer was spin-coated from a mixed MeCN solution containing a mass ratio of 1:BMIM·PF6 = 0.9:0.1. All solution preparing and spin-coating processes were carried out under ambient conditions. After spin-coating the emissive layer, the samples were baked at 70 °C for 10 h in a nitrogen glove box (oxygen and moisture levels below 1 ppm) and then subjected to thermal evaporation of a 100-nm-thick Al top contact in a vacuum chamber (ca. 10−6 Torr). The electrical and emission characteristics of the LEC devices were measured using a source-measurement unit and a Si photodiode calibrated with a Photo Research PR-650 spectroradiometer. All device measurements were performed under a constant bias voltage in a nitrogen glove box. EL spectra of LEC devices were recorded using a calibrated CCD spectrograph.
Notes and references
- Q. Pei, G. Yu, C. Zhang, Y. Yang and A. J. Heeger, Science, 1995, 269, 1086 CrossRef CAS.
- Q. Pei, Y. Yang, G. Yu, C. Zhang and A. J. Heeger, J. Am. Chem. Soc., 1996, 118, 3922 CrossRef CAS.
- C. W. Tang and S. A. Van Slyke, Appl. Phys. Lett., 1987, 51, 913 CrossRef CAS.
- C. W. Tang, S. A. Van Slyke and C. H. Chen, Appl. Phys. Lett., 1989, 65, 3610 CAS.
-
(a) J. D. Slinker, A. A. Gorodetsky, M. S. Lowry, J. J. Wang, S. Parker, R. Rohl, S. Bernhard and G. G. Malliaras, J. Am. Chem. Soc., 2004, 126, 2763 CrossRef CAS;
(b) A. B. Tamayo, S. Garon, T. Sajoto, P. I. Djurovich, I. M. Tsyba, R. Bau and M. E. Thompson, Inorg. Chem., 2005, 44, 8723 CrossRef CAS;
(c) M. S. Lowry, W. R. Hudson, R. A. Pascal, Jr and S. Bernhard, J. Am. Chem. Soc., 2004, 126, 14129 CrossRef CAS;
(d) H.-C. Su, C.-C. Wu, F.-C. Fang and K.-T. Wong, Appl. Phys. Lett., 2006, 89, 261118 CrossRef;
(e) H. J. Bolink, L. Cappelli, E. Coronado, M. Grätzel, E. Ortí, R. D. Costa, P. M. Viruela and M. K. Nazeeruddin, J. Am. Chem. Soc., 2006, 128, 14786 CrossRef CAS;
(f) H.-C. Su, F.-C. Fang, T.-Y. Hwu, H.-H. Hsieh, H.-F. Chen, G.-H. Lee, S.-M. Peng, K.-T. Wong and C.-C. Wu, Adv. Funct. Mater., 2007, 17, 1019 CrossRef CAS;
(g) H.-C. Su, H.-F. Chen, F.-C. Fang, C.-C. Liu, C.-C. Wu, K.-T. Wong, Y.-H. Liu and S.-M. Peng, J. Am. Chem. Soc., 2008, 130, 3413 CrossRef CAS;
(h) S. Graber, K. Doyle, M. Neuburger, C. E. Housecroft, E. C. Constable, R. D. Costa, E. Ortí, D. Repetto and H. J. Bolink, J. Am. Chem. Soc., 2008, 130, 14944 CrossRef CAS;
(i) H. J. Bolink, E. Coronado, R. D. Costa, E. Ortí, M. Sessolo, S. Graber, K. Doyle, M. Neuburger, C. E. Housecroft and E. C. Constable, Adv. Mater., 2008, 20, 3910 CrossRef CAS;
(j) T. H. Kwon, Y. H. Oh, I. S. Shin and J. I. Hong, Adv. Funct. Mater., 2009, 19, 711 CrossRef CAS;
(k) M. S. Lowry and S. Bernhard, Chem.–Eur. J., 2006, 12, 7970 CrossRef CAS.
- L. He, L. Duan, J. Qiao, R. Wang, P. Wei, L. Wang and Y. Qiu, Adv. Funct. Mater., 2008, 18, 2123 CrossRef CAS.
- H. J. Bolink, L. Cappelli, S. Cheylan, E. Coronado, R. D. Costa, N. Lardiés, M. K. Nazeeruddin and E. Ortí, J. Mater. Chem., 2007, 17, 5032 RSC.
-
(a) K. A. King and R. J. Watts, J. Am. Chem. Soc., 1987, 109, 1589 CrossRef CAS;
(b) S. Lamansky, P. Djurovich, D. Murphy, F. A. Razzaq, R. Kwong, I. Tsyba, M. Bortz, B. Mui, R. Bau and M. E. Thompson, Inorg. Chem., 2001, 40, 1704 CrossRef CAS.
- T. Sajoto, P. I. Djurovich, A. Tamayo, M. Yousufuddin, R. Bau and M. E. Thompson, Inorg. Chem., 2005, 44, 7992 CrossRef CAS.
-
(a) Q. Pei and Y. Yang, J. Am. Chem. Soc., 1996, 118, 7416 CrossRef CAS;
(b) A. W. Grice, D. D. C. Bradley, M. T. Bernius, M. Inbasekaran, W. W. Wu and E. P. Woo, Appl. Phys. Lett., 1998, 73, 629 CrossRef CAS;
(c) U. Scherf and E. J. W. List, Adv. Mater., 2002, 14, 477 CrossRef CAS.
- Y. Yang and Q. B. Pei, J. Appl. Phys., 1997, 81, 3294 CrossRef CAS.
- T. Ouisse, M. Armand, Y. Kervella and O. Stéphan, Appl. Phys. Lett., 2002, 81, 3131 CrossRef CAS.
-
(a) Y. Yang and Q. Pei, J. Appl. Phys., 1997, 81, 3294 CrossRef CAS;
(b) M. Sun, C. Zhong, F. Li, Y. Cao and Q. Pei, Macromolecules, 2010, 43, 1714 CrossRef CAS;
(c) J.-I. Lee, D.-H. Hwang, H. Park, L.-M. Do, H. Y. Chu, T. Zyung and R. D. Miller, Synth. Met., 2000, 111, 195 CrossRef;
(d) O. Stéphan, V. Collomb, J. Vial and M. Armand, Synth. Met., 2000, 113, 257 CrossRef CAS.
- D. Vak, S.-H. Oh and D.-Y. Kim, Appl. Phys. Lett., 2009, 94, 243305 CrossRef.
-
(a) K.-T. Wong, Y.-Y. Chien, R.-T. Chen, C.-F. Wang, Y.-T. Lin, H.-H. Chiang, P.-Y. Hsieh, C.-C. Wu, C. H. Chou, Y. O. Su, G.-H. Lee and S.-M. Peng, J. Am. Chem. Soc., 2002, 124, 11576 CrossRef CAS;
(b) K.-T. Wong, R.-T. Chen, F.-C. Fang, C.-C. Wu and Y.-T. Lin, Org. Lett., 2005, 7, 1979 CrossRef CAS.
-
(a) C.-C. Wu, T.-L. Liu, W.-Y. Hung, Y.-T. Lin, K.-T. Wong, R.-T. Chen, Y.-M. Chen and Y.-Y. Chien, J. Am. Chem. Soc., 2003, 125, 3710 CrossRef CAS;
(b) C.-C. Wu, W.-G. Liu, W.-T. Hung, T.-L. Liu, Y.-T. Lin, H.-W. Lin, K.-T. Wong, Y.-Y. Chien, R.-T. Chen, T.-H. Hung, T.-C. Chao and Y.-M. Chen, Appl. Phys. Lett., 2005, 87, 052103 CrossRef.
-
Colorimety, Commission Internationale de l'Eclairage (CIE), Paris, 1986 Search PubMed.
- K. L. Billingsley, T. E. Barder and S. L. Buchwald, Angew. Chem., Int. Ed., 2007, 46, 5359 CrossRef CAS.
- G. Saikia and P. K. Iyer, J. Org. Chem., 2010, 75, 2714 CrossRef CAS.
- K.-Y. Pu, Z. Fang and B. Liu, Adv. Funct. Mater., 2008, 18, 1321 CrossRef CAS.
- S. T. Parker, J. D. Slinker, M. S. Lowry, M. P. Cox, S. Bernhard and G. G. Malliaras, Chem. Mater., 2005, 17, 3187 CrossRef CAS.
- V. Bulovic, A. Shoustikov, M. A. Baldo, E. Bose, V. G. Kozlov, M. E. Thompson and S. R. Forrest, Chem. Phys. Lett., 1998, 287, 455 CrossRef CAS.
- H.-C. Su, H.-F. Chen, C.-C. Wu and K.-T. Wong, Chem.–Asian J., 2008, 3, 1922 CrossRef CAS.
-
(a) C. Yang, Q. Sun, J. Qiao and Y. Li, J. Phys. Chem. B, 2003, 107, 12981 CrossRef CAS;
(b) L. Edman, M. Pauchard, D. Moses and A. J. Heeger, J. Appl. Phys., 2004, 95, 4357 CrossRef CAS;
(c) F. P. Wenzl, P. Pachler, C. Suess, A. Haase, E. J. W. List, P. Poelt, D. Somitsch, P. Knoll, U. Scherf and G. Leising, Adv. Funct. Mater., 2004, 14, 441 CrossRef CAS.
- J.-P. Choi, K.-T. Wong, Y.-M. Chen, J.-K. Yu, P.-T. Chou and A. J. Bard, J. Phys. Chem. B, 2003, 107, 14407 CrossRef CAS.
- Q. Sun, H. Wang, C. Yang and Y. Li, J. Mater. Chem., 2003, 13, 800 RSC.
-
(a) M. Mydlak, C. Bizzarri, D. Hartmann, W. Sarfert, G. Schmid and L. De Cola, Adv. Funct. Mater., 2010, 20, 1812 CAS;
(b) J. He, J. Qiao, L. Duan, G. Dong, D. Zhang, L. Wang and Y. Qiu, Adv. Funct. Mater., 2009, 19, 2950 CrossRef CAS;
(c) L. He, L. Duan, J. Qiao, G. Dong, L. Wang and Y. Qiu, Chem. Mater., 2010, 22, 3535 CrossRef CAS;
(d) M. K. Nazeeruddin, R. T. Wegh, Z. Zhou, C. Klein, Q. Wang, F. De Angelis, S. Fantacci and M. Grätzel, Inorg. Chem., 2006, 45, 9245 CrossRef.
- Y. Ohsawa, S. Sprouse, K. A. King, M. K. DeArmond, K. W. Hanck and R. J. Watts, J. Phys. Chem., 1987, 91, 1047 CrossRef CAS.
Footnote |
| † Electronic supplementary information (ESI) available: AFM images of films of 1 on ITO glass substrates in the presence and absence of BMIM·PF6. See DOI: 10.1039/c0jm03446k |
|
| This journal is © The Royal Society of Chemistry 2011 |
Click here to see how this site uses Cookies. View our privacy policy here.