 Open Access Article
Development of DRC-ICP-MS methodology for the rapid determination of 58Fe erythrocyte incorporation in human iron absorption studies
Nuno
Faria
*a,
Peter David
Winship
a,
Dominik Jacob
Weiss
b,
Barry James
Coles
b,
Ronny
Schoenberg
c,
Carol
Hutchinson
a,
Dora Isabel Amaral
Pereira
a and
Jonathan Joseph
Powell
a
aMRC Human Nutrition Research, 120 Fulbourn Road, CB1 9NL, Cambridge, UK. E-mail: Nuno.Faria@mrc-hnr.cam.ac.uk
bDepartment of Earth Science and Engineering, Imperial College, SW7 2BP, London, UK
cDepartment of Geosciences, University of Tübingen, Wilhemstrasse 56, 72074, Tübingen, Germany
First published on 30th June 2011
Abstract
Iron deficiency is the only major nutritional deficiency that still exists in the developed world and iron deficiency anaemia affects nearly one billion people worldwide (Benoist et al., Worldwide prevalence on anaemia 1993–2005, WHO, 2008). However, iron supplements are still not optimally formulated so cheap, side effect-free and well absorbed iron supplements are sought. The development of these requires the determination of iron absorption in animals, volunteers or patients, typically by determining iron isotopic enrichment in blood after administering isotopically labelled iron supplements. Current analytical techniques for isotope ratio work, such as thermal ionisation mass spectrometry (TIMS) and multi-collector inductively coupled plasma mass spectrometry (MC-ICP-MS), have a low throughput, due to the requirements of sample pre-treatment and, generally, are not present in clinical or nutritional laboratories. Here we describe a novel, more accessible, dynamic reaction cell inductively coupled plasma mass spectrometry (DRC-ICP-MS) method for the determination of 58Fe enrichment in samples from nutritional or clinical studies. This is a high throughput method, in which the samples require no pre-treatment other than dilution, that was validated against MC-ICP-MS, and was shown to be fit-for-purpose.
Introduction
Despite many years of investigation, iron supplements are still not optimally formulated. Generally they rely upon simple ferrous salts which undergo redox cycling in the gut following ingestion and lead to side effects (typically nausea and abdominal pain). Alternatively, ferric iron preparations may be used but these are either poorly absorbed or expensive. Thus, work continues, such as in our laboratory, to identify cheap, side effect-free and well absorbed forms of iron for oral supplementation. Indeed, iron deficiency anaemia affects nearly one billion people worldwide1 and iron deficiency is the only major nutritional deficiency that still exists in the developed world.2One key assay in nutritional or clinical studies that assess iron supplements or fortificants is an ‘absorption and utilisation’ test. Absorption means systemic uptake (i.e. across the gut not just into the gut) and utilisation, in this context, means the loading of iron into haemoglobin. The gold standard test in humans requires the ingestion of isotopic iron and then the measurement of isotopic enrichment in haemoglobin (washed red cells or whole blood even) 14 days (d14) after oral ingestion in comparison to baseline (d0), which is immediately pre-ingestion. These days, stable isotopes, especially 58Fe and 57Fe are used to avoid any radio-isotopic exposure to the subject. Traditionally, thermal ionisation mass spectrometry (TIMS) has been the reference technique for tracer experiments but it requires lengthy sample pre-treatment procedures, which result in very low throughput and, subsequently, high costs. More recently, multi-collector inductively coupled plasma mass spectrometry (MC-ICP-MS)3,4 has also been used for high precision isotope measurements in blood but, although it allows higher sample throughput than TIMS, it still requires significant sample pre-treatment. Also, like TIMS, it is a specialist instrumentation restricted to the determination of isotopic ratios, and is in very few clinical or nutritional laboratories. A fit-for-purpose assay for the assessment of oral iron absorption should (a) be able to measure whole blood isotopic iron with minimal handling/pre-treatment of the sample, thus allowing a reasonably high throughput without high staff costs, (b) be able to measure isotopic iron enrichment in blood that corresponds to ≥ 5% intestinal absorption after an oral dose, as much less than this would be considered of little value clinically or nutritionally and (c) use instrumentation that is available in most specialist laboratories, not prohibitively expensive, and has a reasonable sample throughput. Conveniently, the incorporation of dynamic reaction cells (DRC) into traditional quadrupole inductively coupled plasma mass spectrometry (ICP-MS) instruments has allowed accurate quantification of isotopes, such as Fe isotopes (and especially 58Fe),5 that were previously inaccessible to ICP-MS due to polyatomic interferences. DRC-ICP-MS, although, not as sensitive, or likely precise and accurate, as MC-ICP-MS for isotope ratio work, is robust, provides a very high throughput and, importantly, is commonly present in clinical and nutritional laboratories carrying out elemental analyses. Previous studies have shown, using basic aqueous fluids which included a simplified ‘model’ serum, that 58Fe can be readily assayed in such samples using DRC-ICP-MS technology.5 We, however, applied this technique to the determination of 58Fe enrichment in actual whole blood samples of volunteers given 58Fe labelled iron supplements and, here, we report on the optimised methodology and validation against the reference technique, MC-ICP-MS. We have also made comparative analyses with sector field inductively coupled plasma mass spectrometry (SF-ICP-MS) as, to date, this technique has been the most widely used in nutritional studies of isotopic iron absorption.6,7
Experimental
Sample collection
Several whole blood samples were collected from healthy volunteers at the MRC-Human Nutrition Research Unit (ethical approval given by the Cambridge Research Ethics Committee, UK). These were pooled into a single sample and used as an in house quality control whole blood.Whole blood was collected from iron-deficient volunteers participating in an Fe absorption study at the MRC-Human Nutrition Research Unit (ethical approval given by the Suffolk Research Ethics Committee, UK). Baseline whole blood samples (d0 blood) were collected immediately prior to administration of a 60 mg Fe oral supplement labelled with 2 mg 58Fe, and a second blood sample was collected 14 days after administration (d14 blood). This is a typical protocol that determines iron incorporation into red blood cells and thus gives a direct measure of absorption and bioavailability.
Specifics of the DRC-ICP-MS methodology
Instrument conditions were tuned for optimum signal sensitivity (via the measurement of 24Mg, 115In and 238U isotopes), minimum oxide formation (via the measurement of the 140Ce and 156Gd isotopes, i.e. monitoring the degree of CeO formation at m/z = 156) and minimum doubly charged ion formation (via the measurement of the 138Ba and 69Ga isotope signals, i.e. monitoring the degree of 138Ba2+ formation at m/z = 69). Further adjustment was then performed to reduce mass bias between 58Fe and 57Fe (approximately 5%). Detector voltages were optimised to minimise, but not fully correct, mass bias. Thus, the measurements carried a systematic bias that was consistent within sample pairs (d0 vs. d14) which were analysed consecutively, that was cancelled out when calculating the ratio-difference between the two samples. Instrument conditions are described in Table 1.
| Instrumental Parameter and Unit | Value |
|---|---|
| Nebuliser Gas Flow (L min−1) | 0.90–0.93 |
| Sample injection rate (mL min−1) | 1.0 |
| Plasma Gas Flow Rate (L min−1) | 15 |
| Auxiliary Gas Flow Rates (L min−1) | 1.2 |
| RF Power (W) | 1100 |
| Lens Voltage (V) | 8–12 |
| Sweeps Per Reading | 20 |
| Readings Per Replicate | 1 |
| Number of Replicates | 80 |
| Dwell Time (ms) | 50 |
| Integration Time (ms) | 1000 |
| DRC gas Argon/5% H2 (mL min−1) | 0.3 |
| RPa | 0 |
| Rpq | 0.45 |
Comparative ICP techniques
Calculations
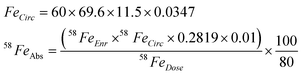
For the purpose of later discussion we have assumed a mildly anaemic (haemoglobin of 11.5g/dL) female subject of 60 kg weight, and 58Fe absorption (58FeAbs, %) was calculated from 58Fe enrichment (58FeEnr, %) of whole blood (i.e. haemoglobin incorporation), according to the following equations:Where FeCirc is total iron circulating in whole-blood (mg) and 58FeDose is the mass of 58Fe tracer given (mg). It was assumed that the subject had 69.6 mL blood per kg body weight,12 3.47 mg iron per g haemoglobin, and 0.2819% as the natural abundance of 58Fe.13 100/80 is a standard assumption, that of the iron absorbed following ingestion (day 0), 80% is incorporated into haemoglobin by day 14.14
Results and discussion
The analytical development described here was driven by need for (i) high throughput and (ii) fit-for-purpose analyses of blood samples from 58Fe tracer studies. Since sample pre-treatment is typically the bottleneck to analytical throughput, we performed the analysis on whole blood samples that had received no treatment other than dilution. The accurate measurement of isotopes by ICP-MS may be hindered by isobaric interferences, namely overlapping isotopes or polyatomic ion interferences that originate from the plasma gas or components of the sample matrix. In the case of 57Fe and 58Fe isotopes in whole blood there is the potential for interference from argon-based and calcium-based polyatomic ions (e.g.40Ar16O1H+ and 40Ca16O1H+ for the measurement of 57Fe and 40Ar18O+ and 42Ca16O+ for the measurement of 58Fe) and an isobaric interference from 58Ni.15 However, under dynamic reaction cell (DRC) conditions (Ar/H2 reaction gas flow = 0.3 ml min−1, RPa = 0 and RPq = 0.45) the argon based interferences can be attenuated. The isobaric interference by 58Ni was not corrected in the DRC analyses since this isotope is found at approximately 0.07 ppb in blood16 whereas 58Fe is at 1400 ppb (500 ppm total Fe is a fairly typical value) and, thus, 58Ni represents a negligible 0.005% of the total 58 m/z, that would affect both samples (d0 and d14) similarly. Furthermore, other than dilution, no sample pre-treatment steps were required (e.g.NaOH precipitation and ion-exchange separation), which are known to be main sources of Ni contamination.17 Although whole blood is a rich source of calcium (80 to 90 mg l−1), signal interference from calcium-based polyatomic ions was also negligible under the conditions described here: Fig. 1 shows that the m/z = 57 and 58 signals from a sample diluent blank or a diluent blank spiked with 85 mg l−1 Ca are similarly negligible when compared to signal from a diluted whole blood sample. Thus, under the DRC conditions described, and on a fit-for-purpose basis, there is no significant argon-based polyatomic ion or calcium-based interference on either 57Fe or 58Fe.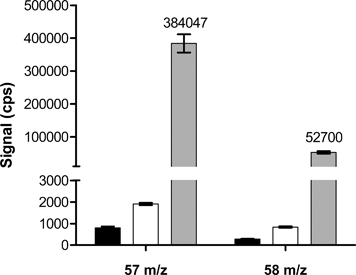 | ||
| Fig. 1 Mass counts obtained from sample diluent (black bars), sample diluent spiked with calcium (white bars) and diluted whole blood (grey bars). An 85 ppm Ca solution (subsequently diluted in the whole-blood diluent) was used, as this concentration represents whole blood levels. | ||
In spite of controlling spectroscopic interferences, repeated isotope ratio analysis of an in-house, quality control, whole blood sample showed a consistent ratio bias in relation to isotopic natural abundance (see Fig. 2) presumably due to mass bias. If the bias were consistent then accurate determination of isotopic enrichment in whole blood for two related blood samples (i.e. one taken prior to supplementation [sample d0] and one taken fourteen days after [sample d14]) should still be possible. However, repeated analyses of the in-house, quality control, whole blood sample revealed a significant inter-batch variability (RSD 2.0%, N = 22), presumably due to mass bias variability over time, which was in contrast to a relatively low intra-batch variability (RSD 0.12%, N = 10). Thus, we subsequently analysed d0 and d14 samples in the same analytical batch to minimise this effect. Furthermore, since plasma conditions may vary over a batch, an analytical sequence was implemented such that sample pairs (d0 and d14 from the same subject) were run consecutively (Fig. 3). Therefore, the isotopic ratio determined in related d0 and d14 samples was expected to be mostly affected by similar plasma-related biases, which would then be cancelled in the calculation of 58Fe enrichment.
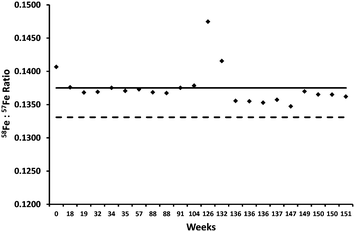 | ||
| Fig. 2 Repeated analysis of an in-house, quality control, whole blood showed a systematic bias. The bold line represents the mean isotopic ratio and the dashed line represents the natural abundance ratio. Outliers (e.g. at weeks 126 and 132) appeared to be related to low instrumental sensitivity for those batches (data not shown). | ||
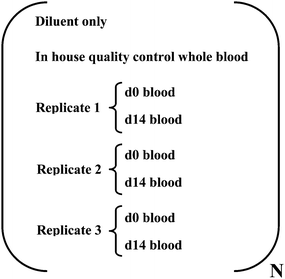 | ||
| Fig. 3 Sample analysis sequence implemented for DRC-ICP-MS analysis. N refers to number of iron deficient volunteers analysed per batch, typically N ≥ 4. | ||
DRC-ICP-MS was then used for the analysis of whole blood samples from iron-deficient volunteers who were participating in an Fe absorption study and given 58Fe labelled supplements.18 Repeated analysis of one sample pair (from one volunteer) over a period of two years in different analytical batches showed that inter-batch variability (3.4%; N = 5 replicates) and intra-batch variability, in which the sample pairs were analysed repeatedly in a single batch (4.4%; N = 10 replicates), were similar. These percentages refer to variability in the measurement of enrichment (i.e. the change in the ratio from baseline to day 14). Also, the limit of detection (i.e. minimum 58Fe increment that could be detected), was 0.4% enrichment, whereas the limit of quantification (i.e. minimum 58Fe increment that could be quantified) was 1% enrichment. Thus, this methodology allows the quantification down to 1% 58Fe enrichment with an associated relative variability of 3 to 4% (i.e. the absolute variability is 0.03 to 0.04%of the enrichment).
Samples from several volunteers were also analysed by DRC-ICP-MS and compared to MC-ICP-MS (Lab1) and SF-ICP-MS results. Comparison of differences between the analytical methods using a Bland-Altman plot19 shows that the DRC-ICP-MS results were in agreement with the MC-ICP-MS results (Fig. 4) and, importantly, there was no evidence of increased scatter at greater enrichments (i.e. higher 58Fe concentrations in d14 samples). Additionally, the average difference was low (−0.04% 58Fe enrichment) and the 95% confidence range of the bias was narrow (−0.26 to 0.18% 58Fe enrichment). Comparison to SF-ICP-MS (Fig. 4) also resulted in a low average difference between the two techniques (0.02% 58Fe enrichment) but the scattering of the data resulted in a high 95% confidence range for the bias between DRC-ICP-MS and SF-ICP-MS (−2.15 to 2.2% 58Fe enrichment), and this was about an order of magnitude greater than the range between DRC-ICP-MS and MC-ICP-MS results.
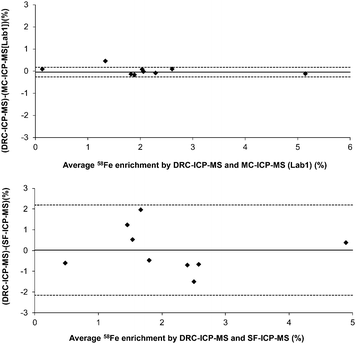 | ||
| Fig. 4 Bland-Altman plot showing the differences against the means that were obtained for 58Fe enrichment as measured by DRC-ICP-MSvs.MC-ICP-MS (Lab 1) or vs. SF-ICP-MS (top and bottom graphs respectively). The solid lines represent the average difference between methods and the dashed lines correspond to the 95% confidence intervals. | ||
Further analysis of different samples confirmed the poor agreement and low coefficient of correlation between DRC-ICP-MS and SF-ICP-MS methodology (r2 = 0.427; Fig. 5). Moreover, the SF-ICP-MS methodology determined several implausible negative 58Fe enrichments (i.e. an apparent loss of 58Fe after the volunteers had been given an 58Fe-labelled iron supplement).
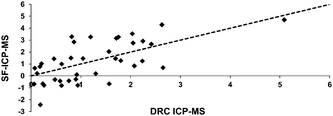 | ||
| Fig. 5 Comparison between values obtained for 58Fe enrichment by DRC-ICP-MS and SF-ICP-MS (y =1.083x − 0.1803; r2 = 0.4266). The dashed line represents the unity line (x = y). Much of the data in this figure have been previously reported in a conference proceedings.20 | ||
Further agreement was attained by comparison with a second MC-ICP-MS analytical laboratory (Lab 2) and reassured the validity of the original (Lab 1) MC-ICP-MS data (Table 2).
| a Average difference of the bias. b Upper limit of the 95% confidence interval. c Lower limit of the 95% confidence interval. d N = Number of samples compared between laboratories. | |||
|---|---|---|---|
| SF-ICP-MS | AD a 0.078% | ||
| UL b 2.6% | |||
| LL c −2.4% | |||
| Nd 38 | |||
| MC-ICP-MS (Lab 1) | AD −0.041% | AD 0.244% | |
| UL 0.18% | UL 2.1% | ||
| LL −0.26% | LL −1.7% | ||
| N 9 | N 9 | ||
| MC-ICP-MS (Lab 2) | AD −0.051% | AD 0.191% | AD 0.011% |
| UL 0.32% | UL 2.0% | UL 0.33% | |
| LL −0.42% | LL −1.6% | LL −0.30% | |
| N 6 | N 6 | N 6 | |
| DRC-ICP-MS | SF-ICP-MS | MC-ICP-MS (Lab 1) |
We recognise that for some iron absorption studies, assessing the absorption of two separate supplements or foods may be desirable. In this way, the absorption of iron from the test item, labelled for example with 58Fe, can be compared to that of a gold standard, such as ferrous sulphate, also labelled with isotopic iron. The test item and gold standard are ingested on separate occasions to prevent possible interactions with absorption. If they are ingested a day apart then clearly separate isotopes (i.e.58Fe and 57Fe) are required and thus further methodological developments for DRC-ICP-MS of iron isotopes in clinical samples could focus on 57Fe measurements of whole-blood. If however they are ingested several weeks apart then the same isotope (e.g.58Fe) could be used for both with the new isotope ‘baseline’ simply being assessed, and subsequently accounted for, for the second, supplement or food.
Conclusions
The current results show that DRC-ICP-MS can be used to determine accurately the 58Fe enrichment of blood samples and can detect a ratio-increase of endogenous 58Fe as low as 0.4% and with quantification at 1%. These increments represent, respectively, 1% and 3% oral iron absorption from an iron supplement containing 2 mg 58Fe as a label, in a typical volunteer (60 Kg female with 11.5 g/dL haemoglobin). Since a minimum 5% oral iron absorption is expected for any worthwhile supplemental or fortification strategy, DRC-ICP-MS is clearly adequate for the routine determination of iron absorption in human supplementation or fortification studies.Notes and references
- B. de Benoist, E. McLeanet, I. Egli, M. Cogswell, “Worldwide prevalence of anaemia”, 1993–2005. WHO Global Database on Anaemia Geneva, World Health Organization, 2008 Search PubMed.
- R. J. Stoltzfus, Food Nutr. Bull., 2003, 24, S99–103 Search PubMed.
- T. Walczyk and F. von Blanckenburg, Science, 2002, 295, 2065 CrossRef CAS.
- P. A. Krayenbuehl, T. Walczyk, R. Schoenberg, F. von Blanckenburg and G. Schulthess, Blood, 2005, 105, 3812 CrossRef CAS.
- F. Vanhaecke, L. Balcaen, G. De Wannemacker and L. Moens, J. Anal. At. Spectrom., 2002, 17, 933 RSC.
- Z. S. Chen, I. J. Griffin, L. M. Plumlee and S. A. Abrams, J. Nutr., 2005, 135, 1790 CAS.
- C. P. Doherty, S. E. Cox, A. J. Fulford, S. Austin, D. C. Hilmers, S. A. Abrams and A. M. Prentice, PLoS One, 2008, 3, e2133 Search PubMed.
- R. Schoenberg and F. von Blanckenburg, Int. J. Mass Spectrom., 2005, 242, 257 CrossRef CAS.
- S. Weyer and J. Schwieters, Int. J. Mass Spectrom., 2003, 226, 355 CrossRef CAS.
- T. Arnold, J. N. Harvey and D. J. Weiss, Spectrochim. Acta, Part B, 2008, 63, 666 CrossRef.
- T. Arnold, M. Schoenbaechler, M. Rehkaemper, G. J. D. Kirk, F. J. Zhao, S. Dong and D. J. Weiss, Anal. Bioanal. Chem., 2010, 398, 3115 CrossRef CAS.
- C. Lentner (ed.), Geigy Scientific Tables: Physical Chemistry Composition of Blood Hematology Somatometric Data, Ciba Geigy, Basle, 8th edn, 1984, vol. 3, pp. 65 Search PubMed.
- M. Berglund and M. E. Wieser, Pure Appl. Chem., 2011, 83, 397 CrossRef.
- F. Hosain, G. Marsaglia and C. A. Finch, J. Clin. Invest., 1967, 46, 1 CrossRef CAS.
- T. W. May and R. H. Wiedmeyer, At. Spectrosc., 1998, 19, 150 CAS.
- P. Heitland and H. D. Koster, J. Trace Elem. Med. Biol., 2006, 20, 253 CAS.
- A. Stenberg, D. Malinovsky, I. Rodushkin, H. Andren, C. Ponter, B. Ohlander and D. C. Baxter, J. Anal. At. Spectrom., 2003, 18, 23 RSC.
- D. Pereira, C. Hutchinson, N. Faria, S. F. A. Bruggraber, J. J. Powel, unpublished work.
- J. M. Bland and D. G. Altman, Lancet, 1986, 327, 307 CrossRef.
- N. Faria, P. D. Winship, D. A. Pereira and J. J. Powell, Met. Ions Biol. Med., 2008, 10, 873 Search PubMed.
| This journal is © The Royal Society of Chemistry 2011 |