In vivo sodium concentration continuously monitored with fluorescent sensors
J. Matthew
Dubach
ab,
Edward
Lim
c,
Ning
Zhang
c,
Kevin P.
Francis
c and
Heather
Clark
*d
aDepartment of Bioengineering, Northeastern University, 360 Huntington Ave, Boston, MA 02115
bThe Charles Stark Draper Laboratory, Biomedical Engineering, 555 Technology Square, Cambridge, MA 02139, USA
cCaliper Life Science, 2061 Challenger Drive, Alameda, CA 94501, USA
dDepartment of Pharmaceutical Sciences, Northeastern University, 360 Huntington Ave, Boston, MA 02115. E-mail: h.clark@neu.edu
First published on 19th November 2010
Abstract
Sodium balance is vital to maintaining normal physiological function. Imbalances can occur in a variety of diseases, during certain surgical operations or during rigorous exercise. There is currently no method to continuously monitor sodium concentration in patients who may be susceptible to hyponatremia. Our approach was to design sodium specific fluorescent sensors capable of measuring physiological fluctuations in sodium concentration. The sensors are submicron plasticized polymer particles containing sodium recognition components that are coated with biocompatible poly(ethylene) glycol. Here, the sensors were brought up in saline and placed in the subcutaneous area of the skin of mice by simple injection. The fluorescence was monitored in real time using a whole animal imager to track changes in sodium concentrations. This technology could be used to monitor certain disease states or warn against dangerously low levels of sodium during exercise.
Insight, innovation, integrationContinuous monitoring of electrolyte imbalances in vivo will provide insight into the cause of the imbalance, proper treatment and state of disease leading to the imbalance. Current clinical analysis of electrolyte levels requires a blood draw, limiting the frequency with which measurements can be taken. We have developed and applied fluorescent sensors specific for sodium which have been injected into the skin of mice and optically report sodium concentration at short time intervals. This provides a new method to monitor physiological electrolyte balance in real-time. |
Introduction
Plasma electrolyte concentrations are currently measured through blood draws from patients. This process however limits concentration determination to discrete time points that are spaced out over the course of hours in hospitalized patients. Continuous measurements may provide more information about the nature of electrolyte imbalances. Hyponatremia, or low serum sodium concentration, is the most common electrolyte disorder.1 It can be brought on by renal abnormalities, sodium loss from sources such as sweat, cancer, central nervous system (CNS) disorders, drugs, pulmonary conditions and others.1 The direct costs of treating hyponatremia in the US are estimated to be between $1.6 and $3.6 billion annually.2There are two causes of hyponatremia that are common occurrences in the hospital setting. One is transurethral resection of the prostrate (TURP) syndrome caused by perfusion of the urethra with sodium free solution during TURP surgeries. Between 10 to 15% of TURP procedures incur TURP syndrome.3 The second, cerebral salt wasting (CSW), common in neurological injuries, hemorrhaging, and brain tumors, has become more prevalent over the past three decades and is caused by excretion of sodium and chloride without physiological stimulus.4 In a recent study hyponatremia was found in 179 of 316 patients with spontaneous subarachnoid hemorrhage.5 Under both of these conditions hyponatremia can have adverse effects. However, the depth of these studies has been limited by methods to determine sodium concentration. It has been proposed that sodium excretion rates do not provide enough information about CSW.6 Therefore, a more direct method to measure sodium in the body is required to fully understand the balance of sodium in these cases.
Additionally, there are multiple, less common, conditions that have been studied where hyponatremia can be induced, however the affect of hyponatremia in these cases is not known. Hyponatremia has been reported in endurance exercise and was found in 13% of runners tested in the 2002 Boston Marathon.7,8 Syndrome of Inappropriate Antidiuresis (SIAD) is another common cause of hyponatremia seen in kidney disorders.9 While little is known about the physiological consequences of hyponatremia, it is an established adverse prognostic factor in heart failure and is commonly acquired in hospitalized pediatric patients.10,11
Currently there is no method to continuously monitor hyponatremia. There is evidence, however, that the onset and rate of correction of hyponatremia can have adverse affects. More serious symptoms of hyponatremia are known to develop when the sodium levels are extremely low, below 120 mM.12 Additionally, the rate of sodium loss is important as rapid onset of hyponatremia can cause CNS problems at sodium levels that are safer in chronic conditions.12 It has also been shown that acute, severe hyponatremia can cause substantial morbidity and mortality.13 Furthermore, the threshold for significant effects of hyponatremia may be higher in cases of traumatic brain injury.14 However, once hyponatremia is diagnosed, overly rapid correction of can cause severe neurological deficits and death.13
There have been few studies that closely track hyponatremia because of the lack of tools available. Therefore little is known about when hyponatremia is significant.15 In a recent study following sodium levels during TURP, hyponatremia was solely dependent on procedure length.16 The study, however, was limited to two sodium concentration measurements and therefore onset of hyponatremia could not be determined. If continuous sodium monitoring were available the surgery could continue until a dangerous drop in concentration occurred.
A sensing mechanism that does not deteriorate over time is needed to accomplish continuous monitoring. Optodes, the optical equivalent to ion selective electrodes, are commonly used sensors that are reversible and specific for the ion of interest. Optodes to monitor sodium concentration have been used for over 20 years.17–19 However, optodes have traditionally been used as bulk sensors for fluid analysis.20 To achieve physiological monitoring, sensors need to be in contact with the extracellular fluid which is difficult with large optode sensors. However, research has shown that optodes can be miniaturized for biological measurements.21–23 Recent research has specifically focused on the miniaturization of sodium optode sensors to measure intracellularsodium signalling.24,25 The sensors were completely selective for sodium over interfering ions and showed no cellular toxicity during incubation in cell culture. These sodium nanosensors provided a method to monitor sodium sparks in isolated cardiomyocytes.26 The nanosensors were small and tuned to respond to intracellular sodium concentrations around 10 mM. The surface was coated with poly(ethylene) glycol to impart biocompatibility. Additionally, similar biocompatible coatings for bulk optodes have been explored to enable implantable sodium detectors.27 However, very little work has been published to study extracellular concentrations of ions in a biological system without removing fluid. Optodes have been used to detect extracellular potassium flux from excitable cells in culture.28 But there are no previous reports of measuring electrolytes with optodes in vivo. Here we used modified sodium sensors designed for extracellularin vivo measurements to continuously monitor sodium in mice.
The technology described here will enable continuous monitoring of sodium levels. In vivo use of optode sensors requires biocompatibility of the sensor and precise response toin vivo concentrations. Additionally, imaging through the skin provides a minimally invasive window into the physiological concentration of sodium. This will not only provide a method to determine the causes and effects of sodium imbalance, but also a method to determine if imbalance is occurring. Preventing hyponatremia during TURP procedures will reduce side effects after the procedure is done. Furthermore, measuring sodium concentration during experimental procedures in animal models provides pertinent information for a number of diseases and their treatment.
Methods
Sensor fabrication
A cocktail consisting of the following components was brought up in 500 μl of tetrahydrofuran: 120 mg ml−1bis(2-ethylhexyl) sebacate, 60 mg ml−1 high molecular weight poly(vinyl) chloride, 3 mg ml−1sodium ionophore X, 2 mg ml−1sodium tetrakis[3,5-bis(trifluoromethyl)phenyl]borate, and 1 mg ml−1 Chromoionophore III (all from Sigma, St Louis, MO). This cocktail was diluted 1![[thin space (1/6-em)]](https://www.rsc.org/images/entities/char_2009.gif) :1 with dichloromethane (Sigma) and 100 μl of the subsequent mixture were added to 4 ml of aqueous solution under probe tip sonication (Branson, Danbury, CT). The aqueous solution contained 10 mM HEPES (Sigma) and 1.25 mg of 1,2-distearoyl-sn-glycero-3-phosphoethanolamine-N-[methoxy(polyethylene glycol)-550] (ammonium salt) (Avanti Polar Lipids, Alabaster, AL), the pH was brought to 7.4 using Trizma Base and hydrochloric acid (Sigma). Size measurements were performed using dynamic light scattering (Zetasizer, Malvern, Worcestershire, UK). The sensors were used within eight hours of fabrication.
:1 with dichloromethane (Sigma) and 100 μl of the subsequent mixture were added to 4 ml of aqueous solution under probe tip sonication (Branson, Danbury, CT). The aqueous solution contained 10 mM HEPES (Sigma) and 1.25 mg of 1,2-distearoyl-sn-glycero-3-phosphoethanolamine-N-[methoxy(polyethylene glycol)-550] (ammonium salt) (Avanti Polar Lipids, Alabaster, AL), the pH was brought to 7.4 using Trizma Base and hydrochloric acid (Sigma). Size measurements were performed using dynamic light scattering (Zetasizer, Malvern, Worcestershire, UK). The sensors were used within eight hours of fabrication.
Calibration of sensors
Calibration was performed by diluting the sensors 1:1 in 10 mM HEPES, pH 7.4 aqueous solution with varying amounts of sodium. The sensors were pipetted into an optical bottom 96 well plate in triplicate per concentration. The fluorescence was read in a plate reader exciting the sensors at 633 nm and collecting emission at 680 nm (Spectramax M2, Molecular Devices, Sunnyvale, CA). Fluorescence was also read in an IVIS Spectrum (Caliper, Hopkington, MA) using excitation at 640 nm and collecting emission at 680 nm. The intensity at a given concentration was normalized according to α = (Intensity[Na+] − Intensitymin)/(Intensitymax − Intensitymin). The normalized data were plotted against the log of the sodium concentration and a sigmoidal curve was fit (OriginLab, Northampton MA) from which the Kd was calculated.
In vivo studies
Nude CD-1 mice (Charles River Labs, Wilmington, MA) were subcutaneously injected with 10 μl of sensors in aqueous solution in the back of the animal. All animal experiments were approved by the institutional animal care and usage committee of Caliper Life Science. Optical data was collected using an IVIS Spectrum (Caliper, Hopkington, MA, USA) in vivo animal imager. Both brightfield and fluorescent images were acquired. Fluorescence wavelengths were set using band pass filters with centered wavelengths indicated. In the case of comparing wavelengths all acquisition parameters were maintained. Otherwise, both the f-stop of the camera and exposure time were altered to prevent saturation. The sensors were mixed with sodium at different concentrations ranging from zero to 500 mM sodium in aliquots to create different sodium concentrations in the sensor solutions. These sodium concentrations were used to determine sodium sensitivity of the sensors in vivo and sodium flux in vivo. Approximately ten microlitres were delivered for each injection.Results
Sodium sensors were designed to have maximal response to sodium at concentrations near 140 mM sodium. The sensors were formed and calibrated in a plate reader to determine the response characteristics. The sodium response of the sensors is shown in Fig. 1. Shown is average normalized (see methods) response with standard deviation. A sigmoidal curve was fit from which the Kd of the sensors was determined to be 74 mM. While this Kd is slightly lower than desired it was used because of the optical characteristics from the IVIS measurements discussed below. The average size of the particles was 243 nm, n = 3, with a polydispersity index of 0.312, which correlates to a standard deviation of dispersion of 136 nm. While there was a broad dispersion of sizes, monodispersity was not necessary. The size restrictions on the particles were to allow injection and limit diffusion after injection. Both of these restrictions were met with this size and dispersion.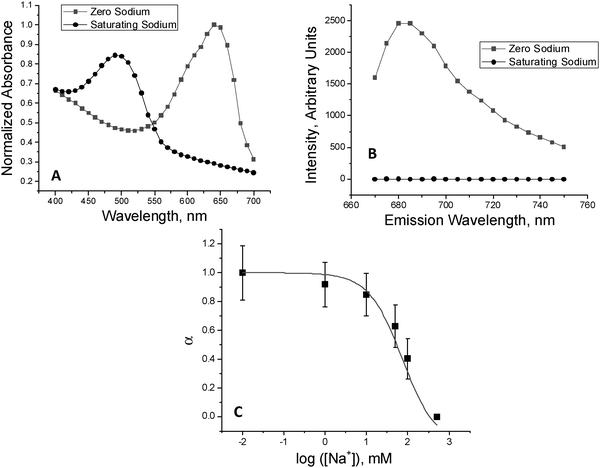 | ||
| Fig. 1 Sensor response to sodium measured with a plate reader. (A) Absorbance of sensors in zero sodium solution (red) or saturating sodium solution (blue). (B) Emission of sensors in zero sodium solution (red) or saturating sodium solution (blue). Sensors were excited with 633 nm with a cutoff at 665 nm. (C) Average of n = 3 measurements (black squares, with standard deviation) with fitted sigmoidal curve (red line). | ||
The sensors were calibrated in the IVIS animal imager using the same plate set up as above. The wavelengths used were slightly different, 640/680 nm, because of the filter restrictions of the IVIS imager. Fig. 2A shows the sodium concentration sensitivity of the sensors. The sodium concentrations were used in triplicate with each column representing a different concentration increasing from left to right. The image shows fluorescence at 640/680 nm with brightfield overlaid. Fig. 2B shows the normalized response of the sensors to sodium. The average, n = 3, and standard deviation are plotted for each sodium concentration used. A sigmoidal curve was fit and the Kd was determined to be 135 mM. This is ideal for extracellular sodium detection and validated the use of the sensors in this optical set up. The dynamic range from the fit curve was 4 to 250 mM with a resolution of 1.8 mM.
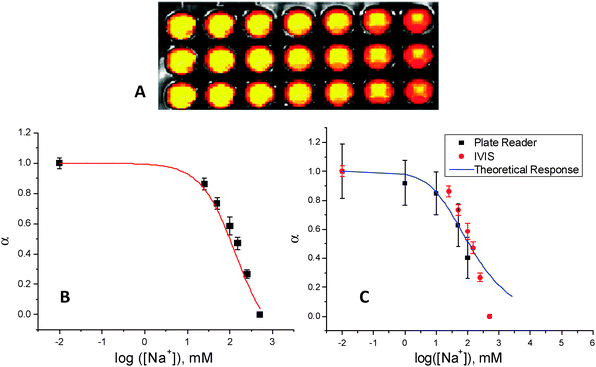 | ||
| Fig. 2 Sensor response determined with the IVIS animal imager. (A) Image of well plate with brightfield and fluorescence overlaid. Wells are sensors at different sodium concentrations increasing from left to right in triplicate. (B) Normalized response of the sensors to sodium. Average and standard deviation (black squares) with sigmoidal fit (red line). (C) Comparison of IVIS data (red) to Plate reader data (black) and theoretical response curve (blue). | ||
The difference in Kd between measurements in the plate reader and the IVIS is not statistically significant when factoring the error of the curve fit used to determine the values. Fig. 2C shows the sodium response calibration data from both instruments as well as the theoretical response curve. The theoretical response was found from the concentrations of components added to the sensor.29 The difference in the average is likely due to differences in optical pathways of the instruments and the slight difference of wavelengths of excitation. The sensors were created to respond to proper sodium levels when used in the IVIS instrument. Previous results have shown that the sensor is selective for sodium in presence of potassium at physiologically relevant concentrations.25 Interference from other ions is negligible considering the large concentration of sodium in the extracellular space.
The ideal fluorescent wavelengths for imaging the sensors were determined by imaging the sensors with various filter setups. Sodium optode sensors have a broad absorption spectrum and can be excited at multiple wavelengths. The excitation and emission scan of the sodium sensors in vivo over known in vitro fluorescent wavelengths is shown in Fig. 3. All acquisition parameters were maintained during the wavelength scan. The minimum and maximum efficiency units are shown in the bottom right of each image. Efficiency units are the recommended method to measure fluorescence using an IVIS instrument. At longer excitation and emission wavelengths there is less autofluorescence generated by the mouse, indicated by the minimum efficiency unit, and the fluorescence generated by the sensors is higher, indicated by the maximum efficiency unit. This co-dependence may be in part due to increased excitation penetration into the skin at longer wavelengths and therefore higher excitation of the sensors. Smaller differences between the minimum and maximum efficiency unit indicate a lower signal to noise value, which optimally should be maximized. The sensors were brightest when exciting with 640 nm and collecting emission at 680 nm. Therefore, all subsequent in vivo experiments were performed at these wavelengths.
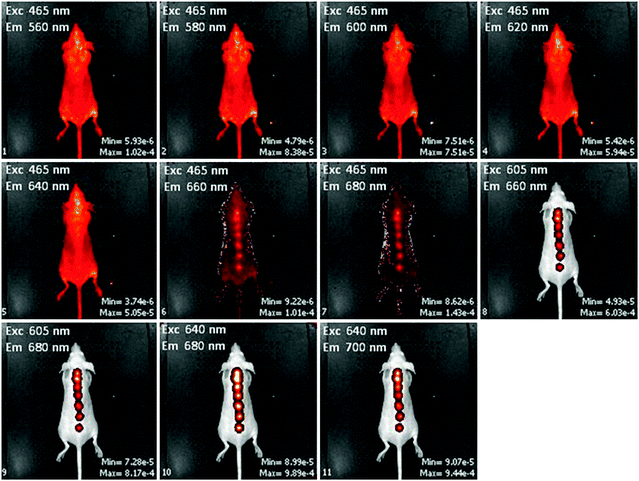 | ||
| Fig. 3 Wavelength dependence of sensor fluorescence in vivo. Each panel contains a fluorescence image overlaid with a brightfield image at the excitation and emission wavelengths indicated in the upper left corner of the panel. The maximum and minimum efficiency units of fluorescence are shown in the lower right corner of each panel. | ||
Once the optical response of the sensors in the IVIS system was demonstrated, the sodium dependence of the sensors was determined in vivo. Fluorescent images of the sensors were taken of sensors injected into the skin and overlaid with brightfield images, Fig. 4. The legend indicates the sodium concentration in the solution that was injected at the corresponding spot. At higher sodium concentrations the relative efficiency, and thus the intensity, were lower. The sodium dependence of the fluorescence intensity was similar to data acquired in the plate calibration.
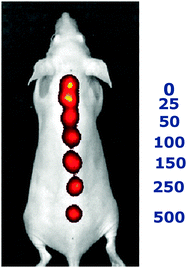 | ||
| Fig. 4 In vivo image of sensors at different sodium concentrations. Fluorescence overlaid with brightfield is shown with seven different subcutaneous injections of sensors in different sodium concentration solutions. On the right is the corresponding sodium concentration in mM. | ||
Mice were then injected with sensors in zero sodium solution or 150 mM sodium solution and the fluorescence was monitored over time, n = 3 for each concentration. The average efficiency units of fluorescence were plotted against time for each sodium concentration over the course of an hour, Fig. 5. The sodium free injection started off with efficiency units significantly higher than the 150 mM sodium solution sensors. This was expected as fluorescence decreases with increasing sodium concentration. Within ten minutes the difference in efficiencies was no longer significant as sodium diffused into the area of injection to bring the extracellular concentration back to physiological levels (∼140 mM). The average efficiency of each injection was statistically similar over the remaining 50 min. The short period of time during which these measurements were taken eliminates the chance of cellular uptake by endocytosis which would limit the ability of the sensor to measure extracellular concentration. These sensors tracked the change of sodium from zero to physiological concentrations over time.
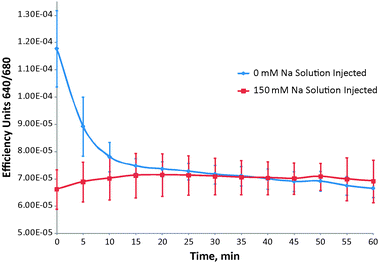 | ||
| Fig. 5 Response of sensors to changing sodium concentration in vivo. Average efficiency units with standard deviation of the response sodium sensors tracked over time. Injections were given in zero sodium solution (blue) and 150 mM sodium solution (red). | ||
Discussion
Previous use of similar sensors has been targeted toward intracellular detection of sodium concentration changes upon cellular activity. Because the cell is small and diffusion throughout the cytosol is limited for larger molecules the sensors were designed to be on the order of 100 nm in diameter.30 For use as an extracellular sensor that resides in the interstitial solution in the skin, however, 100 nm or less diameter in not ideal. Small particle size and the lack of a protective surface molecule such as poly(ethylene) glycol lead to uptake by macrophages as an immune reaction.31,32 Conversely, objects that are too large and difficult to implant and can cause an inflammatory response.33 The size range between 200 nm and a few microns in diameter avoids these issues to the greatest extent. Additionally, the smaller sensors will have increased diffusion in the interstitial fluid, which is undesirable for long experiments. However, sensor response time is dependent on the surface area to volume ratio; larger particles have a smaller ratio and thus a longer response time. While acquisition rates on the order of minutes will not be affected by sensors with micron or larger diameters with response times on the order of milliseconds to seconds, as performed here, the response time needs to be considered under certain circumstances.An advantage of using optodes is their properties as ratiometric fluorophore reporters.34–36 Wavelengths typically employed to perform ratiometric measurements are between 450 nm and 600 nm, unfortunately this is in the range where skin has high autofluorescence. When using an excitation wavelength of 485 nm there was a large amount of autofluorescence from the skin. This decreased the signal to noise ratio and made intensity from the sensors difficult to quantify. Therefore, imaging the sensors through skin requires longer wavelengths. Wavelengths of 640/680 nm were chosen and little autofluorescence was observed. Because single wavelength measurements were performed it is difficult to account for diffusion of the sensors after injection or the actual volume of the injection itself. One method to normalize the fluorescence intensity and injection volume would be to add to the sensor a reference fluorophore that is independent of sodium concentration and has absorbance and emission properties in the red to near infrared wavelengths. Alterations in the light path of collection would be eliminated in the wavelengths of the optode and the reference fluorophore were similar. However, the possibility of Forster resonance energy transfer may arise. Therefore using a reference fluorophore with optical properties in the near infrared would be more ideal, however this was beyond the limits of the experimental apparatus. With a reference fluorophore the total amount of sensors per injection could then be determined and the diffusion of the sensors over time could be tracked. While this was not explored here, because diffusion was not an issue during longer experiments, it will be considered in future experiments.
The correlation of interstitial concentrations to serum concentrations of electrolytes and small molecules has been debated for quite some time.37 The most studied small molecule has been glucose.38 Minimally invasive sensors that don't require blood draws have been and continue to be developed for serum glucose measurements. Studies have shown lags in increases in glucose concentration between serum and interstitial fluid are on the order of minutes.39 There has been little research in the correlation of sodium concentration in serum and interstitial fluid. However, because sodium is more tightly regulated and diffuses more rapidly than glucose there is no reason to believe that the lag time between serum and interstitial fluid concentration would be longer than glucose. This indicates that the correlation time between serum and interstitial sodium concentration should be on the order of minutes, if not faster.
Experimental studies on hyponatremia and electrolyte imbalances have been very limited due to the lack of technology to continuously monitor sodium concentration.15,16 Blood gas analyzers require, at a minimum, 40 μl of blood to perform a test.40 This requires blood draws every time a measurement is performed. The lack of knowledge of the affects of hyponatremia is perhaps due to the lack of an ideal animal model to study it at the physiological level. Multiple blood draws of 40 μl from a mouse is very difficult which would limit experiments to one measurement, often requiring sacrificing the animal to obtain the measurement. A method, such as the sensors described here would enable fundamental basic research into the affects of electrolyte imbalances such as hyponatremia.
References
- H. J. Adrogue and N. E. Madias, Hyponatremia, N. Engl. J. Med., 2000, 342, 1581–1589 CrossRef CAS.
- A. Boscoe, C. Paramore and J. G. Verbalis, Cost of illness of hyponatremia in the United States, Cost Eff. Resour. Allocation, 2006, 4, 10 Search PubMed.
- D. Gravenstein, Transurethral resection of the prostate (TURP) syndrome: a review of the pathophysiology and management, Anesth. Analg. (N.Y.), 1997, 84, 438–446 Search PubMed.
- S. Singh, et al. Cerebral salt wasting: truths, fallacies, theories, and challenges, Crit. Care Med., 2002, 30, 2575–2579 CrossRef.
- S. Benvenga, What is the pathogenesis of hyponatremia after subarachnoid hemorrhage?, Nat. Clin. Pract. Endocrinol. Metab., 2006, 2, 608–609 Search PubMed.
- A. P. Carlotti, D. Bohn, J. P. Mallie and M. L. Halperin, Tonicity balance, and not electrolyte-free water calculations, more accurately guides therapy for acute changes in natremia, Intensive Care Med., 2001, 27, 921–924 CrossRef CAS.
- C. S. Almond, et al. Hyponatremia among runners in the Boston Marathon, N. Engl. J. Med., 2005, 352, 1550–1556 CrossRef CAS.
- T. D. Noakes, N. Goodwin, B. L. Rayner, T. Branken and R. K. Taylor, Water intoxication: a possible complication during endurance exercise, Med. Sci. Sports Exerc., 1985, 17, 370–375 Search PubMed.
- D. H. Ellison and T. Berl, Clinical practice. The syndrome of inappropriate antidiuresis, N. Engl. J. Med., 2007, 356, 2064–2072 CrossRef CAS.
- D. Farmakis, G. Filippatos, D. T. Kremastinos and M. Gheorghiade, Vasopressin and vasopressin antagonists in heart failure and hyponatremia, Curr. Heart Failure Rep., 2008, 5, 91–96 Search PubMed.
- M. L. Moritz and J. C. Ayus, Prevention of hospital-acquired hyponatremia: a case for using isotonic saline, Pediatrics, 2003, 111, 227–230 CrossRef.
- B. F. Palmer, J. R. Gates and M. Lader, Causes and management of hyponatremia, Ann. Pharmacother., 2003, 37, 1694–1702 CrossRef.
- J. G. Verbalis, S. R. Goldsmith, A. Greenberg, R. W. Schrier and R. H. Sterns, Hyponatremia treatment guidelines: expert panel recommendations, Am. J. Med., 2007, 120, S1–21 CrossRef CAS.
- J. W. Atchison, et al. Hyponatremia-associated cognitive impairment in traumatic brain injury, Brain Inj., 1993, 7, 347–352 CrossRef CAS.
- M. Rahman and W. A. Friedman, Hyponatremia in neurosurgical patients: clinical guidelines development, Neurosurgery, 2009, 65, 925–935 CrossRef ; discussion 935–926.
- T. Georgiadou, et al. Changes in serum sodium concentration after transurethral procedures, Int. Urol. Nephrol., 2007, 39, 887–891 CrossRef CAS.
- K. Seiler, et al. Characterization of sodium-selective optode membranes based on neutral ionophores and assay of sodium in plasma, Clin. Chem., 1991, 37, 1350–1355 CAS.
- Z. Zhujun, J. Mullin and W. Seitz, Optical sensor for sodium based on ion-pair extraction and fluorescence, Anal. Chim. Acta, 1986, 184, 251 CrossRef.
- B. Schaffar and O. Wolfbeis, A sodium-selective optrode, Mikrochim. Acta, 1989, III, 109.
- E. Bakker and W. Simon, Selectivity of ion-sensitive bulk optodes, Anal. Chem., 1992, 64, 1805 CrossRef CAS.
- R. Retter, S. Peper, M. Bell, I. Tsagkatakis and E. Bakker, Flow cytometric ion detection with plasticized poly(vinyl chloride) microspheres containing selective lonophores, Anal. Chem., 2002, 74, 5420–5425 CrossRef CAS.
- H. A. Clark, M. Hoyer, M. A. Philbert and R. Kopelman, Optical nanosensors for chemical analysis inside single living cells. 1. Fabrication, characterization, and methods for intracellular delivery of PEBBLE sensors, Anal. Chem., 1999, 71, 4831–4836 CrossRef CAS.
- H. A. Clark, R. Kopelman, R. Tjalkens and M. A. Philbert, Optical nanosensors for chemical analysis inside single living cells. 2. Sensors for pH and calcium and the intracellular application of PEBBLE sensors, Anal. Chem., 1999, 71, 4837–4843 CrossRef CAS.
- J. M. Dubach, D. I. Harjes and H. A. Clark, Ion-selective nano-optodes incorporating quantum dots, J. Am. Chem. Soc., 2007, 129, 8418–8419 CrossRef CAS.
- J. M. Dubach, D. I. Harjes and H. A. Clark, Fluorescent ion-selective nanosensors for intracellular analysis with improved lifetime and size, Nano Lett., 2007, 7, 1827–1831 CrossRef CAS.
- J. M. Dubach, S. Das, A. Rosenzweig and H. A. Clark, Visualizing sodium dynamics in isolated cardiomyocytes using fluorescent nanosensors, Proc. Natl. Acad. Sci. U. S. A., 2009, 106, 16145–16150 CrossRef CAS.
- S. H. Baxamusa, et al. Protection of sensors for biological applications by photoinitiated chemical vapor deposition of hydrogel thin films, Biomacromolecules, 2008, 9, 2857–2862 CrossRef CAS.
- D. I. Harjes, J. Dubach, A. Rosenzweig, S. Das and H. A. Clark, Ion selective optodes measure extracellular potassium flux in excitable cells, Macromol. Rapid Commun., 2010, 31, 217–221 CAS.
- E. Bakker, P. Buhlmann and E. Pretsch, Carrier-Based Ion-Selective Electrodes and Bulk Optodes. 1. General Characteristics, Chem. Rev., 1997, 97, 3083–3132 CrossRef CAS.
- O. Seksek, J. Biwersi and A. S. Verkman, Translational diffusion of macromolecule-sized solutes in cytoplasm and nucleus, J. Cell Biol., 1997, 138, 131–142 CrossRef CAS.
- X. Shan, et al. In vitro macrophage uptake and in vivo biodistribution of long-circulation nanoparticles with poly(ethylene-glycol)-modified PLA (BAB type) triblock copolymer, Colloids Surf., B, 2009, 72, 303–311 CrossRef CAS.
- A. Hoshino, S. Hanada, N. Manabe, T. Nakayama and K. Yamamoto, Immune response induced by fluorescent nanocrystal quantum dots in vitro and in vivo, IEEE Trans. NanoBiosci., 2009, 8, 51–57 CrossRef.
- U. Klueh, M. Kaur, D. C. Montrose and D. L. Kreutzer, Inflammation and glucose sensors: use of dexamethasone to extend glucose sensor function and life span in vivo, J. Diabetes Sci. Technol., 2007, 1, 496–504 Search PubMed.
- M. Shortreed, S. Dourado and R. Kopelman, Development of a fluorescent optical potassium-selective ion sensor with ratiometric response for intracellular applications, Sens. Actuators, B, 1997, 38, 8 CrossRef.
- M. Shortreed, E. Bakker and R. Kopelman, Miniature sodium-selective ion-exchange optode with fluorescent pH chromoionophores and tunable dynamic range, Anal. Chem., 1996, 68, 2656–2662 CrossRef CAS.
- E. J. Park, M. Brasuel, C. Behrend, M. A. Philbert and R. Kopelman, Ratiometric optical PEBBLE nanosensors for real-time magnesium ion concentrations inside viable cells, Anal. Chem., 2003, 75, 3784–3791 CrossRef CAS.
- T. Bergan, Pharmacokinetics of tissue penetration of antibiotics, Rev. Infect. Dis., 1981, 3, 45–66 Search PubMed.
- N. S. Oliver, C. Toumazou, A. E. Cass and D. G. Johnston, Glucose sensors: a review of current and emerging technology, Diabetic Med., 2009, 26, 197–210 CrossRef CAS.
- M. S. Boyne, D. M. Silver, J. Kaplan and C. D. Saudek, Timing of changes in interstitial and venous blood glucose measured with a continuous subcutaneous glucose sensor, Diabetes, 2003, 52, 2790–2794 CrossRef CAS.
- C. A. Horswill, et al. Sodium balance during U. S. football training in the heat: cramp-prone vs. reference players, Int. J. Sports Med., 2009, 30, 789–794 CrossRef CAS.
| This journal is © The Royal Society of Chemistry 2011 |