Scottish peat bog records of atmospheric vanadium deposition over the past 150 years: comparison with other records and emission trends
Joanna M.
Cloy
*a,
John G.
Farmer
a,
Margaret C.
Graham
a and
Angus B.
MacKenzie
b
aSchool of GeoSciences, University of Edinburgh, Edinburgh, EH9 3JN, Scotland, UK. E-mail: Joanna.Cloy@ed.ac.uk
bScottish Universities Environmental Research Centre, East Kilbride, G75 0QF, Scotland, UK
First published on 22nd November 2010
Abstract
Cores from four Scottish ombrotrophic peat bogs were used to reconstruct the historical record of atmospheric vanadium (V) deposition in Scotland over the last 150 years. The general similarity of V and Pb concentration profile trends in 210Pb-dated cores from each of the sites strongly suggested that V, like Pb, is essentially immobile in ombrotrophic peat. After allowance via use of the conservative element Ti for the contribution of soil dust V, the deposition of anthropogenic V was found to be greatest (∼1.3 to 2.0 mg m−2 y−1) in the mid-20th century before decreasing to 0.1–0.3 mg m−2 y−1 in the early years of the 21st century. The latter values were in good agreement with directly measured atmospheric V fluxes at nearby sites, a finding also observed in the case of Pb. The decline in peat-core-derived fluxes for both V and Pb from 1970 to 2004, however, was not as large as the decline in official UK emission estimates for the two metals during this period. This, along with an order of magnitude discrepancy between the anthropogenic V/Pb ratios at the peat core surface and the higher values of the ratio for UK emissions in the early 2000s, suggests that the recently revised UK emissions data for V may perhaps still be overestimated and/or that some previously deposited Pb is being resuspended in the atmosphere.
Environmental impactVanadium is a trace element commonly found in coal and oil and is therefore released into the atmosphere by fossil fuel combustion. There is, however, little information on past atmospheric vanadium contamination arising from such human activity and official estimates of its release to the atmosphere have recently been significantly revised downwards in the light of apparent discrepancies with current direct measurements of deposition. This study uses concentration profiles of vanadium in dated cores from peat bogs, which can serve as archives of atmospheric metal deposition, to investigate trends in vanadium deposition in Scotland over the past 150 years. Such indirect results enable comparison with recent direct measurements and with trends in reported UK vanadium emissions over the past four decades, thus helping to place current environmental levels in historical perspective and to assess the accuracy of emission estimates. |
Introduction
Human activities have had a major impact on global atmospheric metal emissions over the last several thousand years, resulting in widespread contamination of the environment with potentially harmful trace metals such as Pb and Hg. In recent years dated cores from ombrotrophic peat bogs, which receive all their water and nutrients from the atmosphere by dry and wet deposition alone, have been used successfully to reconstruct atmospheric deposition histories of trace elements such as Pb,1–5Hg,6–10 As11–13 and Sb.11,13–15 Few studies, however, have explored the use of cores from ombrotrophic bogs to reconstruct trends in atmospheric deposition of other potentially harmful trace elements (e.g. Cd, Co, Cr, Ni and V) released into the environment by human activity. Indeed, in contrast with the extensively studied element Pb, only one study has used ombrotrophic peat bogs to reconstruct historical records of atmospheric V deposition.16 The study of environmental V contamination is timely because V can cause irritation to the respiratory tract17 and has been reported to be toxic to biota.18 This metal is found in most coals at concentrations ranging from 2–100 mg kg−1 and is present in crude oil at concentrations ranging from 60–1000 mg kg−1.19–21Vanadium is not particularly volatile but fossil fuel combustion, particularly combustion of V-rich fuel oils, is the most important source of the estimated global annual 240 kt V emissions to the atmosphere.19,20,22 Emissions of V from industrial processes such as iron and steel manufacture and from petroleum processing are also significant.17 In recent years transport emissions have been found to be increasingly important sources of V, e.g. from shipping23,24 and diesel vehicles.17Estimates of annual UK emissions of metals, including V, to the atmosphere since 1970, have been reported in the National Atmospheric Emissions Inventory (NAEI).17,25,26 In recent years, these historical V emission data have been revised downwards by an average of 58% for the period 1970–2006, to take account of improved data and advances in methodologies used to estimate V emissions.25–27 This revision reflects some doubt about the accuracy of the previous estimates of annual UK V emissions and a recent comparison of estimated annual UK metal emissions with measured ambient air concentrations has suggested that V emissions are still being overestimated.27 The potential reconstruction of atmospheric V deposition records from environmental archives such as ombrotrophic peat bogs is therefore of interest not only with respect to determination of historical trends in environmental V contamination but also because such records could provide independent data with which to compare directly determined V deposition and the aforementioned estimates of V emissions in the UK.
This work uses cores from four Scottish ombrotrophic peat bogs which have been used successfully as archives of historical atmospheric As, Hg, Pb and Sb deposition in previous studies.5,10,13,15,28 The specific objectives were to:
(i) assess whether ombrotrophic peat bogs can be used to reconstruct historical records of atmospheric V deposition.
(ii) determine the extent of environmental V contamination across Scotland since the onset of the Industrial Revolution.
(iii) compare recent trends in V deposition determined from Scottish peat bogs with directly measured V deposition in Scotland and the UK annual emission estimates since 1970.
(iv) compare trends in the determined atmospheric deposition rates and sources of V and Pb contamination.
To the best of our knowledge this is only the second study to utilise cores from ombrotrophic peat bogs to reconstruct atmospheric records of V deposition and indeed the first such study in the UK. It follows recommendations from successive international peat conferences that such studies be extended to less commonly studied elements like V.29–31
Materials and methods
Sampling
Cores were collected during 2001–2004 from four sites in Scotland: Turclossie Moss (TM), northeast; Flanders Moss (FM), west central; Red Moss of Balerno (RM), east central; and Carsegowan Moss (CM), southwest (Fig. 1). Methods of core collection from moss hummocks and preparation for analysis of sections (ranging from 1 to 3 cm in thickness) cut from TM04M-1/TM04CM-4, FM01CM-1, FM04-1-M, RM03CM-2, CM04CM-1 and their sister cores are detailed elsewhere.5,13,15 Vegetation-peat interface positions in the cores were typically at 5–10 cm depth except for TM04M-1 (23 cm).13 | ||
| Fig. 1 Locations of the four peat bog sampling sites, Turclossie Moss (TM), Flanders Moss (FM), Red Moss of Balerno (RM) and Carsegowan Moss (CM), and major urban centres Glasgow (G), Edinburgh (E) and Aberdeen (A). | ||
Analysis
Following microwave-assisted HNO3/HF digestion of duplicate peat sections,32 total V concentrations were determined in 2% HNO3 (v/v) analyte solutions by inductively coupled plasma-mass spectrometry (ICP-MS) using a PlasmaQuad (PQ) 3 ICP-MS (Thermo Electron, Winsford, UK), with a set of V standard solutions in the range 1–100 µg L−1 at m/z = 51, and yielding a peat sample V detection limit of 0.1 mg kg−1. Potential interference of 35Cl16O+ on 51V+ was found to be negligible. For duplicate peat samples, reproducibility was typically <±10% for V > 5 mg kg−1 and <±30% for V < 5 mg kg−1. Lead concentrations were determined occasionally by ICP-MS but mainly by inductively coupled plasma-optical emission spectrometry (ICP-OES).5 A Thermo Jarrell Ash (TJA) IRIS ICP-OES (Thermo Electron, Cambridge, UK), and/or a Perkin Elmer (PE) Optima 5300 DV ICP-OES (Perkin Elmer, Beaconsfield, UK), was used to determine both Pb (wavelength 220.3 nm) and Ti (334.9 nm) concentrations, with detection limits for Pb and Ti of 3 and 0.5 mg kg−1 (TJA), respectively, and 0.2 mg kg−1 (PE) and overall analytical precision (±1 RSD) of <±5%. Accuracy of V, Pb and Ti concentration data was confirmed by simultaneous quality control analyses of four certified peat and plant reference materials, including Ombrotrophic Peat NIMT/UOE/FM00133 (Table 1). Lead isotopic ratios (206Pb/207Pb, 208Pb/206Pb, 208Pb/207Pb) were determined by ICP-MS, with analytical precision of <± 0.3% (see ref. 5,13 and 15 for details).| Material | V concentration/mg kg−1 | Pb concentration/mg kg−1 | Ti concentration/mg kg−1 | |||
|---|---|---|---|---|---|---|
| Measured (±1 SD) | Certified | Measured (±1 SD) | Certified | Measured (±1 SD) | Certified | |
| a Information only value. | ||||||
| Ombrotrophic Peat (NIMT/UOE/FM001) | 8.00 ± 0.87 (n = 63) | 7.82 ± 1.08 | 173 ± 11 (n = 67) | 174 ± 8 | 391 ± 25 (n = 66) | 357 ± 18a |
| Canadian Peat (1878 P) | 9.8 ± 2.0 (n = 11) | 9.7 ± 1.2a | 70.9 ± 4.7 (n = 10) | 78.8 ± 2.9a | 370 ± 23 (n = 10) | — |
| Bush Branches and Leaves (DC73349) | 2.3 ± 0.2 (n = 8) | 2.4 ± 0.4 | 44 ± 3 (n = 14) | 47 ± 3 | 90 ± 4 (n = 14) | 95 ± 20 |
| Coal (BCR CRM No. 40) | 68.3 ± 2.3 (n = 3) | — | 23.0 ± 2.0 (n = 5) | 24.2 ± 1.7 | 764 ± 63 (n = 6) | — |
| Coal (NBS SRM 1635) | 4.3 ± 0.3 (n = 5) | 5.2 ± 0.5 | 2.0 ± 0.2 (n = 5) | 1.9 ± 0.2 | — | — |
210Pb dating
The TM04M-1 and FM04-1-M cores and sister cores FM01CM-2, RM03CM-1 and CM04M, collected at the same time as FM01CM-1, RM03CM-2 and CM04CM-1, respectively, were analysed for 210Pb and 226Ra by gamma spectrometry using low-background, planar High Purity Ge gamma photon detectors (either Canberra or AMETEK ORTEC). The constant rate of supply model was applied to 210Pb inventories calculated from the unsupported 210Pb data to generate age dates for sections in TM04M-1, FM04-1-M, RM03CM-1 and CM04M.5 In the case of the FM01CM-1, RM03CM-2 and CM04CM-1 cores, 210Pb dates were obtained by extrapolation, aided by matching of 206Pb/207Pb profiles, from data for the appropriate sister cores (for further details see ref. 5, 13, 15 and 28).Results
Ombrotrophic peat bog V, Pb and Ti concentration profiles
Profiles of V, Pb and Ti concentration and of 206Pb/207Pb ratio for the TM, FM, RM and CM cores are shown along with 210Pb-derived dates in Fig. 2. During previous investigations it was found that the top of the FM01CM-1 core did not equate to the surface of the bog (2001) because of the removal of material during core collection.28Vanadium concentrations increased from minimum values of 0.4–0.7 mg kg−1 at depth to maximum sectional values of 18 mg kg−1 (TM, section mid-point dated at 1961), 21 mg kg−1 (FM, 1955), 27 mg kg−1 (RM, 1956) and 19 mg kg−1 (CM, 1950), before declining to surface-section values of 1.5, 3.1, 4.6 and 1.5 mg kg−1, respectively. The position of the V peak for each core was generally slightly above that of the Pb peak (120–1000 mg kg−1), which itself occurred above the Ti peak and during the steep decline in the 206Pb/207Pb ratio. Titanium is considered a conservative element, predominantly related to the input of soil dust.5 The changes in 206Pb/207Pb ratio reflect the changing inputs of Pb from different sources, most notably that of imported Australian Pb formerly used in the manufacture of alkyllead additives for petrol.5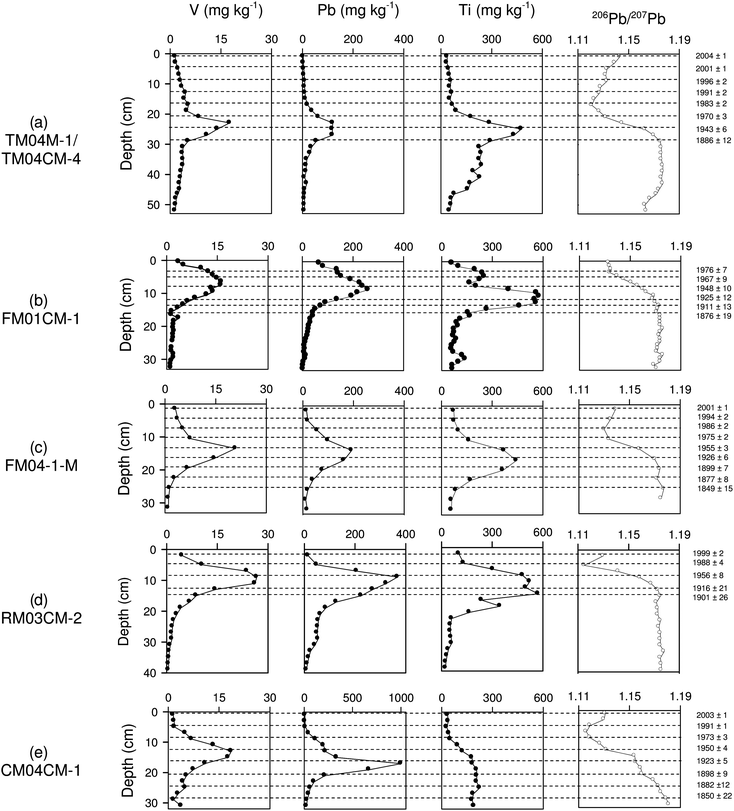 | ||
| Fig. 2 Profiles of V, Pb and Ti concentration (mg kg−1) and measured 206Pb/207Pb ratios versus depth in (a) Turclossie Moss TM04M-1/TM04CM-4, (b) Flanders Moss FM01CM-1, (c) Flanders Moss FM04-1-M, (d) Red Moss of Balerno RM03CM-2 and (e) Carsegowan Moss CM04CM-1 cores. Dotted lines show 210Pb dates (right hand axis). | ||
Discussion
Retention of V in ombrotrophic peat
The general similarity between the V and Pb concentration profiles in the cores from each of the peat bog sites (cf. Fig. 2) suggests that V, like Pb,1–5 is also immobile in ombrotrophic peat. The bulk matrix in ombrotrophic bogs is almost exclusively organic in nature (ash content < 8% in these cores) and migration of Pb is limited because Pb2+ cations are strongly bound to organic matter.11,34 It is expected that any potential for migration of V in ombrotrophic peat is also retarded by organic complexation as the vanadyl cation (VO2+), a species likely to occur under the typical pH and Eh conditions of bogs, forms very stable complexes with humic acids.35,36 Krachler et al. (2003)16 found that V was effectively immobile in a Swiss ombrotrophic peat core as it appeared to be associated with well-preserved mineral dust particles in pre-Industrial Revolution ombrotrophic peat layers and there was no enrichment in the surface Sphagnum moss layer as frequently occurs with those elements (e.g.Mn) subject to plant uptake and recycling.13,16Historical trends in atmospheric V deposition over the past 150 years
The anthropogenic contribution to the V and Pb concentrations in each peat section was calculated using eqn (1) and (2), and employing V/Ti and Pb/Ti ratios of 0.017 and 0.0055, respectively, for the Upper Continental Crust (UCC):37| [X]anthropogenic = [X]peat − [X]lithogenic | (1) |
| where [X]lithogenic = [X]/[Ti]UCC × [Ti]peat | (2) |
Such calculations have been carried out before for Pb/Ti5 and justification for the use of the UCC V/Ti ratio was provided by a consideration of the ‘background’ V and Ti concentrations at depth in TM04M-1/TM04CM-4 (46–159 cm), FM01CM-1 (55–106 cm), RM03CM-2 (32–96 cm) and CM04CM-1 (28–80 cm), for which mean V/Ti ratios of 0.022 ± 0.005, 0.022 ± 0.004, 0.020 ± 0.004 and 0.022 ± 0.005, respectively, were found. These mean ‘background’ V/Ti ratios are close to the UCC V/Ti ratio of 0.017, although the latter was preferentially used because the possible influence of past anthropogenic activities cannot be ruled out for these deep peat sections.
Anthropogenic atmospheric depositional fluxes of V were calculated for each section of the 210Pb-dated peat cores (except FM01CM-1) using eqn (3):
| Anthropogenic V flux = ([V]anthropogenic × 105 °C-dried mass of peat section)/(cross-sectional area × number of years in section) | (3) |
Fig. 3a shows that the onset of anthropogenic V deposition occurred in the mid-to-late-19th century, with maximum fluxes of 1.3–2.0 mg m−2 y−1 during the mid-20th century, before a decline to 0.1–0.3 mg m−2 y−1 in the early years of the 21st century. While not reporting fluxes, Krachler et al.16 found for a Swiss peat bog core that the anthropogenic V concentration was similarly at a maximum in the mid-20th century. In Sweden in the early 1970s, atmospheric V deposition of ∼2.5 mg m−2 y−1 was directly measured for a site 30 km north of Stockholm.38 A moss study in southern Sweden has since shown that mean V concentrations in moss decreased from 6.6 mg kg−1 in 1975 to 1.2 mg kg−1 in 2000.39 The increases in anthropogenic V fluxes during the industrial period were most likely due to emissions from metallurgical activities and fossil fuel combustion. Subsequent decreases reflect the decline in the use of fuel oils by the electricity supply industry and heavy industry as well as tighter emission controls in the UK in the later part of the 20th century.17,26 According to NAEI,17 V emissions from UK industry fell from ∼80% of the annual total of 2529 t in 1970 to ∼25% of 425 t in 2004, while those from road and other transport increased from ∼5% to ∼70% of the annual total over the same period.
 | ||
| Fig. 3 Atmospheric depositional fluxes (mg m−2 y−1) of anthropogenic V (a) and anthropogenic V/Pb ratios (b) for peat bog cores versus210Pb-derived dates since 1860. | ||
Concomitant with the increase in V fluxes was an increase in anthropogenic V/Pb ratios (Fig. 3b) to values of 0.075–0.11 by mid-20th century, followed by a slight discernible decline, at least for TM, FM and CM, to 0.05–0.09 by the mid-1970s and an increase at all sites, most notably for TM, to 0.11–0.33 by the early 21st century. These findings reflect temporal variations in the relative atmospheric inputs of V and Pb from different sources. These would include both V and Pb from metallurgical activities and coal combustion from the 19th until mid-20th century; increasing relative inputs of V from oil combustion, particularly since the 1930s, and of lead from car-exhaust emissions during the era of leaded petrol, particularly during the 1960s–1980s; and growing transport/diesel vehicle emissions of V in the 1990s and 2000s, during the period of reduction and eventual withdrawal of leaded petrol.17,40 Inventories of anthropogenic V over the past 150 years ranged from 66 mg m−2 at TM in the north to 84 (FM), 130 (RM) and 97 (CM) mg m−2 further south, the north–south gradient being less steep than the corresponding ∼4-fold increase observed for Pb.5
Recent trends in atmospheric V deposition: comparison of Scottish peat-core-derived records with direct deposition measurements and UK emission records since ca. 1970
The Turclossie Moss peat-core-derived atmospheric deposition flux of anthropogenic V of 0.26 mg m−2 y−1 for 2004 (Fig. 4a) is in good agreement with the directly measured wet deposition value of 0.247 mg m−2 y−1 for Banchory in rural north-east Scotland in 2004.41 A total (i.e. uncorrected for the contribution from soil dust) V deposition flux of 0.45 mg m−2 y−1 at Turclossie Moss is still in good agreement, especially as the directly measured wet deposition may represent only about two-thirds, on average, of total deposition (i.e. wet, dry, cloud).41 Similarly at Red Moss of Balerno, the most recent peat-core-derived anthropogenic V flux of 0.13 mg m−2 y−1 (total V 0.21 mg m−2 y−1) compares well with the directly measured wet deposition flux of 0.198 mg m−2 y−1 at Auchencorth Moss in east-central Scotland in 2004.41 The corresponding peat-core-derived anthropogenic Pb fluxes of 0.80 and 0.59 mg m−2 y−1 for Turclossie Moss and the Red Moss of Balerno, respectively, are also close to the directly determined wet deposition values of 0.706 and 0.532 mg m−2 y−1 for Banchory and Auchencorth Moss.41 | ||
| Fig. 4 Atmospheric depositional fluxes (mg m−2 y−1) of anthropogenic V (a) and anthropogenic V/Pb ratios (b) for peat core sections (closed circles) and wet deposition (open circles) at Banchory and Auchencorth,40 along with corresponding data for UK annual emissions17versus210Pb-derived or known dates from ca. 1970–2004. | ||
The peat-core-derived anthropogenic fluxes of V decreased by a factor of ∼2.4, on average (excluding 14 for RM), from ca. 1970 to the early 2000s whereas the estimated UK emissions of V decreased by a factor of ∼6, i.e. from 2590 t in 1972 to 425 t in 200417 (Fig. 4a). Over the same period, peat-core derived anthropogenic Pb fluxes declined by a factor of ∼6.9, on average (excluding 34 for RM), compared with an ∼80-fold decline in UK Pb emissions, i.e. from a maximum of 9344 t in 1973 to 117 t in 2004.17
While the anthropogenic V/Pb ratios for the peat core sections increased from ca. 1970 to values of 0.11–0.33 in 2004, in good agreement with the 0.34 reported for UK moss samples in 2000,42,43 they are an order of magnitude lower than those estimated for UK emissions (3.0–3.6) from 2000 to 200417 (Fig. 4b), i.e. the period immediately after the withdrawal of leaded petrol. As the recent peat-core-derived anthropogenic fluxes of both V and Pb appear to be in good agreement with the corresponding directly measured deposition for these elements, one explanation, apart from possible continuing overestimation of UK V emissions,27 or underestimation of Pb emissions, is that there has been some contribution to the atmosphere of previously deposited Pbvia resuspension of Pb-containing dust.44 Fowler et al.41 summed their direct deposition data for 2004 over the whole UK and found that their total Pb deposition estimate was greater than that expected on the basis of NAEI UK Pb emission data by a factor of 3.7. The anthropogenic V/Pb ratios of the peat core sections were closest to the V/Pb ratio of UK emissions during the 1980s (0.06–0.27 vs. 0.13–0.27) when resuspension of deposited Pb would have been relatively much less important as annual UK Pb emissions were 25–70 times greater than in 2000–2004. During the 1970s, the peat anthropogenic V/Pb ratios were lower (0.05–0.09) than the V/Pb ratio of annual UK emissions (0.22–0.34), a finding which, on its own, perhaps suggests more efficient trapping and retention of Pb than V by the surface vegetation on the peat bogs.45 Alternatively, given the good agreement between peat core and direct deposition V fluxes in recent years, there could still be some overestimation of UK V emissions for the earlier period.
Conclusions
This study of V in four Scottish ombrotrophic peat bogs has shown that significant V deposition arising from human activities began in the mid-to-late 19th century and peaked in the mid-20th century. The derived atmospheric V fluxes for the early 21st century are in good agreement with directly measured V deposition at nearby sites. The corresponding peat-core-derived anthropogenic V/Pb ratios in the early 2000s, however, are an order of magnitude lower than the V/Pb ratio of UK emission estimates, suggesting that V emissions are perhaps still overestimated and/or that resuspension of previously deposited Pb-containing dust is making a noticeable contribution to the atmospheric Pb burden since the outright ban on leaded petrol in 2000.Acknowledgements
We gratefully acknowledge Scottish Natural Heritage and Scottish Wildlife Trust for access to peat bog sites, the Macaulay Institute for loan of a peat corer, L.J. Eades and C. Yafa at the University of Edinburgh for assistance with field work, sample preparation and analysis, C. Donnelly at SUERC for gamma spectrometric analysis, and the UK Natural Environment Research Council for funding J.M. Cloy's PhD studentship.References
- W. Shotyk, D. Weiss, P. G. Appleby, A. K. Cheburkin, R. Frei, M. Gloor, J. D. Kramers, S. Reese and W. O. van der Knaap, Science, 1998, 281, 1635–1639 CrossRef CAS.
- A. Martinez-Cortizas, E. Garcia-Rodeja, X. Pontevedra-Pombal, D. Weiss, A. K. Cheburkin and J. C. Novoa Munoz, Sci. Total Environ., 2002, 292, 33–44 CrossRef CAS.
- J. Klaminder, I. Renberg and R. Bindler, Global Biogeochem. Cycles, 2003, 17, 1019 CrossRef.
- G. Le Roux, D. Weiss, J. Grattan, N. Givelet, M. Krachler, A. K. Cheburkin, N. Rausch, B. Kober and W. Shotyk, J. Environ. Monit., 2004, 6, 502–510 RSC.
- J. M. Cloy, J. G. Farmer, M. C. Graham, A, B. MacKenzie and G. T. Cook, Global Biogeochem. Cycles, 2008, 22, GB2016, DOI:10.1029/2007GB003059.
- S. A. Norton, G. C. Evans and J. S. Kahl, Water, Air, Soil Pollut., 1997, 100, 271–286 CrossRef CAS.
- N. Givelet, F. Roos-Barraclough and W. Shotyk, J. Environ. Monit., 2003, 5, 935–949 RSC.
- R. Bindler, Environ. Sci. Technol., 2003, 37, 40–46 CrossRef CAS.
- W. Shotyk, M. E. Goodsite, F. Roos-Barraclough, N. Givelet, G. Le Roux, D. Weiss, A. K. Cheburkin, K. Knudsen, J. Heinemeier, W. O. van der Knaap, S. A. Norton and C. Lohse, Geochim. Cosmochim. Acta, 2005, 69, 1–17 CrossRef CAS.
- J. G. Farmer, P. Anderson, J. M. Cloy, M. C. Graham, A. B. MacKenzie and G. T. Cook, Sci. Total Environ., 2009, 407, 5578–5588 CrossRef CAS.
- W. Shotyk, A. K. Cheburkin, P. G. Appleby, A. Fankhauser and J. D. Kramers, Earth Planet. Sci. Lett., 1996, 145, E1–E7 CrossRef.
- J. J. Rothwell, K. G. Taylor, E. L. Ander, M. G. Evans, S. M. Daniels and T. E. H. Allott, Sci. Total Environ., 2009, 407, 1405–1417 CrossRef CAS.
- J. M. Cloy, J. G. Farmer, M. C. Graham and A. B. MacKenzie, Environ. Sci. Technol., 2009, 43, 1756–1762 CrossRef CAS.
- W. Shotyk, M. Krachler and B. Chen, Global Biogeochem. Cycles, 2004, 18, GB1016 CrossRef.
- J. M. Cloy, J. G. Farmer, M. C. Graham, A. B. MacKenzie and G. T. Cook, J. Environ. Monit., 2005, 7, 1137–1147 RSC.
- M. Krachler, C. Mohl, H. Emons and W. Shotyk, Environ. Sci. Technol., 2003, 37, 2658–2667 CrossRef CAS.
- UK National Atmospheric Emissions Inventory, http://www.naei.org.uk/, accessed August 2010.
- T. Wällstedt, L. Björkvald and J. P. Gustafsson, Appl. Geochem., 2010, 25, 1162–1175 CrossRef.
- D. J. Swaine, Fuel Process. Technol., 2000, 65–66, 21–33 CrossRef CAS.
- T. Moreno, X. Querol, A. Alastuey, J. de la Rosa, A. M. S. de la Campa, M. Minguillón, M. Pandolfi, Y. González-Castanedo, E. Monfort and W. Gibbons, Sci. Total Environ., 2010, 408, 4569–4579 CrossRef CAS.
- J. Moldanová, E. Fridell, O. Popovicheva, B. Demirdjian, V. Tishkova, A. Faccinetto and C. Focsa, Atmos. Environ., 2009, 43, 2632–2641 CrossRef CAS.
- J. O. Nriagu and J. M. Pacyna, Nature, 1988, 333, 134–139 CrossRef CAS.
- J. Isaksan, T. A. Persson and E. Selin Lindgren, Atmos. Environ., 2001, 35, 3659–3666 CrossRef.
- R. E. Peltier and M. Lippman, J. Exposure Sci. Environ. Epidemiol., 2009, 20, 342–350 Search PubMed.
- C. J. Dore, J. D. Watterson, T. P. Murrells, N. R. Passant, M. M. Hobson, S. L. Choudrie, G. Thistlethwaite, A. Wagner, J. Jackson, Y. Li, T. Bush, K. R. King, J. Norris, P. J. Coleman, C. Walker, R. A. Stewart, J. W. L. Goodwin, I. Tsagatakis, C. Conolly, M. K. Downes, N. C. J. Brophy and M. R. Hann, UK Emissions of Air Pollutants 1970 to 2005, AEAT, Didcot, 2007 Search PubMed.
- C. J. Dore, T. P. Murrells, N. R. Passant, M. M. Hobson, G. Thistlethwaite, A. Wagner, Y. Li, T. Bush, K. R. King, J. Norris, P. J. Coleman, C. Walker, R. A. Stewart, I. Tsagatakis, C. Conolly, N. C. J. Brophy and M. R. Hann, UK Emissions of Air Pollutants 1970 to 2006, AEAT, Didcot, 2008 Search PubMed.
- R. J. C. Brown, J. Environ. Monit., 2010, 12, 665–671 RSC.
- J. G. Farmer, M. C. Graham, C. Yafa, J. M. Cloy, A. J. Freeman and A. B. MacKenzie, Global Planet. Change, 2006, 53, 240–248 CrossRef.
- W. Shotyk, S. A. Norton and J. G. Farmer, Water, Air, Soil Pollut., 1997, 100, 213–219 CrossRef CAS.
- A. Martinez-Cortizas, E. Garcia-Rodeja and D. Weiss, Sci. Total Environ., 2002, 292, 1–5 CrossRef CAS.
- R. Bindler, Global Planet. Change, 2006, 53, 209–221 CrossRef.
- C. Yafa and J. G. Farmer, Anal. Chim. Acta, 2006, 557, 296–303 CrossRef CAS.
- C. Yafa, J. G. Farmer, M. C. Graham, J. R. Bacon, C. Barbante, W. R. L. Cairns, R. Bindler, I. Renberg, A. Cheburkin, H. Emons, M. J. Handley, S. A. Norton, M. Krachler, W. Shotyk, X. D. Li, A. Martinez-Cortizas, I. D. Pulford, V. MacIver, J. Schweyer, E. Steinnes, T. E. Sjǿbakk, D. Weiss, A. Dolgopolova and M. Kylander, J. Environ. Monit., 2004, 6, 493–501 RSC.
- M. A. Vile, R. Kelman Wieder and M. Novák, Biogeochemistry, 1999, 45, 35–52 CrossRef CAS.
- A. Szalay and M. Szilágyi, Geochim. Cosmochim. Acta, 1967, 31, 1–6 CrossRef.
- A. S. Mangrich and N. V. Vugman, Sci. Total Environ., 1988, 75, 235–241 CrossRef CAS.
- K. H. Wedepohl, Geochim. Cosmochim. Acta, 1995, 59, 1217–1232 CrossRef CAS.
- G. Jacks, Environ. Pollut., 1976, 11, 289–295 CrossRef CAS.
- Å. Rühling and G. Tyler, Environ. Pollut., 2004, 131, 417–423 CrossRef CAS.
- A. S. Lefohn, J. D. Husar and R. B. Husar, Atmos. Environ., 1999, 33, 3435–3444 CrossRef CAS.
- D. Fowler, A. G. McDonald, A. Crossley, E. Nemitz, D. Leaver, J. N. Cape, R. I. Smith, D. Anderson, P. Rowland, G. Ainsworth, A. J. Lawlor, H. Guyatt and H. Harmens, UK Heavy Metal Monitoring Network, Centre for Ecology and Hydrology, Bangor, 2006 Search PubMed.
- H. Harmens, D. A. Norris, G. R. Koerber, A. Buse, E. Steinnes and Å. Rühling, Atmos. Environ., 2007, 41, 6673–6687 CrossRef CAS.
- H. Harmens, D. A. Norris, G. R. Koerber, A. Buse, E. Steinnes and Å. Rühling, Environ. Pollut., 2008, 151, 368–376 CrossRef CAS.
- J. G. Farmer, L. J. Eades, M. C. Graham, J. M. Cloy and J. R. Bacon, Sci. Total Environ., 2010, 408, 3704–3710 CrossRef CAS.
- T. Berg and E. Steinnes, Environ. Pollut., 1997, 98, 61–71 CrossRef CAS.
| This journal is © The Royal Society of Chemistry 2011 |