Non-steady response of BOD biosensor for the determination of biochemical oxygen demand in wastewater
Siiri
Velling
*,
Alexey
Mashirin
,
Karin
Hellat
and
Toomas
Tenno
Institute of Chemistry, University of Tartu, Ravila 14A, Tartu, 50411, Estonia. E-mail: siiri.velling@ut.ee; Fax: +3727375181; Tel: +3727375173
First published on 1st November 2010
Abstract
A biochemical oxygen demand (BOD) biosensor for effective and expeditious BOD7 estimations was constructed and the non-steady phase of the output signal was extensively studied. The modelling approach introduced allows response curve reconstruction and a curve fitting procedure of good quality, resulting in parameters indicating the relationship between response and organic substrate concentration and stability properties of the BOD biosensor. Also, the immobilization matrixes of different thicknesses were characterized to determine their suitability for bio-sensing measurements in non-stationary conditions, as well as for the determination of the mechanical durability of the BOD biosensor in time. The non-steady response of the experimental output of the BOD biosensor was fitted according to the developed model that enables to determine the stability of the biosensor output and dependency on biodegradable organic substrate concentration. The calibration range of the studied BOD biosensor in OECD synthetic wastewater was 15–110 mg O2 L−1. Repeatability tests showed relative standard deviation (RSD) values of 2.8% and 5.8% for the parameter τd, characterizing the transient output of the amperometric oxygen sensor in time, and τs, describing the dependency of the transient response of the BOD biosensor on organic substrate concentration, respectively. BOD biosensor experiments for the evaluation of the biochemical oxygen demand of easily degradable and refractory municipal wastewater showed good concurrence with traditional BOD7 analysis.
Environmental impactThe results of the conventional biochemical oxygen demand (BOD) method of wastewater analysis are available after a 5 to 7 day incubation period, meaning that wastewater exceeding the limited values of BOD are long discharged into the environment before the test results are obtained. Besides being portable and easily handled, BOD biosensors provide the results after approximately 3 min to 1 h. During the study, a model for a BOD biosensor response was developed that provides a new parameter with good concurrence of BOD biosensor and BOD7 values for the estimation of the content of biodegradable organic substances in a sample. Besides, the stability of BOD biosensor can be evaluated during each measurement and modelling results can be used for more effective dimensioning of the biosensor. |
1. Introduction
Determination of environmental pollution caused by biodegradable organic substances is usually analyzed by the traditional method of biochemical oxygen demand (BOD). Results of BOD tests are available after a 5 to 7 day incubation period and are thus ineffective for expeditious determination of the concentration of biodegradable organic pollutants in wastewater. In reality, the wastewater exceeding the limited values of BOD is long discharged to the environment before the test results are obtained.Determination of BOD load can be accomplished in a short time with BOD biosensors, defined as self-contained integrated devices capable of providing specific quantitative analytical information using a biological recognition element.1 The other practical advantages, besides the important rapid response time, are portability and ease of handling.
Several studies, along with review publications, have been focused on the different properties of the sensing systems of BOD biosensors, amongst them respiratory activity as a measure of BOD, detected with an oxygen sensor.2–12 Pure cultures, among them Arxula adeninivorans,13,14Pseudomonas putida,15Bacillus subtilis,16Serratia marcescens LSY4,17Pseudomonas syringae,18Trichosporon cutaneum19,20 and a mixture of two microbial strains (Bacillus subtilis and Bacillus licheniformis 7B)21 have been employed as a biochemical recognition element in BOD biosensors. For the detection of a wide variety of biodegradable organic compounds in the sample, BOD biosensors based on a mixed consortium of microorganisms immobilized within a membrane and placed onto an oxygen sensor’s membrane have been developed.3,22–24 Studies on BOD biosensors with thermally killed cells have overcome the microbial membrane bio-fouling and long-time stability problems of mixed culture based biosensors,25–27 but the advantages of living cells, such as shorter response and recovery time, are relevant to conduct expeditious dynamic measurements and perform output signal modelling.
Several aspects of BOD biosensor construction have been studied thoroughly, but less attention has been paid to more profound analysis and modelling of the output signal. There are several studies that exploit the difference between stabilized initial and final values of output data of BOD biosensors, and use the steady-state output for analytical purposes.6,21,24,28,29 This method of data analysis involves relatively simple data processing procedures, but requires a relatively long time for the signal to approach the final stabilized value.
Furthermore, less attention has been paid to BOD determinations of the non-steady or transient phase of the biosensor output.3,22,23 The methods based on the non-steady response of the biosensor are faster, but require a higher frequency of signal registration and more sophisticated data processing. Firstly, the biosensor response was modelled by an analytical solution of partial differential equations and described the substrate conversions in single or multi-enzyme membranes.30 As the approach was not applicable to biosensors with complex biocatalytical schemes and the solutions for non-steady state were complicated, digital modelling of the output signal was developed. Since then, several non-linear reaction-diffusion systems and Michaelis–Menten kinetics of enzymatic reaction based modelling studies have been published.31–37
The goal of the present study is to describe a model for an amperometric microbial biosensor and demonstrate its functionality for BOD7 determinations in wastewater. The presented method of a curve fitting procedure allows the reconstruction of the BOD biosensor response with the output values of measurements that are good indicators of life of service and stability of the BOD biosensor, providing the estimation of the content of biodegradable organic substances in the sample.
2. Experimental
2.1 Immobilization of microorganisms and construction of the BOD biosensor
A mixed culture of microorganisms was isolated from activated sludge of the municipal wastewater treatment plant (WWTP in Tartu, Estonia) and fed in a laboratory scale process with OECD synthetic wastewater for two weeks.5,38 Microorganisms, centrifuged and washed beforehand, were immobilized with a 2% suspension of agarose on the polymer net of a particular thickness using a previously published procedure. For the preparation of agarose gel layers of different thicknesses, abovementioned method was applied for polymer nets of suitable thicknesses without addition of microbes.38After immobilization, a 5 day adaptation period was necessary until an appropriately stable and substrate-sensible output signal of the BOD biosensor was achieved.13,39 For BOD biosensor measurements, the microbial membrane was then firmly attached to the top of a Clark-type oxygen sensor membrane with a special holder (WTW, CellOx 325, Germany). The diameter of microbial membrane (15.3 mm) is equivalent to the bottom diameter of the holder and fully covers the membrane of the oxygen sensor.
Reproducible results (160 BOD measurements in the whole) with the BOD biosensor were obtained over 35 days.
2.2 Analysis of BOD7 and biosensor BOD
All BOD7 analyses were performed according to the APHA Standard Methods40 and chemical oxygen demand (COD) tests by the Dr Lange COD test (Cuvette Test LCK114, Dr Bruno Lange GmbH, Düsseldorf, Germany). For calibration of the constructed BOD sensor, OECD synthetic wastewater was prepared according to the OECD guidelines.41 Every day, before the BOD biosensor measurements were taken, the COD test was performed as verification of the calibration solution. Also, BOD7 was tested for every solution and the calculated BOD7/COD ratio was a basis for further concentration calculations, as BOD7 is available after seven days. The value of the BOD7/COD ratio varied in different samples by 1–3.5% on average.BOD biosensor measurements were performed at constant temperature (25 °C) in phosphate buffer under continuous aeration with air oxygen and stirring. An appropriate amount of substrate solution was added to 100 ml of air-saturated phosphate buffer after the initial output signal of the BOD biosensor was stabilized. Before the next experiment, the BOD biosensor was removed, rinsed, and returned to the jacketed beaker containing an aliquot volume of fresh phosphate buffer.
All data were recorded in units of oxygen concentration within a 1 s time interval using in-house software, whereby the reading of the output signal of the BOD biosensor indicates oxygen concentration on the outer membrane of the oxygen sensor. Normalized experimental data were processed with non-linear least-squares regression analysis according to the proposed equation using program Origin 6.0 (Microcal Software Inc, Northampton, USA).
2.3 Wastewater samples
Wastewater samples were collected from 3 different municipal wastewater treatment plants in Estonia. One of the studied wastewater samples had a more complex composition due to the food-oil factory sending their wastewater into the municipal WWTP. All samples were settled and analyzed for COD and BOD7 according to the methods mentioned above. Between the analysis of samples and BOD biosensor experiments, samples were stored at 4–5 °C. Calibration of the BOD biosensor was always performed before measurements of wastewater samples for the verification of results and to make sure the BOD biosensor was working in optimum conditions.3. Study of the non-steady response of the BOD biosensor
3.1 Modelling the output signal of the BOD biosensor
The output current of an amperometic oxygen sensor, that could be registered as a change in oxygen concentration, appears as soon as there is a change in oxygen concentration on the cathode of the sensor. In bulk solution measurements, the mass transfer of dissolved oxygen towards the indication electrode can be described as a flow of dissolved substance through several layers with different properties in terms of diffusion. At a steady-state of the system, the relationship between oxygen flux towards the cathode and the external oxygen concentration is proportional. Under non-steady state conditions, the response and lag-time of the sensing unit depends on diffusional resistance, mostly caused by an additional microbial membrane of the biosensor, including immobilisation material. According to Benedek and Heideger's (1970) modelling study of the oxygen sensor response, the inherent lag of the process as well the change in oxygen concentration during measurement of oxygen concentration of a transient process can be described as an exponential relationship of the change.42 Also, Eddowes has proposed that non-steady state response-time dependency can be described as an exponential summation which could be the best option to describe the complex system of the immobilisation matrix, diffusion of substrates and heterogeneous kinetics of intracellular reactions.36,43,44In the present study, after the sharp addition of the organic substrate to a well-agitated oxygen-saturated measuring solution, oxygen demand of immobilized microorganisms and diffusional resistance of oxygen in the real system causes a so-called lag period of the response, followed by a change in oxygen concentration on the oxygen sensor membrane. The latter, e.g. the decay of the output signal of the real device, can be described as an exponential function. Based on above mentioned study,42 a mathematical model describing the lag-time along with transient change of oxygen concentration of BOD biosensor response has been developed.39 Thus, the detected decay of the normalised output signal in units of oxygen concentration (CO2,norm), in case the final steady-state output CO2,∞ → 0, as well the lag-time of the measuring system, is expressed as a function of time t
 | (1) |
According to the proposed model, the BOD biosensor response is characterized in the form of summation of exponential changes at appropriate conditions. To describe the parameters of the model in more detail, τs depends on the mass transfer of oxygen and the interfacial area, indicating the dependency of exponential decay of biosensor output on organic substrate concentration under invariable conditions; τd depends on the diffusion parameters of the oxygen sensor, membrane thickness and the oxygen diffusion coefficient. Therefore τd should have an invariable value under certain conditions for an appropriate biosensor, being a suitable parameter for the evaluation of output signal stability of the BOD biosensor during its life of service. To conclude, these parameters (eqn (1)) characterize the internal processes of the BOD biosensor by the lag-time and decay of the output curve.
Eqn (1) based curve fitting results were obtained with all of the normalized experimental data measured at various organic substrate concentrations. The proposed modelling approach enabled high quality curve fitting, the example of which is depicted on Fig. 1. The correlation coefficient of non-linear fitting of BOD biosensor response curves on different substrate concentrations was above 0.98 and the deviation of experimental data from the modelled results of the BOD biosensor, characterized with Pearson's chi-square, test was below 0.0005.
 | ||
| Fig. 1 Comparison of normalised experimental and modelled response data of the BOD biosensor in time. | ||
3.2 Study of oxygen sensor output with agarose gel layers of different thicknesses
In this study, preliminary tests were performed with agarose gel membranes of various thicknesses to evaluate the suitability of this modelling approach for analysis of BOD sensor response as well to find out the optimum conditions for biosensor construction. First, after the stabilisation of the oxygen sensor output signal in air-saturated distilled water, the device was sharply transferred into anaerobic conditions of the same environment and decay of dissolved oxygen content was registered at constant temperature. The same experimental scheme was used to study the non-steady response of the oxygen sensor with agarose membranes of different thicknesses attached closely on the top of it. A considerable change in the non-steady response of the device was noticed (Fig. 2). Apparently, the additional agarose layers change the non-steady response of the BOD determination system proportionally to its thicknesses (0.15–0.8 mm). To describe the impact of the above mentioned additional membranes on oxygen sensor normalised response, the parameter τs is considered to be 0 and from eqn (1), the derived dependency can be expressed as follows: | (2) |
 | ||
| Fig. 2 Change in oxygen sensor normalized response (CO2,norm) after immersion from an oxygen saturated environment into anaerobic conditions for the oxygen sensor (1) and oxygen sensor with agarose gel layers of different thicknesses attached to the membrane of sensor: (2) 0.15 mm, (3) 0.3 mm, (4) 0.5 mm and (5) 0.8 mm. | ||
According to the above described experimental method, the average value of τmatrixd describing the decay of the curve course at time t for the oxygen sensor was 3.5 s, with a deviation in results of 2–5%.
To study the stability of agarose membranes in time, τmatrixd values were computed for these potential membranes to be used in BOD biosensors. The results showed a clear dependency of τmatrixd on agarose membrane thickness and good reproducibility of the parameter values in time, indicating that the supportive nets used in conjunction with this immobilisation material are suitable for BOD biosensor construction (Table 1). Still, the experiments with immobilized microorganisms indicated a low mechanical stability of 0.15 and 0.3 mm thick membranes on a regular basis of measurements and a high limit of detection as well low sensitivity of the 0.8 mm thick microbial membrane in non-steady state conditions. For further studies with the BOD biosensor, the 0.5 mm thick microbial membrane was selected.
4. Results and discussion
4.1 BOD biosensor calibration
According to the developed model, the computed parameters found by eqn (1) are appropriate for the evaluation of performance of the output signal of the BOD biosensor. The non-linear curve fitting procedure used takes into account the variations in experimental data, mostly caused by microbial membrane fluctuations, and concurrently determines the BOD of a sample. The linear relationship of τsvs. BOD7 depicted in Fig. 3 is used for the calibration of the studied BOD biosensor within the measuring range of 15–110 mg O2 L−1. Besides the above mentioned advantages of the BOD biosensor response modelling, here the applied method broadens the range in which BOD can be determined compared to several previous studies.2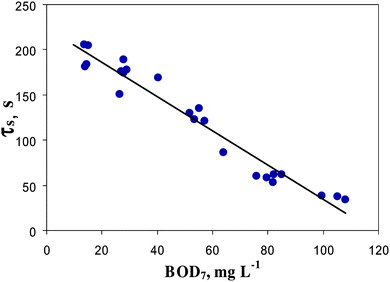 | ||
| Fig. 3 Calibration graph of the BOD biosensor: dependency of model parameter τs on the BOD7 value of the calibration solution (R2 = 0.96). | ||
4.2 Stability and reproducibility of the BOD biosensor
Several studies use the steady-state response of the BOD biosensor for calibration, analysis of real samples and performance stability studies. Usually, the main drawback of these kind of measurements is that the instability of the response is detectable after the experiments have been performed or even after all the calibration data has been gathered and the plot has been compiled. In this study, we could detect the stability of the biosensor according to the value of the computed parameter τd in a few minutes after starting the experiment. The results of stability studies of the BOD biosensor during its life of service are depicted in Fig. 4. | ||
| Fig. 4 Stability of the BOD biosensor characterized with parameter τd. | ||
Repeatability tests with three BOD biosensor experiments at organic substrate concentration 13.6 mg L−1 were performed with each of two simultaneously immobilized microbial membranes. Acceptable RSD values of 2.8% and 5.8% were gained for τd and substrate concentration dependent τS, respectively. Also, the results were comparable with previous BOD biosensor studies with OECD synthetic wastewater as a calibration solution.3,23
4.3 Estimation of BOD in wastewater
The main practical goal of BOD biosensor studies comprises the application of the device for BOD7 determination in wastewater. The composition of a sample, as well as the treatment method of biosensor output signal results in various relationships of BOD7 and BOD values determined by the biosensor.16,38,45 Herewith, the linear calibration plot (Fig. 3) is used for BOD7 determinations in real samples. The modelling studies of real samples showed an overestimation of BOD7 values of 13.4% and 13.6%, on average, for both studied municipal wastewater samples with an RSD of 7.5% and 5.0%, respectively. In most cases, the OECD degradation index, e.g. BOD7/COD ratio of municipal wastewater, is above 0.43, indicating good biodegradability. The results of BOD values determined by the BOD biosensor that are found from the course of the output signal, respond mostly to easily biodegradable substances in samples and depending on the composition of the studied samples, may result in an overestimation of BOD7. Also in this study, overestimation of the BOD7 value was noticed for municipal wastewater samples with the biodegradation index in the range of 0.43–0.61, indicating relatively easy biodegradability. The determination of BOD7 with the constructed BOD biosensor in refractory wastewater that is a mixture of municipal and food oil factory wastewater, showed an underestimation in the BOD7 value of 4–10%. The low biodegradation index of these samples (0.3 in average) indicates the refractory composition of the wastewater that is, therefore, not likely to be degradable during the analysis time of a BOD biosensor.The introduced modelling approach of a curve fitting procedure for the analysis of BOD biosensor data has several aforementioned advantages over steady-state response based methods. One of the improvements of the present BOD biosensor study is a better concurrence of BOD biosensor and BOD7 values compared to previous studies. A reason for this could be the optimized processing of the output signal, taking into account sources of experimental noise such as raw data fluctuations etc.
Conclusions
A study on extensive analysis of BOD biosensor output data and construction details was conducted. The modelling approach used allows response curve reconstruction and good quality curve fitting procedures, resulting in parameters indicating the relationship between response and organic substrate concentration and the stability of the BOD biosensor signal in time.Changes in BOD biosensor stability as well the BOD7 of studied wastewater samples can be evaluated quickly and effectively with the proposed model of the output signal of the BOD biosensor. According to the parameter τs, the relationship found between response and organic substrate concentration, e.g. the calibration range of a mixed culture of microorganisms based BOD biosensor measured in OECD synthetic wastewater, was 15–110 mg O2 L−1.
In addition, good concurrence of the BOD biosensor and BOD7 values was noticed. Depending on the composition, e.g. biodegradability of the sample, the BOD7 value, measured with the BOD biosensor may be somewhat higher or lower than conventional BOD7. The results of the BOD values determined by BOD biosensor for wastewater samples with OECD degradation index in the range 0.43–0.61 is approximately 13% higher than experimental BOD7. Analyses of refractory wastewater (BOD7/COD ratio 0.3 in average) showed an underestimation in BOD7 of 4–10%.
The optimal thickness of the immobilization matrix for BOD biosensor construction was determined during pre-testing with agarose layers of 4 different thicknesses. All studied agarose layers are potentially suitable for BOD biosensor construction, but there is a clear dependency of the course of the oxygen sensor output signal on agarose gel layer thickness. The parameter τmatrixd was used to characterize the stability of studied immobilisation matrixes in time.
Acknowledgements
This investigation was supported by the target financed project of the Estonian Ministry of Education and Research No. SF0180135s08, named “Processes in macro- and micro-heterogeneous and nanoscale systems and related technological applications”.References
- D. R. Thevenot, K. Toth, R. A. Durst and G. S. Wilson, Anal. Lett., 2001, 34, 635–659 CrossRef CAS.
- J. Liu and B. Mattiasson, Water Res., 2002, 36, 3786–3802 CrossRef CAS.
- J. Liu, L. Bjornsson and B. Mattiasson, Biosens. Bioelectron., 2000, 14, 883–893 CrossRef CAS.
- H. Nakamura and I. Karube, Anal. Bioanal. Chem., 2003, 377, 446–468 CrossRef CAS.
- J. Liu, G. Olsson and B. Mattiasson, Biosens. Bioelectron., 2004, 20, 562–570 CrossRef CAS.
- A. Kumlanghan, P. Kanatharana, P. Asawatreratanakul, B. Mattiasson and P. Thavarungkul, Enzyme Microb. Technol., 2008, 42, 483–491 CrossRef CAS.
- C. Y. Chan, M. Lehmann, K. M. Chan, P. Y. Chan, C. W. Chan, B. Gruendig, G. Kunze and R. Renneberg, Biosens. Bioelectron., 2000, 15, 343–353 CrossRef CAS.
- F. Li, T. C. Tan and Y. K. Lee, Biosens. Bioelectron., 1994, 9, 197–205 CrossRef CAS.
- S. F. D'Souza, Biosens. Bioelectron., 2001, 16, 337–353 CrossRef CAS.
- Y. Lei, W. Chen and A. Mulchandani, Anal. Chim. Acta, 2006, 568, 200–210 CrossRef CAS.
- P. Melidis, E. Vaiopoulou and A. Aivasidis, Bioprocess Biosyst. Eng., 2008, 31, 277–282 Search PubMed.
- H. Nakamura, M. Shimomura-Shimizu and I. Karube, Adv. Biochem. Eng./Biotechnol., 2008, 109, 351–394 Search PubMed.
- C. Y. Chan, M. Lehmann, K. Tag, M. Lung, G. Kunze, K. Riedel, B. Gruendig and R. Renneberg, Biosens. Bioelectron., 1999, 14, 131–138 CrossRef CAS.
- K. Riedel, M. Lehmann, K. Tag, R. Renneberg and G. Kunze, Analytical Letters, 1998, 31, 1–12 CAS.
- G. J. Chee, Y. Nomura and I. Karube, Anal. Chim. Acta, 1999, 379, 185–191 CrossRef CAS.
- K. Riedel, R. Renneberg, M. Kuhn and F. Scheller, Applied Microbiology and Biotechnology, 1988, 28, 316–318 CAS.
- M. N. Kim and H. S. Kwon, Biosens. Bioelectron., 1999, 14, 1–7 CrossRef CAS.
- S. Kara, B. Keskinler and E. Erhan, J. Chem. Technol. Biotechnol., 2009, 84, 511–518 CrossRef CAS.
- J. B. Jia and S. J. Dong, Chinese Journal of Analytical Chemistry, 2003, 31, 742–748 CAS.
- Z. Yang, S. Sasaki, I. Karube and H. Suzuki, Anal. Chim. Acta, 1997, 357, 41–49 CrossRef CAS.
- T. C. Tan, F. Li, K. G. Neoh and Y. K. Lee, Sens. Actuators, B, 1992, 8, 167–172 CrossRef.
- T. C. Tan, F. Li and K. G. Neoh, Sens. Actuators, B, 1993, 10, 137–142 CrossRef.
- Z. Yang, H. Suzuki, S. Sasaki, S. McNiven and I. Karube, Sens. Actuators, B, 1997, 45, 217–222 CrossRef.
- P. Dhall, A. Kumar, A. Joshi, T. K. Saxsena, A. Manoharan, S. D. Makhijani and R. Kumar, Sens. Actuators, B, 2008, 133, 478–483 CrossRef.
- T. C. Tan and Z. R. Qian, Sens. Actuators, B, 1997, 40, 65–70 CrossRef.
- T. C. Tan and C. H. Wu, Sens. Actuators, B, 1999, 54, 252–260 CrossRef.
- T. C. Tan and E. W. C. Lim, Sens. Actuators, B, 2005, 107, 546–551 CrossRef.
- S. Rastogi, A. Kumar, N. K. Mehra, S. D. Makhijani, A. Manoharan, V. Gangal and R. Kumar, Biosens. Bioelectron., 2003, 18, 23–29 CrossRef CAS.
- S. Rastogi, P. Rathee, T. K. Saxena, N. K. Mehra and R. Kumar, Curr. Appl. Phys., 2003, 3, 191–194 CrossRef.
- R. Baronas, F. Ivanauskas and J. Kulys, Mathematical Modeling of Biosensors, Springer, Heidelberg, 2010 Search PubMed.
- R. Baronas, E. Gaidamauskaite and J. Kulys, Sensors, 2007, 7, 2723–2740 CrossRef CAS.
- R. Baronas, F. Ivanauskas, J. Kulys and M. Sapagovas, J. Math. Chem., 2003, 34, 227–242 CrossRef CAS.
- R. Baronas, F. Ivanauskas and J. Kulys, Sensors, 2003, 3, 248–262 CrossRef CAS.
- T. Schulmeister, Selective Electrode Reviews, 1990, 12, 203–260 Search PubMed.
- R. Popovtzer, A. Natan and Y. Shacham-Diamand, J. Electroanal. Chem., 2007, 602, 17–23 CrossRef CAS.
- T. Schulmeister, J. Rose and F. Scheller, Biosens. Bioelectron., 1997, 12, 1021–1030 CrossRef CAS.
- A. Benyahia and S. Bacha, Simulation in Industry, 2004, 137–143 Search PubMed.
- S. Velling and T. Tenno, Sens. Actuators, B, 2009, 141, 233–238 CrossRef.
- S. Velling, K. Tammeveski, A. Mashirin and T. Tenno, Proc. Estonian Acad. Sci. Chem., 2002, 51, 34–48 Search PubMed.
- APHA, in Standard Methods for the Examination of Water and Wastewater, American Public Health Association, Washington DC, Editon edn, 1992, vol. Section 5210, pp. 5.1–5.6 Search PubMed.
- O. f. E. C. a. D. (OECD), Testing Chemistry, 1981, 209, 1–10 Search PubMed.
- A. A. Benedek and W. J. Heideger, Water Res., 1970, 4, 627–640 CrossRef CAS.
- R. Grima and S. Schnell, Biophys. Chem., 2006, 124, 1–10 CrossRef CAS.
- M. Eddowes, Biosensors. Practical Approach, IRL press at Oxford University Press, 1990 Search PubMed.
- C. K. Hyun, E. Tamiya, T. Takeuchi and I. Karube, Biotechnol. Bioeng., 1993, 41, 1107–1111 CrossRef CAS.
| This journal is © The Royal Society of Chemistry 2011 |