 Open Access Article
The electro-oxidation of formate ions at a polycrystalline Pt electrode in alkaline solution: an in situFTIR study
P. A.
Christensen
*,
A.
Hamnett
and
D.
Linares-Moya
School of Chemical Engineering and Advanced Materials, Bedson Building, Newcastle University, Newcastle upon Tyne, NE1 7RU, England, UK
First published on 24th May 2011
Abstract
This paper reports in situFTIR studies on the oxidation of formate at polycrystalline Pt in aqueous KOH. Data are presented which show that hydroxyl species play a major role in the electro-oxidation of small organic molecules under alkaline conditions at polycrystalline Pt, and that a number of possible mechanistic pathways are possible. Small changes in experimental conditions appear to be able to cause the reaction to flick between these pathways; for example, the presence of oxygen has a marked effect upon the observed electrochemistry. In contrast to acid solution, our postulated model includes the formation of intermediates bonded through O atoms, rather than C, as being an important option in alkaline solution. Finally, the pH distribution across the reflective electrode in external reflectance IR is modelled and significant variations in pH across the electrode surface in FTIR cells predicted and confirmed experimentally.
Introduction
The key advantage of alkaline fuel cells (AFC's, hydrogen as fuel, oxygen as oxidant) is that the oxygen reduction reaction is more facile in alkaline media1–4 resulting in the highest cell voltage at a given current density if Pt is employed at the anode and cathode, and allowing access to a wider range of cheaper cathode catalyst materials such as perovskites and Ag,1,5 as well as lower Pt loadings. The Alkaline Fuel Cell was the first fuel cell to be developed commercially, and is the best performing of all fuel cells1,3,4,6,7 capable of better than 300 mW cm−2 at 75 °C and using air as the oxidant, and 80 mW cm−2 at 40 °C under the same conditions;1 even at room temperature, it performs well.8 The performance of the AFC is such that, in contrast to H2/O2Proton Electrolyte Membrane Fuel Cell (PEMFC) data which are typically reported at 90 °C in the literature, AFC data are usually given for 40 °C.8Methanol oxidation under alkaline conditions is also more facile in alkaline electrolyte than in acid, up to an order of magnitude greater,2,9,10 and Pt anodes are not poisoned by chemisorbed fragments as is the case in acid electrolyte; thus a liquid electrolyte alkaline DMFC stack gave a maximum output of 1.5 W cm−2 at 0.25 V, 48 °C and using pressurised oxygen.9 Alkaline fuel cell technology remained focussed on the use of aqueous KOH as the electrolyte, and hence problems associated with the carbonation of the KOH and precipitation of K2CO3 essentially restricted the AFC to extra-terrestrial applications, excluding the use of air as oxidant and small organic molecules or reformate as fuel.2,10–12 The advent of Polymer Electrolyte Membranes (PEM's) and especially Nafion reduced considerably the engineering complexity associated with liquid electrolytes, and the failure to develop a stable and conductive anionic equivalent to PEM's (Alkaline Anion Exchange Membranes, AAEM's) consigned research on alkaline fuel cells to something of a backwater.7
Recent research on the development of novel AAEM's by, for example, the Surrey group13,14 and Coates and co-workers15,16 has re-ignited interest in AFC's, and in direct alcohol AFC's in particular. AAEM's employ immobilised, cationic head groups such as tetra-alkylammonium (–NR3+) and hence there are no metal cations to cause carbonate precipitation. Use of an AAEM, as in the case of PEM-based fuel cells, will reduce engineering complexity and allows, in principle, the use of reformate or small organic molecules as fuel. Furthermore, in contrast to the PEM-based Direct Methanol Fuel Cell, water transport in a direct alcohol AFC would be from the cathode to anode, opposing the cross-over of alcohol to the cathode which leads to a mixed potential and concomitant loss of performance.10 Concerns over the carbonation of the AAEM resulting in a significant voltage drop across the membrane, due to the need for accommodating OH− ions generated at the cathode with the requirement to hold the pH at the anode sufficiently low for CO2 to be lost,17 appear not to be borne out by experimental evidence.18,19 Hence, the search for novel catalysts for the anode of direct alcohol AFC's remains a valid aim in electro-catalysis.
We recently reported20 an in situFTIR study of the oxidation of methanol at a polycrystalline Pt electrode in aqueous KOH as part of an ongoing research programme. We observed a band near 1317 cm−1 which we were able to assign unambiguously to adsorbed formate;20–26 the formate is an important intermediate in methanol oxidation under the conditions employed (in our work, adsorbed CO appeared to be a spectator species, rather than an intermediate) and is adsorbed through both oxygen atoms rather than through the carbon atom, both significant observations. Formate adsorbed through both oxygen atoms has also been observed during the oxidation of methanol at Pt in acid solution, but whether it is an intermediate in methanol oxidation in acid remains controversial24–26 not least because the coverage of formate does not correlate with methanol concentration26 and it is now generally accepted that, in acid electrolyte, methanol chemisorbs through the carbon atom via sequential stripping of hydrogen atoms, with Pt3COH or PtCO as important intermediates, depending upon methanol concentration.27 In alkaline solution this would not appear to be the dominant pathway with alternative routes involving Pt–O bonds available. Furthermore, the activation energies of these alternative pathways seem to be sufficiently similar that small changes can cause the methanol oxidation reaction to ‘flick’ across to a different pathway. This was shown by us20 in experiments in O2-saturated methanolic KOH where no evidence for linearly adsorbed CO (COL) was seen at all, and all the methanol consumption appeared to be via the adsorbed formate intermediate. In addition, when the concentration of solution formate builts up sufficiently, re-adsorption of formate to COL was observed, reinforcing the postulated non-linear and dynamic nature of methanol oxidation under alkaline conditions.
In order to explore the above concepts further, we have investigated the oxidation of formate at polycrystalline Pt in both nitrogen- and oxygen-saturated aqueous KOH, and the results so obtained are presented below.
Experimental
The electrolyte solutions were prepared using Millipore water (18.2 MΩ cm) and analytical grade sulfuric acid (Aldrich). Aqueous 0.1 M KOH (Aldrich SigmaUltra >85% KOH basis) was employed as supporting electrolyte. In order to ameliorate pH effects in the thin layer20 it would have been advantageous to employ higher concentrations of KOH, but such concentrations would lead to an unacceptably high rate of etching of the prismatic window. Sodium formate (Aldrich A.C.S. Reagent >99%) was used as received. Nitrogen gas from a cryogenic boil-off was employed to de-aerate the solutions and to maintain an air-free atmosphere over the electrolyte during the measurements. Oxygen was obtained from BOC (UN1072 99.6% O2). All potentials are given vs. the Hg/HgO (Mercury/ Mercury Oxide) electrode in aqueous 0.1 M NaOH. The polycrystalline Pt electrode was ‘top hat’ shaped with an area of 0.64 cm2 polished and exposed to the electrolyte.28,29 The electrode was polished with 0.015 μm alumina (BDH), washed thoroughly with Millipore water and then immersed in Millipore water in an ultrasonic bath for several minutes prior to transfer into the spectroelectrochemical cell. The cleanliness of the electrolyte and cell was assessed by cyclic voltammetry.The in situFTIR experiments were performed using a Varian FTS-7000 spectrometer equipped with a Globar infrared source and a narrow-band MCT detector. The potentiostat was an Autolab PGSTAT.12 The spectroelectrochemical cell was home-built and fitted with a hemispherical CaF2 window28–30 (Medway optics Ltd). The cell was mounted vertically on the lid of the sample compartment of the spectrometer and was designed to allow electrolyte exchange under potential control. The cell was jacketed to allow careful control of the temperature of the electrolyte in the body of the cell. Details of the PTFE electrode holder, cell and mounting/temperature control system may be found elsewhere.30–33
The in situFTIR experiments were carried out as follows: after collecting cyclic voltammograms in the absence of methanol, the potential was held at −0.85 V and sodium formate added to a final concentration of 0.1 M, after which the electrode was pressed against the CaF2 cell window and the spectrometer allowed to purge free of CO2 and water vapour (ca. 30–60 min). The reference spectrum (SR, 100 co-added and averaged scans at 8 cm−1 resolution, ca. 35 s per scan set) was collected and a second spectrum taken at the same potential (to check for electrode movement etc), after which spectra (SS) were collected at −0.8 V and then every 100 mV up to 0.4 V vs. MMO. The spectra below are presented as:
 | (1) |
The optical path-length was estimated from the 1640 cm−1 H–O–H scissor band in the single beam reference spectrum, using an extinction coefficient34 of 21 mol−1 dm3 cm−1 and a water concentration of 55.6 M. The angle of incidence of the IR beam (assuming 0° beam divergence) on the CaF2 (n = 1.41, k = 0)35/electrolyte interface was 46° (normal incidence at the CaF2/air interface), giving an angle of incidence at the Pt electrode (assuming n = 1.33 and approximating k to 0 for water) of 51°. Even allowing for ±6° beam spread, the incidence on the inner side of the CaF2/electrolyte interface is well below the critical angle, hence precluding any enhancement effects due to total internal reflectance.35 The path-lengths in the experiments discussed below were both ca. 2.0 μm, giving thin layer thicknesses of ca. 0.6 μm.
Results
Voltammetry
The cyclic voltammetric response of polycrystalline Pt (pc-Pt) in N2 and O2-saturated 0.1 M KOH was discussed in the previous paper;20 briefly, when compared to the voltammetry in acid solution there is an additional, small wave having an onset near −0.5 V vs. MMO which may be attributed to the reversible formation of OHads.21 This peak is enhanced in O2-saturated KOH.In situ FTIR experiments
The changes in current observed during the FTIR experiments in N2 and O2 are shown in Fig. 1. In both N2 and O2 saturated solutions there is cathodic current passed until −0.6 V, with large increases in anodic current at −0.5 V to −0.3 V; up to −0.6 V, the cathodic component of the nett current, due to oxygen reduction, is significantly greater in O2 saturated solution, as may be expected.36 The large increase in anodic current at potentials >−0.5 V may indicate the involvement of OHads in the electrochemical process.26,37,38 | ||
| Fig. 1 The variation in the current observed during the in situFTIR experiments on the oxidation of 0.1 M NaOOCH in (i) N2 and (ii) O2-saturated 0.1 M KOH. | ||
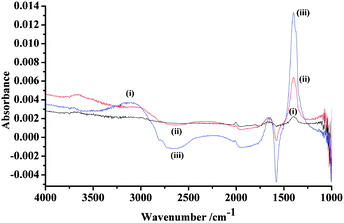
Fig. 2 shows the spectra collected at −0.8 V to −0.6 V, i.e. potentials where a nett cathodic current flows, in N2 saturated 0.1 M KOH + 0.1 M NaOOCH. As may be seen from the figure, both linearly adsorbed CO (COL, 2005 cm−1) and bridge-bonded CO (COB, 1805 cm−1)20,39–41 are formed from the chemisorption of formate; the fact that neither of these features are bipolar indicates that there is no, or very little, adsorbed CO present in the reference spectrum collected at −0.85 V, and hence the COL and COB species result from chemisorption of formate at potentials >−0.85 V. This observation is in agreement with the fact that, during methanol oxidation under the same conditions,20 high concentrations of formate resulted in re-absorption to form COL. Solution carbonate is formed at −0.6 V, band near20,41,42 1400 cm−1, presumably due to the participation of OHads; however, there is no clear decline in the intensity of the COL or COB features at −0.6 V. Features near 1657 cm−1 and associated with the appearance of HCO3− or CO32− are often attributed to uncompensated water in the thin layer or to the instability of the latter.21,40–43 It is surprising that carbonate is formed at a potential lower than the onset of OHads formation: however, in acid solution, formic acid oxidation is believed to proceed by a ‘dual path’ mechanism.25 Direct oxidation takes place via one or more weakly adsorbed intermediates and proceeds to CO2 without the formation of adsorbed CO and indirect oxidation proceeds via adsorbed CO. Formic acid oxidation by the direct pathway does not require an external oxygen source such as OHads and hence formic acid oxidation can take place at more negative potentials than required for H2O dissociation on Pt.25
 | ||
| Fig. 2 In-situ FTIR spectra (100 co-added and averaged scans, 8 cm−1 resolution) of a polycrystalline Pt electrode (0.64 cm2) immersed in N2-saturated 0.1 M NaOOCH + 0.1 M KOH collected at (i) −0.8 V, (ii) −0.7 V and (iii) −0.6 V. The reference spectrum was taken at −0.85 V vs. MMO and a second, absorbance spectrum collected at the same potential to ensure that the system was stable with respect to, for example, electrode movement. | ||
In addition to the bands due to adsorbed CO and CO32− in Fig. 2, there is clearly a major change in the nature of the water layer adjacent to the electrode, as may be seen from the behaviour of the water bands, particularly at −0.7 V where the water features are seen as two bipolar bands, centred near 3300 cm−1 and 1660 cm−1, showing that both the O–H stretch and H–O–H deformation of the interfacial water are shifting to lower frequency as the potential is increased from −0.85 V to −0.7 V, suggesting a concomitant increase in hydrogen bonding, perhaps due to association with a charged ion44–46 such as OH− or CO32−.
Fig. 3 shows analogous spectra to those in Fig. 2 from the experiment conducted in O2-saturated KOH. A consistent observation is that there are very clear differences between the spectra in O2-saturated electrolyte as compared to N2-saturated: in O2, in contrast to the case in N2-saturated solution, there is a clear, steady gain of bands associated with interfacial water, with the frequencies of both the O–H stretch and H–O–H deformation jumping to lower values at −0.7 V with the appearance of COL; i.e. 3584 to 3370 cm−1 and 1669 to 1644 cm−1, respectively, suggesting an increase in hydrogen bonding. In contrast, in acid solution, the formation of a hydrophobic COads layer is often associated with water bands shifting to higher frequency, due to a decrease in hydrogen bonding associated with the water molecules adjacent to, or buried within, the COads domains.23Fig. 1 shows that marked O2reduction is taking place in the potential region depicted in Fig. 3; in a previous paper47 we reported that O2reduction at Au in aqueous KOH was accompanied by the gain of water features near 3300 and 1640 cm−1.
 | ||
| Fig. 3 In-situ FTIR spectra of the polycrystalline Pt electrode (0.64 cm2) immersed in O2-saturated 0.1 M NaOOCH + 0.1 M KOH collected at (i) −0.8 V, (ii) −0.7 V and (iii) −0.6 V. The reference spectrum was taken at −0.85 V vs. MMO. | ||
A very significant difference between Fig. 2 and 3 is the absence of CO32− in the latter; this is not observed until −0.5 V in O2-saturated solution (see Fig. 5) and suggests that the reduction of oxygen at the electrode is inhibiting the formation of the reactive intermediate on the path to CO32−, but not the chemisorption of formate to COL, which is formed in both N2 and O2 saturated solutions, albeit the absorbance of the feature in the latter experiment is halved from 3.0 × 10⁻⁴ in N2 to 1.5 × 10⁻⁴ at −0.6 V. This suggests that, as was observed by us during the oxidation of methanol under similar conditions,21 adsorbed CO is a spectator rather than a participant in the oxidation of formate to CO32−.
Umeda and co-workers36 have reported that methanol oxidation at electro-catalysts produced by co-sputtering Pt and C is enhanced in the presence of O2 for certain compositions. The authors interpreted their data in terms of a model in which the reduction of O2 at Pt generates adsorbed OH which inhibits the oxygen reduction reaction, but enhances methanol oxidation through the removal of adsorbed CO:48
| Pt−CO + Pt−OH → 2Pt + CO2 + H+ + e− | (2) |
 | ||
| Fig. 4 In situ FTIR spectra of the polycrystalline Pt electrode (0.64 cm2) immersed in N2-saturated 0.1 M NaOOCH + 0.1 M KOH collected at (i) −0.6 V, (ii) −0.5 V and (iii) −0.4 V. The reference spectrum was taken at −0.85 V vs. MMO. | ||
It is clear from Fig. 4 that COL is present throughout the potential range of the figure, and that the production of CO32− increases significantly at −0.5 V and −0.4 V, with the concomitant loss of the solution formate band near 1581 cm−1.20 The analogous experiment in O2 saturated KOH to that depicted in Fig. 4 is shown in Fig. 5. Again, COL is present at all potentials and CO32− is produced at potentials ≥−0.5 V; however, in contrast to the experiment in N2, the formate loss feature is only observed at −0.4 V and, as was mentioned above, the appearance of the carbonate is 100 mV higher than in N2 saturated KOH. Furthermore, in Fig. 5, the water gain features are more intense than in Fig. 4.
 | ||
| Fig. 5 In situ FTIR spectra of the polycrystalline Pt electrode immersed in O2-saturated 0.1 M NaOOCH + 0.1 M KOH collected at (i) −0.6 V, (ii) −0.5 V and (iii) −0.4 V. The reference spectrum was taken at −0.85 V vs. MMO. | ||
The differences in the IR response between N2 and O2 saturated KOH are even more marked over the potential range −0.4 V to −0.1 V, see Fig. 6 and 7. A comparison of the spectra collected at −0.4 V and −0.1 V in the experiments depicted in Fig. 6 and 7 is presented in Fig. 8(a) and (b), respectively, and plots of the CO2 absorbance observed in the N2 and O2 experiments between −0.85 V and +0.4 V are shown in Fig. 8(c).
 | ||
| Fig. 6 In situ FTIR spectra of the polycrystalline Pt electrode immersed in N2-saturated 0.1 M NaOOCH + 0.1 M KOH collected at −0.4 V to −0.2 V. The reference spectrum was taken at −0.85 V vs. MMO. | ||
 | ||
| Fig. 7 In situ FTIR spectra of the polycrystalline Pt electrode immersed in O2-saturated 0.1 M NaOOCH + 0.1 M KOH collected at (i) −0.4 V to (iii) −0.2 V. The reference spectrum was taken at −0.85 V vs. MMO. | ||
 | ||
| Fig. 8 The spectra collected at (a) −0.4 V and (b) −0.1 V in Fig. 6 and 7. (c) Plots of CO2 absorbance at 2340 cm−1 from the experiments depicted in Fig. 4 and 5. (i) N2- and (ii) O2-saturated KOH. | ||
The differences in behaviour between N2 and O2 saturated KOH are clear in the figures. The feature at 2340 cm−1 may be attributed to solution CO2 the onset potential of which is −0.3 V in both O2 and N2 saturated electrolyte (see Fig. 8(c)), and which suggests that the pH in the thin layer is comparable to or less than pKa,1 of carbonic acid (6.37; pKa,2 = 10.25 )51 at the potentials in the figure. From Fig. 8(c) it can be seen that the CO2 produced in the two experiments is very significantly different, with ca. 5x more generated in the O2 experiment, supporting our postulate that the mechanism is very finely balanced; the decrease in the CO2 absorbance at potentials > 0 V is due to the CO2 forming bubbles and pushing the electrolyte out of the thin layer.20
Fig. 8(a) shows the spectra collected at −0.4 V in the N2 and O2-saturated electrolyte; apart from the changes in the interfacial water structure, there is very little difference between the two spectra, and the absorptions of the CO32− bands are comparable. Closer inspection of both the CO32− features in Fig. 8(a) suggests a shoulder to the CO32− feature on the low wave-number side, and this is seen more clearly in Fig. 8(b), and Fig. 6 and 7, where a sharper feature grows in at 1366 cm−1 in both experiments. However, whilst the feature grows on the side of the carbonate peak in N2-saturated solution, it dominates the spectra collected in O2-saturated KOH, increasing to a maximum intensity at −0.1 V, with a concomitant decrease in the 1400 cm−1CO32− band. The data in Fig. 6, 7, 8(a) and (b) suggest that the 1366 cm−1 band grows with the carbonate band up to −0.4 V, before the division in behaviour takes place. The broad band in the H–O–H deformation region near 1650 cm−1 seems to grow with the 1366 cm−1 feature. The former is clearly not entirely due to water as there is no matching increase in the O–H stretching region, compare Fig. 8(a) and (b), and the 1366 and 1650 cm−1 bands may be attributed to the symmetric and asymmetric stretching bands of HCO3− in solution.42 However, this would require CO32−, HCO3− and CO2 to be present at the same time in the spectra in Fig. 6–8, which clearly is not a viable option if the solution is homogeneous.
In fact the situation with regard to the very thin-layer cell used in electrochemical reflectance IR is such that under a wide variety of conditions a substantial pH gradient can form across the radial dimension of the electrode surface. The reason for this is that lateral diffusion of OH− is extremely slow compared to diffusion between the electrode and window, and this can be modelled with the equations for cylindrical diffusion, as described by Crank.54 The details of the model are given in the Appendix, and a representative result is given for the oxidation of an organic molecule in which OH− is consumed at the rate of four ions for every organic molecule oxidised, and we assume for simplicity that the initial concentrations of formate and hydroxyl ions are the same as are their diffusion coefficients. In practice, qualitatively similar results are obtained for a very wide variety of input conditions, and these will be the subject of separate contribution in due course. The essential point is that the formation of a pH gradient is almost inevitable in the types of thin-layer cells used in specular reflection FTIR, and must be borne in mind in interpreting the data.
The possibility that the 1366 cm−1 band is due to HCO3− in ionically isolated regions of electrolyte is supported by its persistence. The band is present as a gain feature in both N2 and O2spectra up to +0.4 V normalised to the reference taken at −0.85 V, see Fig. 9(a) and (b). For example, in O2 saturated KOH, see Fig. 9(b), the CO2 gas evolution is such that the solution is pushed out of the thin layer, as shown by the large loss features near 3300 cm−1 and 1650 cm−1 due to `MOH affected’ bulk water,20,49 and the solution formate bands near 1581, 1382 and 1351 cm−1, yet the 1366 cm−1 band is relatively unchanged over the potential range from 0 V to 0.4 V. The CO2 evolution in Fig. 9(a) is insufficient for bubbles to form, see Fig. 8(c). Fig. 9(a) also clearly shows the persistence of the COL feature, which is retained throughout the −0.8 V to −0.2 V potential range, albeit at a lower intensity in O2 saturated KOH than N2 saturated. Loss features due to ‘bulk’ water, coupled with the gain of CO2, have been observed before and unambiguously attributed to CO2 bubble formation and the concomitant ejection of electrolyte from the thin layer (see, for example, ref. 20). However, there may well be a contribution from the increased coverage of the surface by O-containing species, leading to blockage of active sites, and hence decreasing CO2 formation.
 | ||
| Fig. 9 In situ FTIR spectra of the polycrystalline Pt electrode immersed in (a) N2 and (b) O2-saturated 0.1 M NaOOCH + 0.1 M KOH collected at (i) 0 V, (ii) 0.1 V, (iii) 0.2 V, (iv) 0.3 V and (v) 0.4 V. The reference spectra were taken at −0.85 V vs. MMO. | ||
Discussion
The results of the methanol oxidation experiments described previously20 clearly demonstrate that the main active intermediate in methanol oxidation in alkaline solution is notcarbon-bonded but rather bonded through oxygen. This is quite different from the situation in acidic electrolytes, where carbon-bonded intermediates appear to constitute the major mechanistic pathways, and it raises the question of why, in alkaline solution, there is such a difference. One important distinction in alkaline solutions is the presence of significantly higher concentrations of OHads which will tend to polarise the Pt atoms at the surface through the adsorbed σ-acceptor hydroxy-species leading to stabilisation of bonding to surface-adsorbed σ-donors such as formate and related species. It is unclear whether this is a dominant effect, however; one important aspect of the oxidation of even simple organic species is the apparently very small energy differences between different reaction pathways, and small differences in the nature of the electrode surface may be able to tip reactions into very different routes. This effect is exacerbated by the non-linearity of the kinetic equations; this non-linearity can lead to very complex and unpredictable behaviour that has been recognised for many years (ref. 53, p. 86), giving rise to phenomena such as oscillations in the reaction rate. It is important to recognise that this sensitivity to reaction conditions means that experiments in which the morphology of the Pt is substantially altered, or in which the potential protocol departs too far from that normally found in fuel cells, may well lead to different pathways dominating.It is also clear from the results above that Pt–C bonds do indeed form in alkaline solution, and both COL and COB can be identified in the spectra. However, the intensity of these bands suggests that they are not participants in the electrochemical processes on the surface, but rather simply play a spectator role. The coverage of COads is also rather insensitive to the formate concentration. At −0.6 V, for example, in 1 M formate, the IR absorbance is 4 × 10⁻⁴ and in 0.1 M formate, the absorbance is very similar: 3.3 × 10⁻⁴ and this rather suggests that there is a proportion of the surface, perhaps a facet of a particular face such as (111) that does adsorb CO but on other facets OHads successfully competes, destabilising the COads and stabilising O-bonded adsorbates. Support for this notion comes from the observation that in the presence of O2, very much less COads is seen compared with N2-saturated solution.
This is an interesting observation, since it suggests that the main role of the oxygen is to increase the coverage of OHads, which has the two consequences of reducing surface-blocking by COads and enhancing the stability of active O-bonded intermediates. The total charge passed in the presence of O2 is significantly larger than that passed in the presence of N2, by a factor of about 20% accounting for the difference in overall product quantities seen in the two experiments. Given the relative quantities of formate oxidised and O2 present, this must be a catalytic effect rather than involving the direct participation of O2 itself, and it would appear that our model of the OHads as an important promoter in this system, and particularly its ability to prevent surface blocking by COads is supported by the experimental evidence above.
Finally, our results shed light on the assignment of the IR features due to OH−(aq.); the broad loss features normally observed in external reflectance IR spectra in alkaline solution and associated with the consumption of OH− ions may be attributed to the continuum absorptions of aqueous OH−.
Conclusions
The FTIR data for the oxidation of formate in alkaline electrolyte demonstrate that adsorbed hydroxyl species can have a major effect on steering the reaction mechanism as well as participating directly in the oxidation of intermediates in the formate oxidation itself. Part of the surface is covered with OHads even in the presence of N2, and it would appear that coverage of part of the surface with adsorbed CO is inhibited by the OHads. In the presence of O2, additional OHads forms as a result of O2reduction at lower potentials, so that as the potential is ramped up, even less COads forms than in the presence of N2, giving a more active surface. The presence of OHads has two effects: it prevents part of the surface being blocked by adsorbed spectator species such as COads and it facilitates adsorption of active O-bonded species. At higher potentials, once OHads has formed, it can be replenished by oxidation of water, and the surface retains a high coverage of OHads giving it a high activity.Appendix 1—lateral diffusion in the FTIR cell
The basic equation for cylindrical diffusion of a single species is: | (3) |
 | (4) |
 | (5) |
 | (6) |
 | (7) |
 whence
| λ(2i−1)C′(i−1) − 4i(λ + 1)C′(i) + λ(2i + 1)C′(i + 1) = −λ(2i − 1)C(i − 1) + 4i(λ − 1)C(i) − λ(2i + 1)C(i + 1) | (8) |
 | (9) |
| −(1 + 2λ)C′(0) + 2λC′(1) = −(1 − 2λ)C(0) − 2λC(1) | (10) |
| λ(2N − 1)C′(N − 1) − 4N(1 + λ)C′(N) = −(2N − 1)λC(N − 1) + 4N(λ − 1)C(N) − 2(2N + 1)λC(N + 1) | (11) |
and:

In the geometry found in specular infra-red cells, the cylindrical electrode is pressed against an infra-red-transparent window, leaving a narrow electrolyte gap of about 1 micron width. The electrolyte contains an electroactive material which is assumed to be consumed at a rate proportional to kfc and if the cell gap is h then the pure diffusion equation transforms to:

 | (12) |
We can form the Crank–Nicholson equations essentially in the same way as above, and save for the end points we have:

 | (13) |

The method above has been programmed in Fortran 77 and some typical results for a model system in which an organic molecule is oxidised in the presence of OH− to a surface-bound species are shown in Fig. 10. The pH distribution across the electrode is shown as close to linear after some 103 s, varying from 5 up to 13 in the 0.1 M solution investigated. The important point about the figure is that the limitation on the diffusion rate of OH− leads to a range of pH values being exhibited simultaneously across the electrode, and thus such a range will be seen in the resultant spectrum. It is, therefore, perfectly possible for the outer part of the electrode to be close to pH 13 but the inner part, near the centre, to be at a much lower pH; all products over the range of pH values will be seen. In the case of oxidation of formate, it is, therefore, possible to see simultaneously CO32−, HCO3− and CO2, an important point to bear in mind when assignments are being made.
 | ||
| Fig. 10 pH variation across the electrode surface for a model calculation using the approach in Appendix 1. | ||
Acknowledgements
DLM would like to thank Universidad del Zulia for sponsorship.References
- G. F. McLean, T. Niet, S. Prince-Richard and N. Djilali, Int. J. Hydrogen Energy, 2002, 27, 507 CrossRef CAS.
- J. S. Spendelow and A. Wieckowski, Phys. Chem. Chem. Phys., 2007, 9, 2654 RSC.
- E. H. Yu, U. Krewer and K. Scott, Energies (Basel, Switz.), 2010, 3, 1499 Search PubMed.
- E. Antolini and E. R. Gonzalez, J. Phys. Chem., 2010, 195, 3431 Search PubMed.
- R. S. Jayashree, D. Egas, J. S. Spendelow, D. Natarajan, L. J. Markoski and P. J. A. Kenis, Electrochem. Solid-State Lett., 2006, 9, A252 CrossRef CAS.
- J. Larminie and A. Dicks, Fuel Cell Systems Explained, Wiley, Chichester, UK, 2nd edn, 2004 Search PubMed.
- W. Vielstich, A. Lamm and H. A. Gasteiger, Handbook of Fuel Cells, Wiley, Chichester, UK, 2003, vol. 1–6 Search PubMed.
- K. Kordesch, in ref. 7, vol. 1 p. 267.
- J. Prabhuram and R. Manoharan, J. Power Sources, 1998, 74, 54 CrossRef CAS.
- J. R. Varcoe and R. C. T. Slade, Fuel Cells, 2005, 5, 187 CrossRef CAS.
- E. J. Guzlow, J. Power Sources, 1996, 61, 99 CrossRef.
- M. Cifrain and K. V. Kordesch, J. Power Sources, 2004, 127, 234 CrossRef CAS.
- J. R. Varcoe, R. C. T. Slade, E. L. H. Yee, S. D. Poynton, D. J. Driscoll and D. C. Apperley, Chem. Mater., 2007, 19, 2686 CrossRef CAS.
- S. D. Poynton, J. P. Kizewski, R. C. T. Slade and J. R. Varcoe, Solid State Ionics, 2010, 181, 219 CrossRef CAS.
- N. J. Robertson, H. A. Kostalik IV, T. J. Clark, P. F. Mutolo, H. D. Abruña and G. W. Coates, J. Am. Chem. Soc., 2010, 132, 3400 CrossRef CAS.
- H. A. Kostalik IV, T. J. Clark, N. J. Robertson, P. F. Mutolo, J. M. Longo, H. D. Abruña and G. W. Coates, Macromolecules, 2010, 43, 7147 CrossRef CAS.
- Y. Wang, L. Li, L. Hu, L. Zhuang, J. Lu and B. Xu, Electrochem. Commun., 2003, 5, 662 CrossRef CAS.
- C. Bianchini, V. Bambagione, J. Filippi, F. Vizza, P. Bert and A. Tampucci, Electrochem. Commun., 2009, 11, 1077 CrossRef CAS.
- P. A. Christensen, A. Hamnett and D. Linares-Moya, Phys. Chem. Chem. Phys., 2011, 13, 5206 RSC.
- P. A. Christensen and D. J. Linares-Moya, J. Phys. Chem. C, 2010, 114, 1094 CrossRef CAS.
- Q. S. Chen, S. G. Sun, Z. Y. Zhou, Y. X. Chen and S. B. Deng, Phys. Chem. Chem. Phys., 2008, 10, 3645 RSC.
- M. Endo, T. Matsumoto, J. Kubota, K. Domen and C. Hirose, J. Phys. Chem. B, 2000, 104, 4916 CrossRef CAS.
- A. Miki and M. Osawa, Chem. Commun., 2002, 1500 RSC.
- Y.-X. Chen, M. Heinen, Z. Jusys and R. J. Behm, Langmuir, 2006, 22, 10399 CrossRef CAS.
- Y.-X. Chen, Y. Shen, M. Heinen, Z. Jusys, M. Osawa and R. J. Behm, J. Phys. Chem. B, 2006, 110, 9534 CrossRef CAS.
- K. Kunimatsu, H. Hanawa, H. Uchida and M. Watanabe, J. Electroanal. Chem., 2009, 632, 109 CrossRef CAS.
- A. Hamnett, in Interfacial Electrochemistry: Theory Experiment and Applications, ed. A. Wieckowski, Marcel Dekker, New York, 1999, p. 843 Search PubMed.
- W. F. Lin, P. A. Christensen, A. Hamnett, M. S. Zei and G. Ertl, J. Phys. Chem. B, 2000, 104, 6642 CrossRef CAS.
- W. F. Lin, P. A. Christensen and A. Hamnett, J. Phys. Chem. B, 2000, 104, 12002 CrossRef CAS.
- W. F. Lin, P. A. Christensen, J. M. Jin and A. Hamnett, in In-situ Spectroscopic Studies of Adsorption at the Electrode and Electrocatalysis, ed. S. G. Sun, P. A. Christensen and A. Wieckowski, Elsevier, Amsterdam, 2007, p. 99 Search PubMed.
- J. M. Jin, W. F. Lin and P. A. Christensen, J. Electroanal. Chem., 2004, 563, 71 CrossRef CAS.
- P. A. Christensen, J. M. Jin, W. F. Lin and A. Hamnett, J. Phys. Chem. B, 2004, 108, 3391 CrossRef CAS.
- J. M. Jin, W. F. Lin and P. A. Christensen, Phys. Chem. Chem. Phys., 2008, 10, 3774 RSC.
- J. G. Bayly, V. B. Kartha and W. H. Stevens, Infrared Phys., 1963, 3, 211 CrossRef CAS.
- P. W. Faguy and W. R. Fawcett, Appl. Spectrosc., 1990, 44, 1309 CrossRef CAS.
- M. Umeda, K. Nagai, M. Shibamine and M. Inoue, Phys. Chem. Chem. Phys., 2010, 12, 7041 RSC.
- Y. X. Chen, A. Miki, S. Ye, H. Sakai and M. Osawa, J. Am. Chem. Soc., 2003, 125, 3680 CrossRef CAS.
- G. Garcia and M. T. M. Koper, Phys. Chem. Chem. Phys., 2009, 11, 11437 RSC.
- E. Morallón, A. Rodes, J. L. Vázquez and J. M. Pérez, J. Electroanal. Chem., 1995, 391, 148.
- Z.-Y. Zhou, N. Tian, Y.-J. Chen, S.-P. Chen and S.-G. Sun, J. Electroanal. Chem., 2004, 573, 111 CrossRef CAS.
- G. García, P. Rodríguez, V. Rosca and M. T. M. Koper, Langmuir, 2009, 25, 13661 CrossRef CAS.
- K. Arihara, F. Kitamura, T. Ohsaka and K. Tokuda, J. Electroanal. Chem., 2001, 510, 128 CrossRef CAS.
- T. Iwasita, A. Rodes and E. Pastor, J. Electroanal. Chem., 1995, 383, 181 CrossRef.
- F. Kitamura, T. Ohsaka and K. Tokuda, Electrochim. Acta, 1997, 42, 1235 CrossRef CAS.
- M. Futamata, J. Electroanal. Chem., 2003, 93, 550–551.
- Th. Wandlowski, K. Ataka, S. Pronkin and D. Diesing, Electrochim. Acta, 2004, 49, 1233 CrossRef CAS.
- J. Brooker, P. A. Christensen, A. Hamnett, R. He and C. A. Paliteiro, Faraday Discuss., 1992, 94, 339 RSC.
- M. Watanabe and M. Motoo, J. Electroanal. Chem., 1975, 60, 267 CrossRef CAS.
- M. Śmiechowski and J. Stangret, J. Mol. Struct., 2007, 834–836, 239 CrossRef CAS.
- D. Schioberg and G. Zundel, J. Chem. Soc., Faraday Trans. 2, 1973, 69, 771 RSC.
- N. B. Librovich, V. P. Sakun and N. D. Sokolov, Chem. Phys., 1979, 39, 351 CrossRef CAS.
- CRC Handbook of Chemistry and Physics, ed. R. C. Weast, CRC Press, Florida, 66th edn, 1986 Search PubMed.
- W. Vielstich, Brennstoffelemente, Verlag Chemie GmBH, Weinheim, 1965 Search PubMed.
- J. Crank, The Mathematics of Diffusion, Clarendon Press, Oxford, 2nd edn, 1975 Search PubMed.
- D. Britz, Digital Simulation in Electrochemistry, Springer, Berlin, 3rd edn, 2005 Search PubMed.
| This journal is © the Owner Societies 2011 |