 Open Access Article
Simulation of generation–collection experiments with homogeneous kinetics: application to electrochemical investigation of superoxide radical anion generation by osteoclasts on bone
Received
1st November 2010
, Accepted 7th January 2011
First published on 31st January 2011
Abstract
We report simulations of electrochemical generation–collection experiments in which the generator is a small disc producing a specified time-dependent flux of the analyte and the collector is a large planar electrode which collects the analyte at the mass transport-controlled rate. This geometry corresponds to many experiments in bioelectrochemistry where a relatively large sensor is used to detect the products of a cell's metabolism at low concentration. In particular, our simulations are motivated by attempts to understand our results on the detection of the superoxide radical anion burst generated by osteoclasts (bone-resorbing cells) in response to various stimuli. Superoxide is present at low levels and disproportionates in aqueous media; however, the homogeneous kinetics are included in our simulations and the results show that it is possible to estimate the magnitude of the flux of superoxide produced by the cells and to accurately determine the time-dependence of the flux in response to stimuli such as injection of parathyroid hormone, vitamin D3 and pertussis toxin. In all these cases, the superoxide anion flux was successfully modeled as uniform across the cell surface with time-dependence of the form j0e−kdt + j∞. j∞ is the sustained flux of superoxide and the first-order rate constant kd and the magnitude j0 describe the transient component of the flux. The simulations indicate that for cell–electrode gaps  , where D is the diffusion coefficient, the value of kd can be accurately extracted from the time-dependence of the collector current without detailed knowledge of parameters which are hard to measure during the experiment, e.g., the cell radius a and cell–electrode separation d. In the case of parathyroid hormone, the first-order rate constant describing the decay of the transient component was kd = 1.8 ± 0.8 × 10⁻¹ s−1, but much slower decays were observed in response to pertussis toxin (kd = 1.5 ± 0.5 × 10⁻² s−1) and vitamin D3 (kd = 1.1 ± 0.5 × 10⁻³ s−1).
1. Introduction
Superoxide anions are an important analyte in bioanalytical chemistry because of their role in cell signaling and inflammatory reactions.1Electrochemical detection methods offer some advantages in terms of their speed of response and detection limit.2,3 In particular, the superoxide anion sensor based on cytochrome c-modified electrodes,4,5 has enabled the observation of bursts of superoxide anion at various cells, including the osteoclast.6–8
The osteoclast is a multinuclear cell which is specialized to perform extracellular bone resorption, which is a process of dissolution involving the secretion of hydrolytic enzymes and protons and the generation of superoxide anions (O2˙−). Both indirect and direct measurements have shown that osteoclasts produce O2˙−;9 the production of the anion being inhibited by calcitonin and elevated extracellular calcium, and stimulated by bone matrix and PTH.6,7 The observations in these studies suggest that the inhibitory or stimulatory effects of various agents on osteoclastic bone resorption are mirrored in their effect on O2˙− production by these cells and imply a link between O2˙− production and osteoclast activity. Osteoclasts, like neutrophils and macrophages, also express NADPH oxidase.10Neutrophils and macrophages are known to produce O2˙− by activating the NADPH oxidase system following exposure to bacteria, which is an essential step in the destruction and phagocytosis of the pathogens. In contrast, O2˙− produced by osteoclasts has been shown to be up-regulated by components of the extracellular matrix and inhibited by elevated extracellular calcium.6 Murine osteoclasts have also been shown to generate O2˙−via Nox 4 in p91 knockout mice which lack the membrane-bound catalytic subunit of the NADPH oxidase.11
The importance of free radicals in osteoclast function has been demonstrated by the fact that the presence of superoxide dismutase12 or nitric oxide13 leads to the abolition of cell resorptive activity. Oxygen-derived free radicals were found to be associated with new bone formation and enhanced bone resorption. The calciotropic hormones which stimulate or inhibit osteoclasts were found to have corresponding stimulatory and inhibitory effects on the O2˙− generation by the osteoclasts.8 The active metabolite of vitamin D, 1,25-dihydroxycholecalciferol D3, is known to have a powerful stimulatory effect on in vivo and in vitrobone resorption. Osteoclastic bone resorption is inhibited by calcitonin which leads to increased levels of cytosolic cAMP and calciumvia two different G-proteins14 as well as a reduction in the rate of superoxide generation by the cell.8 Furthermore, the exposure of the neonatal mouse calvarial and bone slice–osteoclast assays in vitro to superoxide dismutase was found to inhibit bone resorption.
In view of the significant role of O2˙− in osteoclastic bone resorption, it is important to understand the precise intracellular signaling that is involved in the regulation of free radical production. Although it was originally believed that the modulation of osteoclast activity by major hormones, such as parathyroid hormone (PTH), 1,25-dihydroxycholecalciferol D3, and oestrogens is mediated indirectly viacells of osteoblast lineage, several reports have shown that osteoclasts possess receptors for PTH,15,161,25-dihydroxycholecalciferol D317 and oestrogens.18 Indeed, the exposure of individual avian osteoclasts to PTH has been observed to stimulate hydrogen ion production via a G-protein coupled receptor.19Electrochemical detection of superoxide anion has been employed in order to monitor rapid changes in the rate of free radical generation and has demonstrated that PTH produces an immediate burst of superoxide anion in isolated rat osteoclasts.7 This superoxide anion burst is detected within seconds of the stimulation and we have argued that this timescale is too short for an explanation based on diffusion of factors released by osteoblasts.8,20 The fact that osteoclasts possess vitamin D receptors and that 1,25-dihydroxycholecalciferol D3 can act via a membrane receptor protein in other cells,21 suggested a possible acute effect of 1,25-dihydroxycholecalciferol D3 on O2˙− generation in the osteoclasts, which was also confirmed by direct electrochemical detection of superoxide anion.22 One possible explanation of the failure of earlier studies to identify direct acute modulatory effects of these major hormones on the osteoclast is the dependence of earlier studies on the in vitrobone resorption pit assay, which has well-known limitations; being rather insensitive and requiring prolonged incubation.23 The superoxide anion-sensitive electrode allows much more rapid measurements4 and the amount of O2˙− produced by individual neutrophils has been estimated using electrochemical methods.24 However a quantitative description of the time-dependence of the detection response which includes the decay of superoxide by disproprotionation between the cell and the electrode has not yet been made.
In this report, we develop a reaction–diffusion model for the electrochemical detection of the superoxide anion burst. This model is applicable to any generation–collection experiment in bioelectrochemistry which uses a large collector electrode to determine an analyte generated by a smaller cell. The model allows for the decay of the analyte by first or second-order homogeneous reactions in the gap between the generator and the collector. The important output from these simulations is the time-dependence of the collector current and its relation to the time-dependent flux at the generator. Using these simulations, we have been able to extract the time-dependence of the superoxide anion burst from the measured current transients.
2. Experimental
2.1 Reagents
Cytochrome c
from horse heart, bovine liver superoxide dismutase (SOD), calcitonin, cholecalciferol, pertussis toxin, parathyroid hormone (PTH), fetal calf serum (FCS) and other organic or inorganic chemicals were purchased from Sigma (Sigma Company Ltd, Poole, UK). 3,3-Dithiobis (sulfosuccinimidyl propionate) (DTSSP) was supplied by Pierce and Warriner (Chester, UK). Sodium perchlorate and MgCl2 were supplied by BDH (BDH Laboratory supplies, Poole, UK). Medium 199 with HEPES was from Gibco, and fetal calf serum was obtained from Life Technologies, (Renfrewshire, UK).
2.2
Osteoclast isolation and culture
Bovine cortical bone circular slices 13 ± 1 mm in diameter and approximately 1 mm thickness were used as substrata for the osteoclast cultures. New-born Wistar rats (2–3 days old) were killed by cervical dislocation, their long bones removed and freed from any tissues and curetted into pre-warmed Medium 199 containing 10% fetal calf serum (37 °C). The cell suspension was then left for 90 min at 37 °C in a humidified 5% CO2 incubator, allowing the osteoclasts to adhere to the substrate. Cellular debris was removed by washing the preparation vigorously with a pre-warmed phosphate buffer (37 °C), comprising 145 mM NaCl, 4.5 mM KCl, 5 mM NaH2PO4, 6 mM glucose, 10 mM HEPES, 1 mM MgCl2 and adjusted to pH 7.4 with NaOH, leaving the osteoclasts attached to the substrata. Experiments were carried out in wells containing 0.5 mL of the phosphate buffer and an individual slice of bone onto which osteoclasts were attached. For each slice, osteoclasts from one neonatal rat were used. The contaminating non-osteoclast cells were removed by exposing the cell cultures for 3 min to trypsin/EDTA and then washing vigorously with the pre-warmed phosphate buffer (37 °C) of the composition given above. The purity of the osteoclast preparation was checked by microscopy and the presence of osteoblasts was determined by histochemical staining for alkaline phosphatase (Procedure 85; Sigma Company Ltd, Poole, UK). This process was found to produce an osteoclast population of high purity (85–95%).
2.3 Characterization of osteoclasts on bone slice
Osteoclasts were characterized by their morphology and ability to carry out characteristic excavations in the in vitrobone resorption assay and by their sensitivity to calcitonin. In order to further characterize the osteoclasts, the bone slices were stained with tartrate-resistant acid phosphatase following an established protocol (kit No. 386, Sigma Company Ltd). Briefly, the cells were fixed on the bone slice in citrate/acetone solution for 30 s and the slices were then rinsed in de-ionized water and allowed to air dry for a minimum of 15 min. The slices were then incubated in an acetate/tartrate solution for one hour at 37 °C in the dark, washed for 3 min in de-ionized water and stained in acid hematoxylin solution for 5 min. The number and density of the osteoclasts on well-rinsed and dried slices was ascertained using a Nikon TMS microscope (London, UK ×400 magnification).
2.4 Instrumentation
The electrochemical instrumentation consisted of a locally-constructed potentiostat for the O2˙− measurement (Electronics Workshop, School of Chemistry, University of Newcastle upon Tyne) interfaced to a PC via an analog/digital interface board (DAS1602, Keithley Metrabyte, Reading, UK). The software was written in MS Visual Basic™ and was used to control the potentiostat, emulate a Y-t chart recorder and transfer the current–time data to a spreadsheet for graphing and analysis. The currents measured at mm-sized superoxide electrodes in our experiments were in the range 1–100 pA and therefore an earthed aluminium box was used as a Faraday cage to contain the experimental culture well and the electrodes were connected to the potentiostatvia guarded inputs. The position of the electrode could be controlled by using two stepper motor driven translation stages with micron resolution (MFN08-PP, Newport, Berkshire, UK) mounted in a X–Z configuration. The motors were interfaced to the PC via a driver card (Motor Technology, Stockport, UK) and a programmable stepper motor controller interface (MSTEP-5, Keithley Metrabyte, Reading, UK).
2.5 Measurements of superoxide anion production at osteoclasts
The superoxide sensitive electrode was made as previously described.4 A gold wire (5 mm in length and 1 mm in diameter) was soldered to a copper wire before inserting the whole in a capillary glass tube of 2 mm in diameter. The gold was placed near one end of the capillary tube (Goodfellow, Cambridge, UK). The wire, including the solder joint, was then potted in an epoxy resin (Araldite™) and allowed to air dry for 12 h. Grinding the electrode on a polishing wheel exposed the cross-section of the gold wire. The gold surface was then polished with successively finer grades of diamond paste and/or alumina. Biasing the electrode for 1 min at +1 V and 1 min at −1 V against a silver–silver chloride electrode in a 0.1 M HCl solution further cleaned the electrode. Following rinsing with distilled water, the electrode was immersed in a fresh aqueous solution of 50 mM DTSSP for 1 min and immediately afterwards in 125 mL of 2 mM cytochrome c solution prepared in 100 mM phosphate buffer containing 20 mM sodium perchlorate and incubated at 4 °C for about 20 h. The electrodes were found to be stable for up to 6 h. Before use in determination of O2˙− at osteoclasts, the sensitivity of each electrode was tested by generating O2˙− with xanthine (Xa) and xanthine oxidase (XOD) in a 20 mM NaH2PO4 buffer solution (pH 7.4) containing NaCl (150 mM) and NaClO4 (100 mM) at room temperature. A stock solution of Xa (30 mM) in KOH (0.1 M) was prepared and added to the electrochemical cell containing the phosphate buffer in order to make a final concentration of 3 mM. XOD was added to give a final concentration of 0.8 μM and the current at a potential of +100 mV vs.Ag/AgCl, was measured. The selectivity of the electrode in each experiment reported was tested by injection of superoxide dismutase which was found to abolish the current response due to superoxide anion. We also checked for possible interferences from the various agents (PTH, pertussis toxin, cholera toxin and vitamin D3) by injecting these into a solution in the absence of osteoclasts; in all cases there was no response of the electrode except occasionally a sharp spike due to electrical interference produced by the action of injection. These spikes were much shorter in duration (∼1 s) and generally smaller than the processes of interest which are discussed later and were therefore easy to discriminate from the response of the electrode to superoxide. Current transients were recorded with the gold/cytochrome c collector electrode placed as close as possible to the bone slice. The stimulant (cholecalciferol, pertussis toxin or parathyroid hormone (PTH)) was injected by micropipette as close as possible to the electrode/bone gap whilst recording the current–time transient.
3. Simulation
3.1 Reaction–diffusion model
We model the situation where the analyte, A, is produced at the generator by chemical or biochemical processes and consumed at the collector by a faradaic reaction:| | | Generator: reactants → A | (1) |
| | | Collector: A ± ne− → products | (2) |
We treat a general case where the reactions that produce the analyte of interest are not known and the object of the experiment is to deduce the magnitude and the dynamics of the flux of analyte at the generator from the current response at a collector electrode. We do however assume that the reaction at the collector electrode does not cause any feedback effect on the generator, i.e., the flux of products from the collector does not influence the rate of the reaction at the generator. This differentiates the model considered here from simulations of EC2i and related mechanisms in scanning electrochemical microscopy (SECM) because in such mechanisms,25–27 the analyte detected at the collector is produced by a faradaic reaction which is the reverse of the collector reaction (eqn (2)).
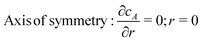
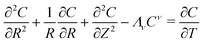
We model the generator (cell) as a disc of radius a and the collector as a large electrode at a distance d. The system is therefore assumed to have cylindrical symmetry. We also assume that the potential of the collector is sufficient to drive the kinetics of the reaction at the collector at the mass transport controlled rate; this assumption is not essential for our simulation, but is the typical case in most experiments where the electrode kinetics of the collector are not of particular interest and the experiment is designed to probe events at the generator. The basic equation describing the model is,
| |  | (3) |
where
cA =
cA(
r,
z,
t) is the time and space-dependent concentration of the analyte,
D is the diffusion coefficient of the analyte and
kν is a first (
ν = 1) or second (
ν = 2) order homogeneous rate constant describing the decay of the analyte by parasitic homogeneous reactions in the solution between the generator and collector. The boundary conditions are:
| | | Collector: cA = 0; z = d | (4) |
| | | Bulk solution: cA = 0; r = rmax | (5) |
| |  | (6) |
and either a space-independent, but time-dependent generator flux,
| | 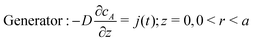 | (7) |
or a specified concentration boundary condition at the generator:
| | | Generator: cA = c(t); z = 0, 0 < r < a | (8) |
These equations are conveniently transformed into dimensionless form by the following substitutions:

;

;

;

and either

or

for first and second order decay kinetics respectively.
c* is typically the concentration at the generator surface in the case of specified concentration boundary conditions, or should be chosen according to the typical values of
cA in the case of a specified flux type of boundary condition. In dimensionless form the model equation is:
| |  | (9) |
with the specified flux at the disk:
| |  | (10) |
where

. The generator is a disk lying on the substrate at
Z = 0 and extending to
R = 1, the collector is at

and has a radius equal to 100
a, which is sufficiently large to be considered effectively infinite. The form of the other boundary conditions is clear from
eqn (4)–(8).
The reaction diffusion eqn (9) was solved by a finite difference technique on an axisymmetric grid in cylindrical coordinates, [R(i), Z(j)]. The grid lines expand exponentially away from the edge of the cell at R = 1 in both directions to R = 0 and R = 100 corresponding to the centre of the cell and the edge of the collector electrode. Experimentation with the density of the grid showed that sufficient accuracy was obtained on a 50 × 50 grid that expands exponentially in both directions around R = 1. 25 grid points were used for each of the regions R ≤ 1 and R > 1. An exponentially expanding grid was also used in the Z-direction between the generator and the detector electrode. The grid expansion was adjusted according to the value of the generator–collector separation,  using the equation Z(j) = dZ(eγ(j−1) − 1) with dZ = 0.01 and
 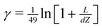 ; this generates a rapidly expanding grid for large L and an approximately linear grid suitable for small L where Z(2) − Z(1) ≃ 10−3.
For reasons of numerical stability, a fully implicit formulation of the difference equations was used because the equations are stiff for rapidly varying J(T). The spatial part of the equations was solved by successive over-relaxation at each time-step. The finite difference form of eqn (9) is either:
| | | ΔT[ΣnmαnmCT+ΔTnm] − (Λ1ΔT + 1)CT+ΔTij + CTij = 0 | (11) |
or for second-order kinetics:
| | | ΔT[ΣnmαnmCT+ΔTnm] − (Λ2CTijΔT + 1)CT+ΔTij + CTij = 0 | (12) |
where the term in square brackets is the finite difference approximation to the Laplacian expressed as a sum over nearest neighbours to (
i,
j) and the second term describes the homogeneous kinetics. For the second-order case we have employed the linearization:
| | | (CT+ΔTij)2 ≃ CT+ΔTijCTij | (13) |
where
CTij is the known value of concentration at grid point (
i,
j) at time
T and
CT+ΔTij is the value for which the equations are to be solved. This linearization is not essential, but it improves the speed and stability of the relaxation algorithm:
| |  | (14) |
where
C(n)ij is the current estimate of
CT+ΔTij after
n iterations. The algorithm is initialized by taking
C(0)ij =
CTij and one simply loops over the grid points (an iteration) updating
C(n+1)ij according to
eqn (14) until convergence.
ζ(1)ij is the residual on the right hand side of
eqn (11) or (12) with
CT+ΔTij =
C(n)ij. The denominator is the coefficient of
CT+ΔTij in the difference equations and
ω is the over-relaxation parameter. The optimum choice of
ω depends on the grid and was determined by applying the technique to the steady-state diffusion limited current at a microdisc. On theoretical grounds, 1 <
ω < 2 and the optimum value was 1.982 for the grid we employed. With this optimized value, convergence is more rapid (of order
n iterations) than for simple relaxation with
ω = 1 (order
n2 iterations). The successive over-relaxation algorithm is not particularly fast compared to other methods, however it has the advantage of being very simple to code because the RHS of
eqn (14) is expressed entirely in terms of known values. It also allows one to solve for the steady-state directly by solving the limit of
eqn (11) and (12) when Δ
T → ∞.
The experimental data were fitted by generating I−T curves at relatively low accuracy (large time-steps) to obtain estimates of the fitted parameters before generating accurate fitted curves with shorter time-steps. Extrapolation of the simulated data to ΔT → 0 showed that ΔT = 0.001 was sufficient to accurately model the transients over the experimentally relevant range of times.
3.2 Kinetics of superoxide anion generation and disproportionation
Given a typical number of osteoclasts per bone slice of order 102 and the observation by microscopy and histochemical staining of cell–cell separations >500 μm,8 it is necessary to include only one osteoclast in the simulation. The cell–electrode system (Fig. 1) was therefore treated as a combination of an inlaid microdisc generator (the osteoclast attached to the bone) underneath the centre of a collector electrode of large area (the cytochrome c-modified gold electrode). The latter approximation is reasonable because the typical cell diameter, 50 μm, was much less than the diameter of the gold electrode, 1 mm, and therefore the precise position of the cell with respect to the axis of the collector electrode is not important. For the typical cell–electrode separations of ∼200 μm, the detailed topography of the osteoclast is also not significant since it is of a smaller spatial scale and the measured currents are insensitive to features smaller than the distance traveled by the diffusing species. With these two assumptions, the diffusion problem reduces to that of our simulation model—an axisymmetric cylindrical diffusion field coupled with the homogeneous disproportionation of superoxide to hydrogen peroxide and oxygen.
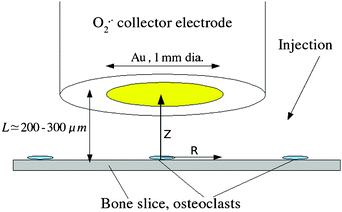 |
| | Fig. 1 Schematic of the experiment to detect superoxide at osteoclasts. The Au disc collector electrode is modified with cytochrome c and is mounted on a vertical positioning stage under stepper-motor control (not shown). L is the distance between the electrode and the bovine cortical bone slice on which the cells are cultured. The typical osteoclast diameter is 50 μm. The various stimulants were injected by micropipette close to the electrode/bone gap. | |
In order to compute the concentration distribution of the superoxide, however, an assumption about the distribution of the flux density across the cell must be made. In the absence of any direct experimental evidence to the contrary, it is simplest to assume that there are no special locations for generation of superoxide. The flux was therefore taken as uniform across the cell; it is possible that this is not correct, however, the superoxide electrodes available to us are too large to resolve any such effect and the conclusions of this paper are not strongly dependent on this assumption.
The simulation also requires information on the homogeneous kinetics of superoxide anion in aqueous medium. Superoxide anion is unstable in aqueous solution and disproportionates to O2 and H2O2. The reaction proceeds via a three step mechanism:28–30
| O2˙− + H+ ⇌ HO2˙ (pKa = 4.8 ± 0.128,29) |
O2˙− + HO2˙ → O2 + HO2− (kET = 9.7 × 1010 cm3 mol−1 s−1![[thin space (1/6-em)]](https://www.rsc.org/images/entities/char_2009.gif) 29) 29) |
As long as the protonation steps are fast, a reasonable assumption in aqueous media, then the rate limiting step is a bimolecular electron transfer between superoxide anion and the peroxyl radical, with second order rate constant,
kET. Applying the usual steady-state treatment, the rate law for decay of O
2˙
− is
(15):
| |  | (15) |
We therefore modeled this process as a simple second order rate law with a pseudo rate constant,

. The pseudo second order rate constant,
k2, depends on pH owing to the protonation pre-equilibrium.
k2 is the appropriate rate constant to substitute into the general formulation of the model in
eqn (3) in order to describe generation–collection experiments with superoxide anion in aqueous solution. We are also making the implicit assumption that the products of the disproportionation reaction or the collector electrode reaction (
eqn (16)) do not influence the rate of superoxide anion generation by changing the local oxygen concentration; this is entirely reasonable because the superoxide anion concentrations involved are very small and the measured current densities in our experiments are of order 10
−8 A cm
−2.
| | | Collector: O2˙− − e− → O2 | (16) |
Finally, the analysis of Tammeveski
et al.31 indicates that the electron transfer between
cytochrome c and the gold electrode becomes rate-limiting only at a high [O
2˙
−] which is not obtained in this study. This is the justification for specializing the model to the case of diffusion-controlled reaction at the collector electrode,
eqn (4).
The time dependence of the generation flux of superoxide at the osteoclast surface was modeled by either an exponential decline:
or a decay law of the form:
| |  | (18) |
J0 is the initial rate of superoxide generation due to stimulation of the cell. The extra constant term,
J∞, allows for the possibility of a sustained elevation in the rate of superoxide generation. The corresponding fluxes
j0,
j∞/mol cm
−2 s
−1 and
kd are the dimensioned quantities defined according to

and

. In some simulations we also allowed for the possibility of a finite rate at which the generation of superoxide switches on:
However, the value of
kon and the characteristic time 1/
kon for the superoxide generation process to start following stimulation was found to be much shorter than our experimental timescale in all cases.
4. Results and discussion
4.1 Simulation of superoxide generation by osteoclasts—characteristics of the model
First, we discuss the general features of the simulations and their relevance to the experimental conditions, before attempting to fit the simulations to our experimental data and extract the dynamics of the superoxide anion burst.
Fig. 2 shows typical simulated data for the time-dependence of the (normalized) current at the collector for an exponentially-declining generator flux, J(T) = J0e−kT. The collector current is zero at T = 0, but rises to a peak at times T ∝ L2 determined by diffusion across the generator/collector gap. Fitting the simulation data to experimental results in this region is the simplest way to estimate the cell/electrode distance. At longer times, the current decays exponentially at a rate limited by whichever is the slower process: diffusion across the gap or the decline of the generator flux. The slope of the semilogarithmic plots also depends on reaction order.
 |
| | Fig. 2 Dimensionless collector current transients as a function of the rate of decline of the generator flux: J(T) = J0e−kT. The colours indicate the values of k. The solid lines are the results of simulations in which the analyte decays by second-order homogeneous kinetics and dashed lines indicate first-order homogeneous kinetics. For all the curves, the generator–collector separation is L = 5, J0 = 1 and the kinetic parameter for the homogeneous reactions of either order was Λ1,2 = 1. The dimensionless collector current is  and the equivalent dimensionless generator current is πJ. and the equivalent dimensionless generator current is πJ. | |
If k = 0 the collector current rises monotonically and reaches a steady-state determined by the rate of the homogeneous kinetic reactions of the analyte in the generator–collector gap. It is clear by comparing the simulations of first and second-order homogeneous decay of the analyte that for experimentally relevant values of parameters such as cell–electrode gap, the collector current is much larger in the case of second-order kinetics. This is simply because, as in many experiments in bioelectrochemistry involving low analyte levels, the half-life of second-order homogeneous reactions is long.
Fig. 3 shows the collection efficiency  at steady-state for the case where k = 0. We find that in general N varies with Λ2 according to a power law at large values of Λ2, but N depends approximately exponentially on Λ1: in Fig. 3N ≈ Λ−0.882. This weak dependence of the collection efficiency on the homogeneous kinetics in the second-order case is essentially the reason that superoxide anion can be detected using electrochemical methods. Clearly, if there are significant concentrations of species such as NO that react rapidly with superoxide anion to form peroxynitrite, the first-order case applies and the collection efficiency is much smaller and typically one cannot easily detect superoxide anion experimentally. NO is a major interfering species in this kind of experiment.2
 |
| | Fig. 3 Simulated steady-state collection efficiency (N) against homogeneous kinetic parameter (Λ) for a constant generator flux, J = 1 and a generator–collector separation of L = 5. The black circles show the results for second-order homogeneous kinetics and the red squares are the results for first-order decay of the analyte. The solid black line is a least squares fit to the data showing that for Λ > 10, N ≈ Λ−0.882. | |
The other important effect of second-order kinetics is the dependence of the collector current on the magnitude of the generator flux; this is illustrated in Fig. 4. At high values of J0, the relationship between J(T) and Icollector(T) becomes sub-linear and then the values of J0 obtained by fitting experimental data are subject to greater uncertainty because large variations in J0 produce relatively small variations in the fit to the measured currents. This applies to our measured transients for the superoxide anion burst in response to parathyroid hormone discussed below.
 |
| | Fig. 4 Effect of the magnitude of the flux, J0 for second-order homogeneous decay of the analyte in the generator–collector gap with kinetic parameter Λ2 = 10. The simulations are at a constant generator–collector separation, L = 2 and the flux at the generator is J(T) = J0e−kT with k = 1. The dimensionless collector current is  and the equivalent dimensionless generator current is πJ. and the equivalent dimensionless generator current is πJ. | |
We have also simulated the switching-on of the superoxide anion burst by including the factor shown in eqn (19). However, as shown in Fig. 5, if kon ≥ k the effect of this is to reduce the peak current and it is therefore not possible to distinguish this effect from changes in the homogeneous kinetics. In the case of a reaction where the switch-on rate is much slower than the diffusion transit time,  , it would become possible to observe the dynamics of the switching-on process, but since we do not observe this case in our experimental data, we ignore this possibility in the rest of our simulations.
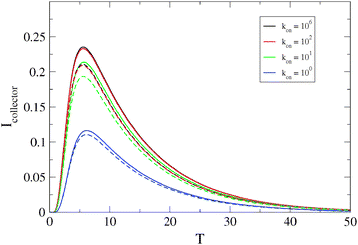 |
| | Fig. 5 Dimensionless collector current transients as a function of the rate constant kon describing the turn-on rate of the generator flux, eqn (19). The generator flux declines according to an exponential law J(T) = J0e−kT with k = 1 and the decay of the analyte in the generator–collector gap follows second-order homogeneous kinetics. The other parameters are: J0 = 1, L = 5, and Λ2 = 0 (solid lines) or Λ2 = 1.0 (dashed lines). The dimensionless collector current is  and the equivalent dimensionless generator current is πJ. and the equivalent dimensionless generator current is πJ. | |
Fig. 6 shows the effect of the dynamics of the superoxide anion burst and the sustained production of superoxide on the collector current. For the same value of k, the model of an exponential decline in the superoxide anion burst results in a much more rapid decay of the collector current and a substantially different I(T) curve which enables one to distinguish these possibilities in the experimental data. Fig. 6 also shows it is possible to detect very small sustained superoxide fluxes in the long-time data T > L2 or  , when the homogeneous kinetics are second-order.
 |
| | Fig. 6 Dimensionless collector current transients as a function of the model describing the decline of the generator flux: J(T) = J0e−kT + J∞ or  and k = 1. In all cases, the analyte decays by second-order homogeneous kinetics in the generator–collector gap. Other parameters are: J0 = 1, L = 2 and Λ2 = 1. The dimensionless collector current is and k = 1. In all cases, the analyte decays by second-order homogeneous kinetics in the generator–collector gap. Other parameters are: J0 = 1, L = 2 and Λ2 = 1. The dimensionless collector current is  and the equivalent dimensionless generator current is πJ. and the equivalent dimensionless generator current is πJ. | |
Finally, the parameter of most interest to us is the rate constant  describing the decline of the superoxide anion burst, because this provides information on the mechanism of the process. Fig. 7 presents a set of simulations at L = 2 that show the collector current is sensitive to this rate constant as long as it is not too large. The long-time portion of the simulation has a slope equal to −k for k = 0.1, 0.3, but the curves for k > 1 run parallel. From similar simulations at other values of L, we observe that the collector current is sensitive to this parameter as long as
  . In fact, for
  the collector current behaviour can be understood as the result of a slowly varying quasi steady-state and therefore has the same time dependence, I(T) ≈ e−kT. However in the intermediate region
  , the simulation must be fitted to the data to extract the value of k. For
  the only effect of k is to reduce the peak collector current (fewer superoxide anions are produced
  ); the shape of the collector transient is insensitive to kd because the superoxide anion burst is finished before the first molecules diffuse to the collector. In conclusion, the collector current response can be analyzed to yield the dynamics of the superoxide anion burst as long as the cell/electrode gap is sufficiently small or the burst is sufficiently long-lived. The uncertainty in the fitted values of other parameters relating to the cellular processes, J0 and J∞, is larger because the simulation model couples these to the cell radius, a, which is not observable by optical microscopy during the experiment (neither the bone slice nor the electrode are transparent). It is therefore possible to interpret the values we extract for k and the relative sizes, but not the absolute values, of J0 and J∞.
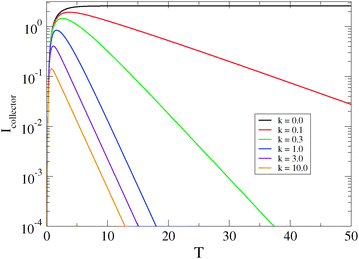 |
| | Fig. 7 Dimensionless collector current transients as a function of the rate constant describing the rate of decline of the generator flux: J(T) = J0e−kT with second-order homogeneous decomposition of the analyte in the generator–collector gap. Other parameters are: J0 = 1, L = 2 and Λ2 = 1. The dimensionless collector current is  and the equivalent dimensionless generator current is πJ. and the equivalent dimensionless generator current is πJ. | |
4.2 Simulation of superoxide generation by osteoclasts—comparison with experiment
Fig. 8 shows a typical transient superoxide response to injection of parathyroid hormone (PTH) at the osteoclast/electrode gap. The parameters related to the homogeneous kinetics and transport of superoxide were set to those derived from the literature data: D = 1.5 × 10⁻⁵ cm2 s−1 and  .28,29 The cell–electrode gap was hard to determine accurately by experimental means and therefore was allowed to float in the fitting procedure and the fitted value was obtained as 210 μm. The cell radius was taken as 25 μm (a typical value from our observations of isolated osteoclasts) in all simulations, because it is hard to determine experimentally for the particular cell underneath the collector electrode. The fitted values of j0, j∞ and kd which describe the generation of superoxide by the osteoclast in response to stimuli are collected in Table 1. It is worth noting that the approximations forced on us by experimental constraints affect the accuracy of our estimates of the fluxes j0 and j∞, but do not greatly affect our estimate of kd. We therefore claim only an order of magnitude estimate of the fluxes, but the uncertainty on the fitted value of kd is given in the table as mean ± s.e.m (n = 5).
 |
| | Fig. 8 A typical i–t transient showing the superoxide collection current in response to injection of 100 nM parathyroid hormone (PTH) near the osteoclast/electrode gap. The symbols represent the experimental data and the lines represent the results of the simulation: (1) Simulation based on exponential decay of the generator flux (j(t) = j0e−kdt + j∞) with a finite value of the sustained flux, j∞; (2) exponential decay of the generator flux, but no sustained flux, j∞ = 0 and (3) a simulation using the generator decay law  . The parameters used in the simulations were: a = 25 μm, L = 210 μm, j0 = 1.0 × 10⁻⁹ mol cm−2 s−1, j∞ = 1.0 × 10⁻¹² mol cm−2 s−1 and kd = 0.1 s−1. . The parameters used in the simulations were: a = 25 μm, L = 210 μm, j0 = 1.0 × 10⁻⁹ mol cm−2 s−1, j∞ = 1.0 × 10⁻¹² mol cm−2 s−1 and kd = 0.1 s−1. | |
Table 1 Values of the parameters from the model of eqn (17) obtained by fitting to the data for stimulation of osteoclasts by PTH, pertussis toxin and vitamin D3. Transient (j0) and sustained (j∞) fluxes of superoxide can only be obtained as rough estimates owing to the assumptions made in the simulation. The rate constants for the decline of the superoxide anion burst in osteoclasts (kd) are obtained more precisely: the uncertainties in kd are given as mean ±s.e.m. based on n = 5 measurements
| Agent |
j
0/pmol cm−2 s−1 |
j
∞/pmol cm−2 s−1 |
j
∞/j0 |
k
d
/s−1 |
| PTH |
103 |
1 |
10−3 |
1.8 ± 0.8 × 10⁻¹ |
| Pertussis toxin |
20 |
0.4 |
2 × 10⁻² |
1.5 ± 0.5 × 10⁻² |
|
Vitamin D3 |
5 |
0.3 |
6 × 10⁻² |
1.1 ± 0.5 × 10⁻² |
Injection of 100 nM parathyroid hormone (PTH) into the solution near the cell–electrode system produces an immediate stimulation of superoxide generation, the superoxide anion burst. However, the current response of the electrode shows a decay over a period of ca. 40 s. For the data shown in Fig. 8, the short time data (2–3 s) are not well fitted by the simulation because the solution is disturbed by transient convection induced in the cell/electrode gap upon injection of the PTH. However, the time between injection of PTH and the peak of the current transient is mainly determined by diffusion across the cell–electrode gap and not by the rate at which the cell responds to PTH. The data in this region therefore do not provide information about the mechanism of the superoxide anion burst, except to provide an upper bound of about 1 s (set by the diffusion transit time  ) on the time before the cell produces O2˙− in response to stimulation by PTH. The timescale of a membrane receptor-coupled stimulation is almost certainly faster than this, however to probe such events the timescale of the experiment must be reduced by decreasing the electrode–cell separation. This was not possible with our current 1 mm diameter superoxide electrodes due to the difficulty in aligning the electrodes exactly parallel to the bone and the method of injection of stimulant, therefore we have concentrated on analyzing the medium/long-time behaviour of the i–t transient.
The dynamics of the superoxide anion burst upon stimulation by PTH (Fig. 8) can be satisfactorily modeled by a simple exponential decline j0e−kdt + j∞ with an observed rate constant kd = 0.18 ± 0.08 s−1; this rate constant is equivalent to mean lifetime of 5.6 s (Table 1). The observation of first-order behaviour is equivalent to the assumption that the lifetime of activated receptors is independent of their concentration. The long-time portion of the data suggests that the stimulation by PTH also has a time-independent effect, i.e., it leads to a persistent increase in superoxide production, although the value of the steady-state flux, j∞, extracted from the data is 1000 times smaller than the transient contribution, j0. In our experiments we are working with very small fluxes and therefore natural convection arising from density gradients is unlikely to be significant. However, we are only able to observe the superoxide production for times of the order of a few minutes, after which it is not possible for us to distinguish with confidence the small, sustained increase in superoxide flux from possible baseline drift in the electrode signal. Nevertheless, the values of j0 in Table 1 are of the same order as those estimated for neutrophils by other workers.24
The shape of the current transient at the superoxide electrode which is produced by pertussis toxin acting on the osteoclast is superficially similar to that produced by PTH, however, the kinetics of the decline in the superoxide anion burst are slower (Fig. 9). Despite this, the fit of the model to the data is reasonable and shows clear evidence for a sustained flux of superoxide after the initial transient has decayed at times up to 500 s. Owing to slow drifts in the current baseline it was not possible to determine with confidence whether this flux of superoxide was sustained for even longer periods of time. The first-order decay rate constant extracted from Fig. 9 was kd = 1.5 ± 0.5 × 10⁻² s−1 and is significantly smaller than that after stimulation by PTH, kd = 0.18 ± 0.08 s−1. This corresponds to a mean lifetime which is longer by an order of magnitude (Table 1). It is not surprising that a kinetically distinct response is observed compared to PTH for which the osteoclast expresses a membrane receptor.15,16 The magnitude of the stimulation by pertussis toxin was found to be smaller than that produced by PTH which may be a result of the relative number of NADPH oxidase molecules which are activated, however, the accurate quantification of the initial flux, j0, is difficult because it is very sensitive to the rate of disproportionation of superoxide during the transit between the cell and the detector electrode (Fig. 3).
 |
| | Fig. 9 A typical i–t transient showing the superoxide collection current in response to injection of pertussis toxin near the osteoclast/electrode gap. The symbols represent the experimental data and the line represents the simulation. The simulated decay law for the generator flux was j(t) = j0e−kdt + j∞. The parameters used in the simulation were: a = 25 μm, L = 250 μm, j0 = 2.2 × 10⁻¹¹ mol cm−2 s−1, j∞ = 4.0 × 10⁻¹³ mol cm−2 s−1 and kd = 0.015 s−1. | |
The usual mode of action of vitamin D3 is via a nuclear receptor, although non-genomic effects of vitamin D3 are known.32–35 It can be clearly seen in Fig. 10 that stimulation of superoxide generation by the osteoclast occurs very quickly after exposure. Although we cannot extract an accurate value for the time lag between exposure to vitamin D3 and stimulation because of diffusion limitations, we are able to place an upper bound of ca. 5 s before production of superoxide begins. This is too short a timescale for the expression of genes and, as we have previously proposed,22 suggests that a membrane receptor is involved.17 The rate constant for the decline in the superoxide anion burst following stimulation by vitamin D3 was kd = 1.1 ± 0.5 × 10⁻² s−1 similar to that related to the action of pertussis toxin.
 |
| | Fig. 10 A typical i–t transient showing the superoxide collector current in response to injection of vitamin D3 near the osteoclast/electrode gap. The symbols represent the experimental data and the line represents the simulation. The simulated decay law for the generator flux was j(t) = j0e−kdt + j∞. The parameters used in the simulation were: a = 25 μm, L = 275 μm, j0 = 5.5 × 10⁻¹² mol cm−2 s−1, j∞ = 3.0 × 10⁻¹³ mol cm−2 s−1 and kd = 0.011 s−1. | |
The kinetic data (Table 1) make a clear distinction between PTH on the one hand where the decline of the stimulation is characterized by a mean lifetime of 5.6 s and pertussis toxin and vitamin D3 on the other where the mean lifetimes are longer than one minute. This suggests that the mechanism of action of PTH is distinct from that of vitamin D3 which in turn occurs on a similar time scale to that of pertussis toxin. It is known that PTH produces an elevation in intracellular Ca2+ whereas pertussis does not.8 Further, confocal fluorescence microscopy shows that the intracellular Ca2+ transient in response to PTH has a similar duration and time-dependence to the observed superoxide transient.8
5. Conclusions
A quantitative simulation of the electrochemical detection of superoxide anion generated by cells has been made and used to elucidate the dynamics of the superoxide anion burst of osteoclasts observed on stimulation with parathyroid hormone, pertussis toxin and vitamin D3. Cytochrome c-modified gold electrodes were employed to detect the superoxide anion by osteoclasts actively resorbing bovine cortical bone slices. Finite difference simulation of the transport and disproportionation of the superoxide anion in the cell–electrode gap showed that it is possible to extract aspects of the time dependence of the flux of superoxide anion generation by the cell from the experimental data. These simulations showed that the time lag between injection of a stimulant and the observation of the peak current response at the electrode was sensitive to the electrode–cell distance rather than the kinetics of the cellular or solution phase processes involving superoxide. However, the longer-time data reflect the rate of decline of the superoxide anion burst following stimulation of superoxide generation. The shape of the current transient fits a simple first-order kinetic model for the decline of the superoxide anion burst. The mean lifetimes for the burst are a few seconds for PTH and longer than a minute for pertussis toxin and vitamin D3. All stimulants produce a sustained elevation in the rate of production of superoxide of the same order of magnitude.
References
- C. L. Fattman, L. M. Schaefer and T. D. Oury, Free Radical Biol. Med., 2003, 35, 236–256 CrossRef CAS.
- F. Bedioui, D. Quinton, S. Griveau and T. Nyokong, Phys. Chem. Chem. Phys., 2010, 12, 9976–9988 RSC.
- L. T. Cheah, Y. H. Dou, A. M. L. Seymour, C. E. Dyer, S. J. Haswell, J. D. Wadhawan and J. Greenman, Lab Chip, 2010, 10, 2720–2726 RSC.
- C. J. McNeil, K. A. Smith, P. Bellavite and J. V. Bannister, Free Radical Res. Commun., 1989, 7, 89–96 CrossRef CAS.
- J. R. Henderson, H. Swalwell, S. Boulton, P. Manning, C. J. McNeil and M. A. Birch-Machin, Free Radical Res., 2009, 43, 796–802 CrossRef CAS.
- H. K. Datta, P. Manning, H. Rathod and C. J. McNeil, Exp. Physiol., 1995, 80, 713–719 Search PubMed.
- H. K. Datta, H. Rathod, P. Manning, Y. Turnbull and C. J. McNeil, J. Endocrinol., 1996, 149, 269–275 Search PubMed.
- C. E. M. Berger, H. Rathod, J. L. Gillespie, B. R. Horrocks and H. K. Datta, J. Bone Miner. Res., 2001, 16, 2092–2102 CAS.
- I. R. Garret, B. F. Boyce, R. O. Oretto, L. Bonewald, J. Poser and G. R. Mundy, J. Clin. Invest., 1990, 85, 632–639 CrossRef.
- M. J. Steinbeck, W. H. Appel, A. J. Verhoeven and M. J. Karnovsky, J. Cell Biol., 1994, 126, 765–772 CrossRef CAS.
- S. Yang, M. Madyastha, S. Bingel, W. Ries and L. Key, J. Biol. Chem., 2001, 276, 5452–5458 CrossRef CAS.
-
C. V. Albanese, D. Salvemini, H. K. Datta, H. Rathod and I. MacIntyre, ‘Image processing as a probe for the action of NO and oxygen-derived free radicals in isolated cells.’ Biology of Nitric Oxide, Second International Meeting, 1991, London 81a (Abstract).
- I. MacIntyre, M. Zaidi, A. S. T. Alam, H. K. Datta, B. S. Moonga, P. Lidbury, M. Hecker and J. R. Vane, Proc. Natl. Acad. Sci. U. S. A., 1991, 88, 2936–2940 CAS.
- M. Zaidi, H. K. Datta, B. S. Moonga and I. Macintyre, J. Endocrinol., 1990, 126, 473–481 Search PubMed.
- N. Agarwala and C. V. Gay, J. Bone Miner. Res., 1992, 7, 531–539 CAS.
- H. S. Tong, H. Lin, H. Wang, D. Sakai and C. Minkin, J. Bone Miner. Res., 1995, 10, S278.
- A. P. Mee, J. A. Hoyland, I. P. Braidman, A. J. Freemont, M. Davies and E. B. Mawer, Bone, 1996, 18, 295–299 CrossRef CAS.
- T. Kameda, H. Mano, T. Yuasa, Y. Mori, K. Miyazawa, M. Shiokawa, Y. Nakamaru, E. Hiroi, K. Hiura, A. Kameda, N. N. Yang, Y. Hakeda and M. Kumegawa, J. Exp. Med., 1997, 186, 489–495 CrossRef CAS.
- L. G. May and C. V. Gay, J. Cell. Biochem., 1997, 64, 161–170 CrossRef CAS.
- C. E. M. Berger, B. R. Horrocks and H. K. Datta, J. Endocrinol., 1998, 158, 311–318 Search PubMed.
- D. T. Barand, A. M. Sorensen, T. Honeyman and M. F. Holick, FEBS Lett., 1989, 259, 205–208 CrossRef.
- C. E. M. Berger, B. R. Horrocks and H. K. Datta, Mol. Cell. Endocrinol., 1999, 149, 53–59 CrossRef CAS.
- A. Boyde and S. Jones, Calcif. Tissue Int., 1991, 49, 65–70 CrossRef CAS.
- S. Shleev, J. Wettero, K. E. Magnusson and T. Ruzgas, Cell Biol. Int., 2008, 32, 1486–1496 CrossRef CAS.
- F. Zhou, P. R. Unwin and A. J. Bard, J. Phys. Chem., 1992, 96, 4917–4924 CrossRef CAS.
- J. L. Fernandez and A. J. Bard, Anal. Chem., 2004, 76, 2281–2289 CrossRef CAS.
- S. Bollo, P. Jara-Ulloa, S. Finger, L. J. Nunez-Vergara and J. A. Squella, J. Electroanal. Chem., 2005, 577, 235–242 CrossRef CAS.
-
J. W. T. Spinks and R. J. Woods, An Introduction to Radiation Chemistry, Wiley, New York, 3rd edn, 1990, ISBN 0-471-61403-3, pp. 277–282, table 7.7 and appendix A3.7 Search PubMed.
- B. H. J. Bielski, D. E. Cabelli, R. L. Arudi and A. B. Ross, J. Phys. Chem. Ref. Data, 1985, 14, 1041–1100 CAS.
- G. Czapski, Annu. Rev. Phys. Chem., 1971, 22, 171 CrossRef CAS.
- K. Tammeveski, T. T. Tenno, A. A. Mashirin, E. W. Hillhouse, P. Manning and C. J. McNeil, Free Radical Biol. Med., 1988, 25, 973–978.
-
A. W. Norman, in Rapid biological responses mediated by 1,25-dihydroxyvitamin D3: a case study of transcaltachia, ed. D. Feldman, F. H. Glorieux, J. W. Pike and D. Vitamin, Academic Press, San Diego, CA, U.S.A., 1997, pp. 233–256 Search PubMed.
- J. Selles and R. L. Boland, Mol. Cell Endocrinol., 1991, 82, 229–235 CrossRef CAS.
- M. Y. Farhat, S. Abi-Younes, B. Dingaan, R. Vargas and P. W. Ramwell, J. Pharmacol. Exp. Ther., 1996, 276, 652–657 CAS.
- A. R. de Boland and A. W. Norman, Endocrinology, 1990, 127, 39–45 CrossRef CAS.
|
| This journal is © the Owner Societies 2011 |
Click here to see how this site uses Cookies. View our privacy policy here.