The nitrogen–boron paramagnetic center in visible light sensitized N–B co-doped TiO2. Experimental and theoretical characterization
A. M.
Czoska
a,
S.
Livraghi
a,
M. C.
Paganini
a,
E.
Giamello
a,
C.
Di Valentin
*b and
G.
Pacchioni
b
aDipartimento di Chimica IFM, Università di Torino and NIS, Nanostructured Interfaces and Surfaces Centre of Excellence, Via P. Giuria 7, I-10125 Torino, Italy
bDipartimento di Scienza dei Materiali, Università di Milano-Bicocca, Via R. Cozzi, 53, 20125, Milano, Italy. E-mail: cristiana.divalentin@mater.unimib.it
First published on 1st November 2010
Abstract
Nitrogen boron co-doped TiO2 prepared via sol–gel synthesis and active under visible light, contains two types of paramagnetic extrinsic defects, both exhibiting a well resolved EPR spectrum. The first center is the well characterized [NiO]˙ species (i = interstitial) also present in N-doped TiO2, while the second one involves both N and B. This latter center (labeled [NOB]˙) exhibits well resolved EPR spectra obtained using either 14N or 15N which show a high spin density in a N 2p orbital. The structure of the [NOB]˙ species is different from that previously proposed in the literature and is actually based on the presence of interstitial N and B atoms both bound to the same lattice oxygen ion. The interstitial B is also linked to two other lattice oxygen ions reproducing the trigonal planar structure typical of boron compounds. The energy level of the [NOB]˙ center lies near the edge of the valence band of TiO2 and, as such, does not contribute to the visible light absorption. However, [NOB]˙ can easily trap one electron generating the [NOB]− diamagnetic center which introduces a gap state at about 0.4 eV above the top of the valence band. This latter species can contribute to the visible light activity.
1. Introduction
Doping of titanium dioxide by p-block elements has characterized the research activity in photocatalysis and related areas in the new century. The aim of this activity is to reduce the absorption threshold of the oxide, whose band gap is around 3.2 eV, and make it photosensitive to visible light.1–4 The most investigated system in this field is nitrogen doped titanium dioxide, N/TiO2, which exhibits optical properties different from those of the bare oxide owing to the onset of absorption in the visible region of the spectrum due to the presence of mid-gap states.5–7 This is accompanied by evidence of photocatalytic activity in various reactions for pollutants abatement performed under visible light irradiation.8–20 Homogeneous doping of bulk titanium dioxide forms extrinsic defects in the structure which are responsible for the mid-gap states. The characterization of these defects is important to understand the photochemical properties of the system.Another element which is finding application as a dopant of titanium dioxide is boron, even though the experimental results concerning B-doped TiO221–23 are often controversial due to a variety of synthetic methods explored leading to a set of different materials and to the possible formation of micro aggregates (B2O3) in the solid.22 In parallel, investigations on systems based on co-doping with a second non metallic element have been performed. In particular, interesting results were obtained by using fluorine and nitrogen as co-dopants of the oxide (N–F/TiO2) showing a synergistic effect between the two elements, one promoting the insertion of the other into the solid.24–26
Nitrogen–boron co-doped TiO2 has been investigated in various studies22,27–31 leading to some conflicting evidence (XPS of boron centers, photocatalytic activity in visible light) most likely due to the different chemical routes (wet chemistry from TiCl4 and BH3,22 surface nitridation28 and sol–gel)29 followed to prepare the materials. The paper by Gopal et al.29 has been the first (and, to the best of our knowledge, remains the only one) to report Electron Paramagnetic Resonance (EPR) spectra of N–B/TiO2 showing the existence of two distinct paramagnetic species in the material, the first exclusively containing N atoms, the second containing both N and B. While the former species is the same already reported for N–TiO2,5,6,32 the second one was never reported before. In ref. 29 both species are reported to be sensitive to irradiation with blue light showing that they are involved in the sensitization of the semiconducting oxide to visible frequencies. The nature of the novel N–B paramagnetic center was preliminarily discussed on the basis of some speculative argument leading to the conclusion that N and B occupy two neighboring oxygen lattice positions, the boron being in −1 oxidation state and nitrogen either in −2 or −3 oxidation states for the paramagnetic and the diamagnetic centers, respectively. The [N3−B−] diamagnetic center is neutral (substituting two O2− ions) and for this reason should be more stable than the [N2−B−] paramagnetic one. In fact, [N3−B−] is reported to irreversibly form at the expense of [N2−B−] under visible light irradiation. This interesting picture however is tentative and needs to be verified with more compelling evidence.
In this paper we present results on a N–B/TiO2 system prepared in our laboratory via sol–gel synthesis and containing the same paramagnetic centers reported in ref. 29. Beside the classic characterization by X-ray diffraction, UV-Visible spectroscopy and XPS, a careful analysis of the EPR spectra based on isotopic substitution, the computer simulation of the spectra and variable temperature measurements allow us to gain further insight into the new, N–B based, defect center. EPR is a reference technique to characterize defects in the solid state in particular when these generate electronic states in the band gap. In this case, it is very likely to find paramagnetic species alone or in equilibrium with diamagnetic counterparts. The characterization viaEPR of a defect paves the avenue, more than in the case of other widely employed experimental techniques, for a deep understanding of its nature and electronic structure.
Further insight into the interpretation of the experimental data is achieved by direct comparison of the EPR parameters with those computed with state of the art density functional calculations based on hybrid functionals (B3LYP) on some selected model systems. The present approach provides an accurate description of both the semiconductor band gap and the correct degree of defect localization, resulting in reliable hyperfine couplings constants that can be used for the assignment of measured EPR spectra to specific structural models of the defects. As will be shown below, the assignment is indeed different from the tentative suggestions previously reported in the literature.29
2. Experimental and computational methods
2.1 Sample preparation
All reactants employed in this work were purchased from Aldrich and used without any further purification treatment. For TiO2 preparation, titanium(IV) isopropoxide (TTIP) was added to a cold solution of CH3OH in H2O (VTTIP/VROH = 1; VTTIP/VH2O = 1) upon constant stirring at 268 K for 3 h. The solution was left ageing for 20 h at room temperature to complete the hydrolysis reaction. The formed gel was dried at 313 K and calcined in air at 773 K for 1 h with a heating rate of 10 K min−1.The same procedure was adopted to prepare N–B/TiO2, with the only difference consisting of the addition of a nitrogen and boron source (NH3 and H3BO3) in the starting solution. The synthesis was performed for three different molar percentages of boron (1%, 6% and 15%), while the molar concentration of nitrogen remained constant (6%). The following abbreviation will be adopted to label the samples: TiO2 for the bare titanium dioxide, NB6-1, NB6-6 and NB6-15 for the co-doped samples. A last sample with the same concentration of dopants but a different nitrogen isotope (15N, I = 1/2) has been prepared using the same procedure described above with 100% 15NH3. The sample will be labeled with the 15NB6-6 abbreviation. The real concentration of dopant elements in the final samples, however, are lower than the theoretical ones due to material loss during the synthesis.33
2.2 Characterization details
X-Ray diffraction (XRD) was performed with a Philips 1830 diffractometer using a Kα(Co) source and X'Peret High-Score software for data handling. Surface area was measured by a fully automated surface area analyzer (ASAP 2020 Accelerated Surface Area and Porosimetry, Micromeritics—USA) and diffuse reflectance UV-Visible spectra (DR UV-Vis) were recorded by a Varian Cary 5 spectrometer using a Cary Win-UV/scan software.X-Band CW-EPR spectra were recorded between 350 K and 77 K on a Bruker (EMX) spectrometer equipped with a cylindrical cavity operating a 100 kHz field modulation and with a Bruker temperature controller unit. A variable temperature unit operating between 100 K and 350 K was employed to record spectra at different temperature intervals. EPR computer simulations were obtained using EPR SIM32S program developed by Prof. Sojka, (Jagellonian University, Cracow Poland)34 while integration of the spectra was performed with the program Win-EPR.
2.3 Computational details
Calculations were performed with the hybrid B3LYP35,36 functional and including spin polarization. The percentage of exact Hartree–Fock (HF) exchange in the B3LYP functional is 20%. The Kohn–Sham orbitals are expanded in Gaussian Type Orbitals (GTO), as implemented in the CRYSTAL06 code37 (the all-electron basis-sets are: Ti 86411(d41),38 O 8411(d1),39 N 7311(d1)40 and B 621(d1)41). We considered a nearly cubic 2√2 × 2√2 × 1 supercell containing 32 Ti and 64 O atoms to model bulk anatase. The optimized bulk lattice parameters were taken from previous B3LYP (a = 3.776 Å, and c = 9.866 Å)42 calculations.Three possible combinations of co-doping with the two non-metal elements have been considered leading to three different models of the [NOB]˙ center (s = substitutional, i = interstitial, see also section 3.2 and figures therein):
(1) [Ns–Bi-3c]˙ co-doping was modeled by replacing one oxygen atom in the 96-atom supercell with N (substitutional, [Ns]˙) and by introducing an interstitial B in a 3-fold coordinated position (Bi-3c) with the B atom bound to two lattice oxygens and the Ns atom. The resulting stoichiometry is TiO2−xNxBx with x = 0.031.
(2) [Ns–Bi-4c]˙ co-doping was modeled by replacing one oxygen atom in the 96-atom supercell with N and by introducing an interstitial B in a 4-fold coordinated position (B is bound to three lattice oxygens and the [Ns]˙ atom). The resulting stoichiometry in this case is TiO2−xNxBx with x = 0.031.
(3) [Ni–Bi-3c]˙ co-doping was modeled by adding a nitrogen atom in the 96-atom supercell forming the well characterized [NiO]˙ species5 and by introducing an interstitial B in a 3-fold coordinated position (B is bound to two lattice oxygens and to the same O atom of the [NiO]˙ group). The resulting stoichiometry in this case is TiO2NxBx with x = 0.031.
It must be noted that in all three models the B species is interstitial. This choice is derived from our previous study where it was found that the most stable configuration for B-doped TiO2 has B in an interstitial, not substitutional, position.43 In the interstitial configuration the B atom is fully oxidized by the lattice and donates its three valence electrons to the Ti conduction band or to other oxidizing impurities present in the system (formation of B3+).43 The donation of three electrons from each B atom to three Ti atoms results in the formation of Ti3+ ions whose electronic 3d states are close to the conduction band.43 The calculation of a supercell where, beside the paramagnetic center associated with the presence of the N-species, also Ti3+ paramagnetic states are present and would result in a high spin multiplicity or in the quenching of the paramagnetic N-species with formation of N− and Ti4+, as previously shown both experimentally and theoretically.5,6 Therefore, in order to avoid the complexity introduced by the simultaneous presence of three Ti3+(3d1) states, to model the paramagnetic N–B co-doped system we have chosen to remove the extra electrons donated to the system by the interstitial B atom. Thus, all the calculations have been performed with a charged (+3) supercell model, where the extra charge is compensated by a uniform background of charge. Only in the case of the [Ni–Bi-3c]˙ model, a (+2) charged supercell calculation was also performed to verify the effect of an additional electron (coming from the B atom) to the defect. The electronic structure and details of wavefunctions for charged supercell models were found to be consistent with non-charged models in other similar situations.44 Based on careful checking, we are confident that the electronic properties provided by these charged supercells are well representative of the real electronic structure of the defect.
Full geometry optimization was performed until the largest component of the ionic forces was less than 5 × 10⁻⁴ a.u. The reciprocal space is sampled according to a regular sublattice with a shrinking factor, IS, equal to two, corresponding to 8 k-points in the sampling of the irreducible Brillouin zone.
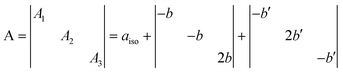
For the paramagnetic defects, the hyperfine interactions of the electron spin with the nuclear spin of the 11B and 14N nuclides have been determined. The hyperfine spin Hamiltonian, Hhfc = S·A·I, is given in terms of the hyperfine matrix A which describes the coupling of the electron with the nuclear spin.45 Beside the isotropic component, also the anisotropic traceless tensor B resulting from the dipolar interaction has been calculated.
3. Results and discussion
3.1 Experimental characterization
After calcination in air, N–B/TiO2 solids prepared via the low temperature sol–gel synthesis are yellow and all show the XRD typical anatase pattern (Fig. 1). The doped solids have a specific surface area higher than that of bare TiO2 prepared in the same way (84 m2 g−1). The surface areas vary from 106 m2 g−1 (NB6-1) to 116 m2 g−1 (NB6-6) and 136 m2 g−1 (NB6-15) indicating a specific role of the dopant (and of boron in particular) in causing the increase of this quantity. The optical absorption of the samples monitored, via DR-UV-Vis spectroscopy, indicates that the typical edge corresponding to the band-gap transition of anatase is overlapped, in the case of doped samples, by a band in the visible range with a maximum in the range of 400–450 nm, responsible for the observed color (Fig. 2).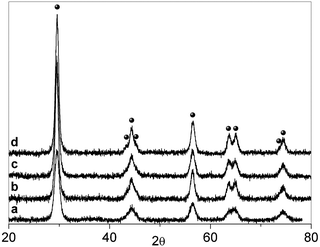 | ||
| Fig. 1 XRD pattern of the three N–B/TiO2 samples compared with that of bare TiO2 prepared with the same method. (a) TiO2. (b) NB6-1. (c) NB6-6. (d) NB6-15. (The symbol ● indicates the typical peaks of anatase). | ||
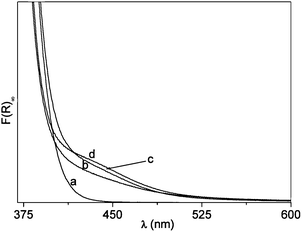 | ||
| Fig. 2 DR-UV-Vis. Spectra of the three N–B/TiO2 samples compared with that of bare TiO2. (a) TiO2. (b) NB6-1. (c) NB6-6. (d) NB6-15. | ||
Remarkable information for the material characterization comes from EPR spectroscopy. Gopal et al.29 recently reported a complex EPR spectrum typical of N–B/TiO2 composed of two distinct signals. The former is due to a nitrogen bulk species in TiO2, already observed by our group in N-doped TiO2. The species was initially labeled as Nb˙5,6 and, more recently, was identified as an interstitial N atom bound to a lattice O2− ion, [NiO]˙.46 This species is characterized by an EPR signal showing a hyperfine pattern related to the interaction of the unpaired electron with one N nucleus. The second signal reported in ref. 29 shows hyperfine lines due to both N and B nuclei and for this reason has a quite complex trace. The species was assigned, on the basis of considerations on the electric neutrality of the solid, to a pair of nearby oxygen vacancies respectively filled by N2− and a B− ions. The presence of a more stable diamagnetic and electrically neutral counterpart of this species [N3−B−] (not monitored by EPR) is also proposed in ref. 29. In the case of the paramagnetic species, the unpaired electron is thought to reside on the N center in superhyperfine interaction with the B one. No direct chemical connection would exist between N and B ions. Though plausible, this assignment is not conclusively proven on the basis of the available evidence.
Hereafter we present and discuss the EPR data only for the NB6-6 sample which is representative also of the NB6-1 and NB6-15 samples. Fig. 3 reports the experimental EPR spectrum (a), recorded for the calcined NB6-6 sample containing 14N isotope. The simulation of the spectrum is also reported (b) together with the traces of the two individual signals (b′ and b′′) used in the simulation.
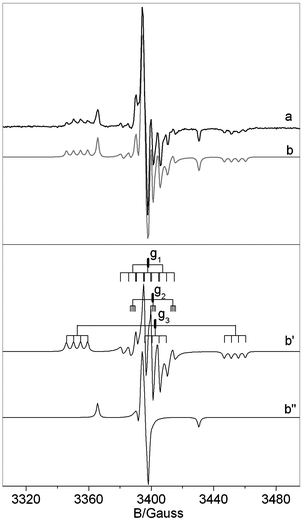 | ||
| Fig. 3 Experimental (a) and computer simulated (b) spectrum recorded for a NB6-6 sample. Lines b′ and b′′ are the traces of the two species introduced in the computation which determine the simulated trace in b. Notice that the shoulder present in spectrum b′ (due to the small N hyperfine coupling in the direction of g2) overlaps in the whole spectrum with the B hyperfine lines. | ||
The spectrum essentially is the same as that reported in ref. 29 and is determined by the superposition of two distinct signals corresponding to [NiO]˙ (b′′) and to the N–B mixed species ([NOB]˙) in b′. Both signals are dominated by a large component of the N hyperfine tensor centered on the g value labeled g3 which is larger in the case of the mixed [NOB]˙ species. The spectral trace of [NOB]˙ is highly complex because it contains 4 lines due to weak boron coupling (see Fig. 3b′) for each N component. Since the g tensor has rhombic symmetry (g1 ≠ g2 ≠ g3) the number of lines in this signal is 36 (3 × 3 × 4). For this reason, a comparison of the spectrum in Fig. 3 with a similar one obtained using 15N instead of 14N is extremely useful, see Fig. 4. The two nitrogen isotopes have in fact different nuclear spin (1 and ½, respectively) and comparison of the two N hyperfine structures is expected to increase the accuracy in the determination of the spin Hamiltonian parameters (each triplet due to 14N is transformed into a doublet with a separation 1.41 times larger and the total number of lines reduced to 24).
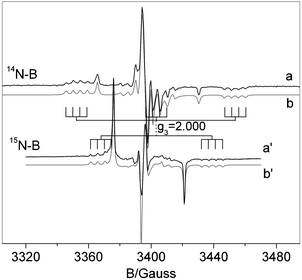 | ||
| Fig. 4 Experimental (a,a′) and computer simulated (b,b′) spectra recorded for NB6-6 (a) and 15NB6-6 (a′) samples. | ||
The two spectra have been simulated using the same g tensor and boron hyperfine constants. The 15N hyperfine constants have been scaled from the 14N ones by the ratio between the nuclear magnetic moments of the two isotopes (1.41). In other words, the same set of spin Hamiltonian parameters is employed in the two cases. The excellent agreement between the experimental and computed trace in the two cases strengthens the assignment of the parameters which are reported in Table 1.
| g | A(14N) | A(15N) | A(11B) | ρ 2p/N | ρ 2p (B) | |||||||||
|---|---|---|---|---|---|---|---|---|---|---|---|---|---|---|
| g 1 | g 2 | g 3 | A 1 | A 2 | A 3 | A 1 | A 2 | A 3 | A 1 | A 2 | A 3 | |||
| [NiO]˙ | 2.006 | 2.005 | 2.004 | 2.2 | 3.1 | 32.3 | 3.0 | 4.4 | 32.3 | — | — | — | 0.54 | — |
| [NOB]˙ | 2.004 | 2.003 | 2.001 | 9.3 | 9.9 | 50.4 | 13.1 | 13.8 | 70.7 | 4.8 | 0.6 | 4.6 | 0.70 | 0.07 |
The features of the [NiO]˙ species have been already discussed.5,6 Here we concentrate on the features of the new [NOB]˙ center which is by far the most abundant in N–B/TiO2. In a series of distinct preparations of NB6-6 the ratio [NOB]˙/[NiO]˙ ranges between 8 and 10. This difference, indicating the prevalence of the N–B mixed center in the material, must be taken, however, with some caution since the concentration of the two diamagnetic counterparts [NOB]− and [NiO]−, also present in the material but not directly monitored by any technique in the present study, could significantly alter the above reported ratio. The N hyperfine constants of [NOB]˙ are rather high (Table 1) and can be decomposed as follows:
 | (1) |
The EPR intensity of the two species ([NOB]˙ and [NiO]˙) grows linearly with the square root of the microwave power, between 0 and 1 mW. At higher microwave power both species tend to saturate (data not reported). A comparison of the relative intensities of the two species is therefore meaningful only at microwave power ≤1 mW.
Fig. 5 reports the spectra recorded at 0.1 mW in the range between 200 K and 350 K. It is easy to see that, raising the temperature, the intensity of [NOB]˙ increases, while that of [NiO]˙ simultaneously decreases by the same amount. By reproducing the spectral shape with a computer simulation, one can obtain, beside the spin Hamiltonian parameters, also the abundance of the two distinct species used to fit the experimental shape. The abundance of each species is reported in Fig. 5b from which it is easy to see that the decrease of the intensity of one signal corresponds to the increase of the other one. The phenomenon is reversible. The experiment could not be performed in a larger temperature range because of the interference, at low temperature, of the signal of molecular NO, always present in the cavities of sol–gel prepared N–TiO2.33 This result seems to indicate a thermally induced exchange of electrons from one center to the other. The simultaneous presence of a diamagnetic counterpart (see next section) for each paramagnetic center6 and the proximity of the N-related levels to the valence band suggest, however, some caution in assigning the observed changes (Fig. 5) to a specific electron transfer. Still, a modest temperature variation affects the population of the two paramagnetic centers indicating that various diamagnetic and paramagnetic states are present in a relatively small energy range of the band gap.
![EPR spectra [A] of the NB6-6 sample recorded at 0.1 mW microwave power and variable temperature in the range 200 K–350 K. Each experimental spectrum is reported with the corresponding simulation. [B] Abundance of the [NOB]˙ (●) and [NiO]˙ (■) species as a function of recording temperature.](/image/article/2011/CP/c0cp00143k/c0cp00143k-f5.gif) | ||
| Fig. 5 EPR spectra [A] of the NB6-6 sample recorded at 0.1 mW microwave power and variable temperature in the range 200 K–350 K. Each experimental spectrum is reported with the corresponding simulation. [B] Abundance of the [NOB]˙ (●) and [NiO]˙ (■) species as a function of recording temperature. | ||
Summarizing, N–B/TiO2 contains two types of paramagnetic species composed of one single N atom. The first species is the well known [NiO]˙ also present in N–TiO2 while the second ([NOB]˙) also contains boron and is more abundant than the former one. Like [NiO]˙, the new species is characterized by a predominant role of a N 2p orbital in the total spin distribution (Table 1). In this sense the two N containing species are similar. However, [NOB]˙ exhibits, with respect to [NiO]˙, a higher electron spin density on the N 2p orbital.
3.2 Theoretical calculations
The experimental EPR data clearly points to a species where the unpaired electron is essentially localized on a nitrogen atom “weakly interacting” with a neighbouring boron atom, as proven by the registered superhyperfine coupling constants. The modeling is based on this experimental indication and on some previously consolidated results on the N-doped and B-doped systems. For the B-doped system we clearly found that the interstitial species are definitely more stable than the substitutional (to O) one.43 Moreover, when interstitial, the B atom is in a positive oxidation state, B3+, and acts as an electron donor. Starting from this basic knowledge, we have constructed different models of the [NOB]˙ defect center (see also section 2.2 of Computational details). First we tried to insert a N atom in a nearby position with respect to an interstitial B atom. Two interstitial B species have been considered: a three-coordinated (Bi-3c or BO3) and a four-coordinated one (Bi-4c or BO4). The nitrogen was inserted substitutional to one of the lattice oxygens coordinated to the B atom (models [Ns–Bi-3c]˙ and [Ns–Bi-4c]˙ in Fig. 6) and then it was inserted in an interstitial position, bound to one of the lattice oxygens coordinated to the B atom ([Ni–Bi-3c]˙ in Fig. 6). Notice that what is reported in Fig. 6 are the final configurations, resulting from the full geometry optimization. The [Ni–Bi-3c]˙ defect has a different initial structure, where the B and the N atoms are interstitials, and the connecting oxygen occupies its regular lattice position. During the geometry optimization this O–N unit moves towards the B3+ ion so that in the final structure the N atom has effectively taken the position of the original lattice oxygen.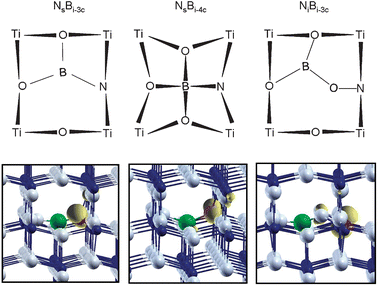 | ||
| Fig. 6 Schematic representation of the three N–B co-doped anatase TiO2 models reported in this work (upper panel). Spin density plot of the corresponding supercell model (lower panel; Ti in blue, O in grey, B in green and N in red). The unpaired spin (yellow) is essentially localized on the N atom in all the three cases. | ||
The last model is more consistent with the fact that in the previous N-doped TiO2 synthesis,5 essentially very similar to the one performed in this work, nitrogen is commonly found to enter the TiO2 lattice in the interstitial mode (bound to a lattice O), as clearly shown by a variety of methods and by the comparison of experimental with theoretical results.5,46 We have actually analyzed other possible situations but these three are found to be the only ones fulfilling the requirement of an unpaired spin on the N atom with a nearby B nucleus which could eventually give rise to some superhyperfine interaction, as observed experimentally.
After geometry optimization of these three model systems, the details of the electronic structure have been analyzed and the hyperfine coupling constants have been computed. The most relevant information related to the electronic structure is that the defect levels originated by the impurities in all the three models proposed do not fall into the band gap of TiO2. They fall below the bottom of the VB (BO states in all the three models), inside the VB (substitutional N states in [Ns–Bi-3c]˙ and [Ns–Bi-4c]˙) or just above (0.13 eV) the top of VB (π* NO state of Ni species in [Ni–Bi-3c]˙). This result is different from what is commonly observed for substitutional and interstitial N species (paramagnetic defect states are 0.13 and 0.64 eV above the VB maximum, respectively)5,46 and can be easily explained by the effect of having an oxidized B as a next neighbor to the N species. The electron deficient B causes an electrostatic stabilization in energy of the N levels which, consequently, are shifted downward with respect to their original position in the band gap of TiO2. Of course, this effect is not advantageous for the vis-light activation of TiO2 but could have secondary effects on the stability of N-species in TiO2.
The computation of the hyperfine coupling constants provides the information for a possible assignment of the observed N–B species in bulk anatase TiO2. First of all, all the three models considered (Fig. 6) not only present large hyperfine coupling constants on the N atom, indicating that the unpaired electron essentially resides on this nucleus, but they also present superhyperfine coupling constant with the neighbouring B nucleus. Both these features are in agreement with the experimental findings reported above. The best quantitative agreement with experimental data, however, is achieved when considering the [Ni–Bi-3c]˙ model, Fig. 6c. The computed dipolar tensor B for the N nucleus is almost identical to the registered spectrum (Table 2) reproducing the exceptionally high b value measured for [NOB]˙ species, which is larger than those observed in various N containing species based on similar π* systems.47 The isotropic coupling constant is slightly underestimated because of some deficiency of the basis set functions describing the core states of the N atom. The hyperfine tensor for the B species is also rather close to the experimental one. The high spin density on the N atom (0.84 vs. 0.70 in the NiO model according to B3LYP calculations), also found experimentally (Table 1), is due to the fact that the unpaired electron resides in a π* MO on the NO unit which is further polarized towards the N atom by the interaction of the O with the interstitial B atom.
| 14N | 11B | |||||||
|---|---|---|---|---|---|---|---|---|
| a iso | B 1 | B 2 | B 3 | a iso | B 1 | B 2 | B 3 | |
| (1) [Ns–Bi-3c]˙ | 15.3 | −11.6 | −11.0 | 22.6 | −3.0 | −0.6 | −0.3 | 0.9 |
| (2) [Ns–Bi-4c]˙ | 14.6 | −10.9 | −10.5 | 21.4 | −2.2 | −0.2 | −0.5 | 0.7 |
| (3) [Ni–Bi-3c]˙ | 15.5 | −14.3 | −12.9 | 27.2 | −2.1 | −0.9 | −0.7 | 1.6 |
| Exp. | 23.2 | −13.9 | −13.3 | 27.2 | −3.3 | −1.5 | −1.3 | 0.7 |
The agreement of the computed EPR parameters with the experimental findings for the species [Ni–Bi-3c]˙ is more than satisfactory. This, together with the consideration that interstitial N in TiO2 is more in line with previous experimental findings for N-doped TiO2,5,46 makes us confident about the assignment of the observed [NOB]˙ species to the [Ni–Bi-3c]˙ model.
The [Ni–Bi-3c]˙ species is an excellent electron acceptor with its singly occupied state just at the top of the VB; on the other hand, interstitial B is a strong electron donor.43 The trapping of an extra electron by [NOB]˙ leads to the formation of a diamagnetic [NOB]− center and causes an upward shift of the highest defect state which now lies 0.44 eV above the VB maximum, Fig. 7.
![Schematic representation of interplay between the [NOB]˙ and [NiO]˙ centers in N–B co-doped TiO2.](/image/article/2011/CP/c0cp00143k/c0cp00143k-f7.gif) | ||
| Fig. 7 Schematic representation of interplay between the [NOB]˙ and [NiO]˙ centers in N–B co-doped TiO2. | ||
Thus, the charged [NOB]− defect center can play a role in the visible light activity of N–B co-doped TiO2 while the neutral [NOB]˙ form does not contribute to the red-shift of the absorption edge. The trapping ability of the [NOB]˙ center can explain the observed change in abundance of paramagnetic [NOB]˙ and [NiO]˙ centers with temperature, Fig. 5. [NiO]˙ centers are certainly higher in energy with respect to the two [NOB] centers.5 In particular, it is possible that a thermally stimulated electron exchange occurs between [NOB]− and [NiO]˙ centers, with formation of [NOB]˙ and [NiO]−, Fig. 7. This would explain the increase in concentration of [NOB]˙ and the related decrease of [NiO]˙ centers with temperature, Fig. 5. Of course, the process can also involve more complex pathways which need a specific study in order to be elucidated in detail.
4. Conclusions
Nitrogen–boron co-doped TiO2 contains extrinsic defects responsible for visible light absorption. In the solid the [NiO]˙ paramagnetic species (already observed and characterized in singly doped N–TiO2),5–7,29,46 is accompanied by the more abundant [NOB]˙ center. Here we provide, based on well resolved CW-EPR spectra of both [14NOB]˙ and [15NOB]˙ and DFT calculations, convincing evidence on the nature and structure of this new species. N and B atoms are interstitial species connected to the same O lattice ion. B, additionally, binds two other O ions reproducing the typical trigonal structure of B–O compounds. In this arrangement N acquires a surprisingly high spin density mainly concentrated in a 2p orbital (0.70 from EPR data or 0.84 from B3LYP calculations which compares with 0.54 from EPR data or 0.70 from B3LYP calculations found for the similar [NiO]˙) which is nicely reproduced by theoretical calculations. This unusually large spin density is due to the fact that the unpaired electron resides in a π*-like MO of the NO unit which is polarized towards the N atom by the interaction of the O with B.The energy level of the [NOB]˙ species is located close to edge of the valence band and lies below the corresponding level of [NiO]˙6,46 because of the electrostatic stabilization induced by the electron deficiency on boron. In this respect, the paramagnetic [NOB]˙ center does not contribute to the visible light activity. However, due to its low position in the gap, the [NOB]˙ center turns out to be a good electron acceptor which can trap charge leading to the formation of diamagnetic [NOB]− species. The energy level associated to [NOB]− lies higher in the gap than the neutral form and can contribute to the visible light activity of N–B co-doped TiO2. Unfortunately, the simultaneous presence of the states induced by N-doping which are certainly inducing visible light activity, does not allow one to reach a firm conclusion about the role of the [NOB]˙ and [NOB]− states in the optical properties of N–B co-doped TiO2. Finally, the interplay between different paramagnetic centers indicates that the population of the defect states in their paramagnetic and diamagnetic form is temperature-dependent.
Acknowledgements
The CILEA supercomputing center is acknowledged for the computer time provided to run this project.References
- R. Asahi, T. Morikawa, T. Ohwaki, K. Aoki and Y. Taga, Science, 2001, 293, 269–271 CrossRef CAS.
- T. L. Thompson and J. T. Yates Jr., Chem. Rev., 2006, 106, 4428–4453 CrossRef CAS.
- A. Fujishima and K. Honda, Nature, 1972, 238, 37–38 CAS.
- Special Issue in Chemical Physics: Doping and functionalization of photo-active semiconducting oxides 2007, 339, 1–192. Guest Editors: C. Di Valentin, U. Diebold and A. Selloni.
- C. Di Valentin, G. Pacchioni, A. Selloni, S. Livraghi and E. Giamello, J. Phys. Chem. B, 2005, 109, 11414–11419 CrossRef CAS.
- S. Livraghi, M. C. Paganini, E. Giamello, A. Selloni, C. Di Valentin and G. Pacchioni, J. Am. Chem. Soc., 2006, 128, 15666–15671 CrossRef CAS.
- C. Di Valentin, E. Finazzi, G. Pacchioni, A. Selloni, S. Livraghi, M. C. Paganini and E. Giamello, Chem. Phys., 2007, 339, 44–56 CrossRef CAS.
- H. Irie, Y. Watanabe and K. Hashimoto, J. Phys. Chem. B, 2003, 107, 5483–5486 CrossRef CAS.
- S. Sakthivel, M. Janczarek and H. Kisch, J. Phys. Chem. B, 2004, 108, 19384–19387 CrossRef CAS.
- M. Miyauchi, A. Ikezawa, H. Tobimatsu, H. Irie and K. Hashimoto, Phys. Chem. Chem. Phys., 2004, 6, 865–870 RSC.
- O. Diwald, T. L. Thompson, T. Zubkov, E. G. Goralski, S. D. Walck and J. T. Yates Jr., J. Phys. Chem. B, 2004, 108, 6004–6008 CrossRef CAS.
- M. Mrowetz, W. Balcerski, A. J. Colussi and M. R. Hoffmann, J. Phys. Chem. B, 2004, 108, 17269–17273 CrossRef CAS.
- J. L. Gole, J. D. Stout, C. Burda, Y. Lou and X. Chen, J. Phys. Chem. B, 2004, 108, 1230–1240 CrossRef CAS.
- S. Sato, R. Nakamura and S. Abe, Appl. Catal. B, 2005, 284, 131–137 CAS.
- Z. Lin, A. Orlov, R. M. Lambert and M. C. Payne, J. Phys. Chem. B, 2005, 109, 20948–20952 CrossRef CAS.
- M. Sathish, B. Viswanathan, R. P. Viswanath and C. S. Gopinath, Chem. Mater., 2005, 17, 6349–6353 CrossRef CAS.
- Y. Nosaka, M. Matsushita, J. Nasino and A. Y. Nosaka, Sci. Technol. Adv. Mater., 2005, 6, 143–148 CrossRef CAS.
- M. Alvaro, E. Carbonell, V. Fornés and H. Garcia, ChemPhysChem, 2006, 7, 200–205 CrossRef CAS.
- Y. Irokawa, T. Morikawa, K. Aoki, S. Kosaka, T. Ohwaki and Y. Taga, Phys. Chem. Chem. Phys., 2006, 8, 1116–1121 RSC.
- F. E. Oropeza, J. Harmer, R. G. Egdell and R. G. Palgrave, Phys. Chem. Chem. Phys., 2010, 12, 960–969 RSC.
- W. Zhao, W. Ma, C. Chen, J. Zhao and Z. Shuai, J. Am. Chem. Soc., 2004, 126, 4782–4783 CrossRef CAS.
- S. In, A. Orlov, R. Berg, F. Garcıa, S. Pedrosa-Jimenez, M. S. Tikhov, D. S. Wright and R. M. Lambert, J. Am. Chem. Soc., 2007, 129, 13790–13791 CrossRef CAS.
- M. Fittipaldi, V. Gombac, T. Montini, P. Fornasiero and M. Graziani, Inorg. Chim. Acta, 2008, 361, 3980–3987 CrossRef CAS.
- D. Li, H. Haneda, S. Hishita and N. Ohashi, Chem. Mater., 2007, 17, 2588 and 2596.
- C. Di Valentin, E. Finazzi, G. Pacchioni, A. Selloni, S. Livraghi, A. M. Czoska, M. C. Paganini and E. Giamello, Chem. Mater., 2008, 20, 3706–3714 CrossRef.
- S. Livraghi, K. Elghniji, A. M. Czoska, M. C. Paganini, E. Giamello and M. Ksibi, J. Photochem. Photobiol., A, 2009, 205, 93–97 CrossRef CAS.
- V. Gombac, L. De Rogatis, A. Gasparotto, G. Vicario, T. Montini, D. Barreca, G. Balducci, P. Fornasiero, E. Tondello and M. Graziani, Chem. Phys., 2007, 339, 111–123 CrossRef CAS.
- G. Liu, Y. Zhao, C. Sun, F. Li, G. Qing Lu and H.-M. Cheng, Angew. Chem., Int. Ed., 2008, 47, 4516–4520 CrossRef CAS.
- N. O. Gopal, H.-H. Lo and S.-C. Ke, J. Am. Chem. Soc., 2008, 130, 2760–2761 CrossRef CAS.
- G. Liu, C. Sun, L. Chang, Y. Jin, H. Lu, L. Wang, S. C. Smith, G. Q. Lu and H.-M. Cheng, J. Phys. Chem. C, 2009, 113, 12317–12324 CrossRef CAS.
- D. J. Mowbray, J. I. Martinez, J. M. Garcia Lastra, K. S. Thygesen and K. W. Jacobsen, J. Phys. Chem. C, 2009, 113, 12301–12308 CrossRef CAS.
- S. Livraghi, A. Votta, M. C. Paganini and E. Giamello, Chem. Commun., 2005, 4, 498–500 RSC.
- S. Livraghi, M. Chierotti, E. Giamello, G. Magnacca, M. C. Paganini, G. Cappelletti and C. Bianchi, J. Phys. Chem. C, 2008, 112, 17244–17252 CrossRef CAS.
- T. Spalek, P. Pietrzyk and Z. Sojka, J. Chem. Inf. Model., 2005, 45, 18–29 CrossRef CAS.
- A. D. Becke, J. Chem. Phys., 1993, 98, 5648–5652 CrossRef CAS.
- C. Lee, W. Yang and R. G. Parr, Phys. Rev. B: Condens. Matter, 1988, 37, 785–789 CrossRef CAS.
- R. Dovesi, R. V. R. Saunders, C. Roetti, R. Orlando, C. M. Zicovich-Wilson, F. Pascale, B. Civalleri, K. Doll, N. M. Harrison, I. J. Bush, Ph. D'Arco and M. Llunell, CRYSTAL06 User's Manual, University of Torino, Italy, 2006 Search PubMed.
- C. M. Zicovich-Wilson and R. Dovesi, J. Phys. Chem. B, 1998, 102, 1411–1417 CrossRef CAS.
- E. Ruiz, M. Llunell and P. Alemany, J. Solid State Chem., 2003, 176, 400–411 CrossRef CAS.
- R. Pandey, J. E. Jaffe and N. M. Harrison, J. Phys. Chem. Solids, 1994, 55, 1357–1361 CrossRef CAS.
- R. Orlando, R. Dovesi and C. Roetti, J. Phys.: Condens. Matter, 1990, 2, 7769–7789 CrossRef CAS.
- Y. Zhang, W. Lin, K. Ding and J. Li, J. Phys. Chem. B, 2005, 109, 19270–19277 CrossRef CAS.
- E. Finazzi, C. Di Valentin and G. Pacchioni, J. Phys. Chem. C, 2009, 113, 220–228 CrossRef CAS.
- C. Di Valentin, G. Pacchioni and A. Selloni, J. Phys. Chem. C, 2009, 113, 20543–20552 CrossRef CAS.
- J. A. Weil, J. R. Bolton and J. E. Wertz, Electron Paramagnetic Resonance, John Wiley & Sons, New York, 1994 Search PubMed.
- F. Napoli, M. Chiesa, S. Livraghi, E. Giamello, S. Agnoli, G. Granozzi, G. Pacchioni and C. Di Valentin, Chem. Phys. Lett., 2009, 477, 435–438.
- M. Chiesa, E. Giamello and M. Che, Chem. Rev., 2010, 110, 1320–1347 CrossRef CAS.
| This journal is © the Owner Societies 2011 |