Rapid cell extraction in aqueous two-phase microdroplet systems
Kalpana
Vijayakumar
ab,
Shelly
Gulati
ab,
Andrew J.
deMello
*a and
Joshua B.
Edel
*ab
aDepartment of Chemistry, Imperial College London, Exhibition Road, South Kensington, London, UK SW7 2AZ. E-mail: a.demello@imperial.ac.uk
bInstitute of Biomedical Engineering, Imperial College London, Exhibition Road, South Kensington, London, UK SW7 2AZ. E-mail: joshua.edel@imperial.ac.uk
First published on 11th August 2010
Abstract
Distinguishing specific cells is an essential technique in cell research and clinical diagnostics. We report a novel method to passively isolate and extract cells in a microfluidic device. We utilise a droplet-based microfluidic system to generate an aqueous two phase system in which aqueous droplets consist of two phases in the form of a double emulsion. Specifically, we generate PEG droplets that completely encapsulate DEX droplets within a microfluidic channel. Target cells can be introduced directly into the droplets and driven to partition to the more favourable phase, whilst still being contained within the aqueous droplet. Human T lymphoma cells, with diameters in the range of 10–15 μm, are chosen as a model cell line to demonstrate the partitioning.
Introduction
Over the past two decades microfluidic systems have been shown to be extremely useful in processing small sample volumes and have been intensively developed into valuable instrumental platforms for chemical and biological analysis. More recently, much attention has focused on using droplet-based or segmented-flow microfluidic systems in high-throughput experimentation.1 Such systems leverage instabilities between two or more immiscible flows to form suspended droplets encapsulated within a continuous carrier fluid.2 Since the droplets (or plugs) can be controllably formed with changeable reagent composition and at high frequencies (in excess of 1 kHz) segmented flow systems of this kind have been used to good effect in areas such as cell-based analysis, nanomaterial synthesis and rapid chemical reactions.3,4 The need for cell separation in distinguishing and isolating cells of a given type has been identified as an essential technique in cell and tissue engineering for clinical applications in emergent areas, such as cell therapy and regenerative medicine.5 Previously, a number of publications have reported the use of droplet-based microfluidic systems to isolate, encapsulate and characterise single (or small populations of) cells in high-throughput.6,7 In these studies fluorescence-based detection methods are commonly used to locate, identify and discriminate cells within a specific droplet. Cell separation and sorting have also been demonstrated in droplet-based microfluidic formats.8–11 However, in a similar manner to fluorescence activated cell sorting, measurements typically involve the use of fluorescence labels or tags to identify the target cells and electric fields to navigate droplets containing target cells to a separate channel or reservoir, while droplets containing unwanted material pass unhindered into a waste channel.12–15 An alternative approach involves performing liquid–liquid extraction within an aqueous two-phase system (ATPS). Briefly, an ATPS is comprised of two immiscible polymer phases, such as polyethylene glycol (PEG) and dextran (DEX), or one polymer and a complementary salt solution. Importantly, both phases in an ATPS are primarily water-based and provide biologically friendly environments.16,17 Numerous ATPS systems have been characterised for both fluid properties and their ability to separate different biological materials. These include both soluble substances, such as proteins18,19 and nucleic acids,20–23 and suspended particles, such as whole cells.24,25 Target species, when added to an ATPS, distribute between phases by their own thermal motion to reach equilibrium.16 Not surprisingly, in bulk systems, particle diffusion and phase separation is very slow, leading to unacceptably long equilibrium times (on the order of many hours). Additionally, the process of phase separation is extremely sensitive to modest changes in analyte concentration. These difficulties have been addressed in part through the transferral of ATPS to a microfluidic format. For example, Nam et al. reported the use of stable aqueous two-phase laminar flows in microchannels to establish an ATPS. In this study live Chinese hamster ovary cells introduced into the system were favourably partitioned to the PEG phase, whilst dead cells remained at the interface between the two phases.26 More recently, using a similar continuous-flow microfluidic setup, Meagher et al. demonstrated protein purification by using genetically-engineered partition tags to drive the partitioning into the PEG phase.27 Whilst ATPS in laminar microfluidic formats allows extraction of target species in an efficient manner, there are difficulties associated with such formats. For example, target particles are necessarily diluted within the laminar flow streams used, and the adoption of a co-flow format requires the maintenance of stable fluidic interfaces over uncharacteristically long distances. Contrastingly, a PEG/DEX combination has also been used to perform nanolitre liquid patterning on a cell monolayer.28 A cell culture was covered with the PEG phase and DEX droplets containing various sets of reagents were placed on the surface to treat discrete groups of cells.Herein, we introduce a novel method to passively isolate, extract and sort cells in a microfluidic device. Specifically, we utilise a droplet-based microfluidic system to generate an ATPS in which aqueous droplets consist of two phases in the form of a double emulsion, with a PEG droplet completely encapsulating a DEX droplet. Target cells can be introduced directly into the droplets and driven to partition to the more favourable phase, whilst still being contained within the aqueous droplet. Human T lymphoma (Jurkat) cells, with diameters in the range of 10–15 μm, are chosen as a model cell line to demonstrate the partitioning. Indeed, Kumar et al. have previously shown that in a bulk PEG–DEX ATPS, Jurkat cells efficiently partition to the PEG phase when bound to an antibody-N-isopropylacrylamide (Ab-NIPAM) conjugate.29 Accordingly, we too use Jurkat cells bound to an Ab-NIPAM conjugate to demonstrate the efficacy of our approach and show that cell migration occurs passively and rapidly within a pL volume.
Experimental
Device fabrication and operation
The microfluidic devices used for all the experiments were structured in polydimethylsiloxane (PDMS), using standard soft lithography techniques. Briefly, the microchannel layout was designed using AutoCAD (Autodesk, Inc.), printed onto an acetate film mask (Circuit Graphics, Essex, UK) and then transferred to an SU8 master, which serves as the mould for subsequent soft lithography.30 PDMS base and curing agent (Sylgard184, Dow Corning, Coventry UK) were mixed at a ratio of 10![[thin space (1/6-em)]](https://www.rsc.org/images/entities/char_2009.gif) :
:![[thin space (1/6-em)]](https://www.rsc.org/images/entities/char_2009.gif) 1 (w/w) and poured onto the master. After curing at 70 °C, the structured PDMS substrate was peeled off the master. Access to the channels was achieved by punching holes at the appropriate reservoir locations using a biopsy punch (Kai Europe GmBH, Solingen, Germany). The channels were then sealed by plasma bonding a microscope cover slip to the PDMS substrate. All devices have 2 aqueous inlets, one oil inlet and an outlet with a uniform channel depth of 100 μm. The channel width was 100 μm, with the exception of a winding channel section of a narrower width of 40 μm. This was introduced into the channel network to induce chaotic mixing within the droplets.1,31,32 A schematic and a photographic image of the device are shown in Fig. 1a and 1d, respectively.
1 (w/w) and poured onto the master. After curing at 70 °C, the structured PDMS substrate was peeled off the master. Access to the channels was achieved by punching holes at the appropriate reservoir locations using a biopsy punch (Kai Europe GmBH, Solingen, Germany). The channels were then sealed by plasma bonding a microscope cover slip to the PDMS substrate. All devices have 2 aqueous inlets, one oil inlet and an outlet with a uniform channel depth of 100 μm. The channel width was 100 μm, with the exception of a winding channel section of a narrower width of 40 μm. This was introduced into the channel network to induce chaotic mixing within the droplets.1,31,32 A schematic and a photographic image of the device are shown in Fig. 1a and 1d, respectively.
Droplet formation and detection
All solutions were delivered into the microfluidic channels using 1 ml BD Plastipak syringes (VWR, UK) and precision syringe pumps (PHD 2000, Harvard Apparatus, Kent UK). The carrier fluid was a mixture of FC 3283 oil (3M, Bracknell, UK), EGC-1700 (3M, Bracknell, UK) and 1H,1H,2H,2H-perfluorooctanol (Sigma-Aldrich, Dorset, UK) at a ratio of 8![[thin space (1/6-em)]](https://www.rsc.org/images/entities/char_2009.gif) :
:![[thin space (1/6-em)]](https://www.rsc.org/images/entities/char_2009.gif) 1
1![[thin space (1/6-em)]](https://www.rsc.org/images/entities/char_2009.gif) :
:![[thin space (1/6-em)]](https://www.rsc.org/images/entities/char_2009.gif) 1 (v/v/v). Portex® fine bore tubing (0.38 mm ID, 1.09 OD, Smiths Medical International Ltd, Kent, UK) was connected to the syringes via needles (BD Microlance™ 3 Nr.18, VWR, UK) and directly inserted into the access holes in the devices. Droplets were observed under 20× magnification and recorded using a high speed camera (Phantom®, v649).
1 (v/v/v). Portex® fine bore tubing (0.38 mm ID, 1.09 OD, Smiths Medical International Ltd, Kent, UK) was connected to the syringes via needles (BD Microlance™ 3 Nr.18, VWR, UK) and directly inserted into the access holes in the devices. Droplets were observed under 20× magnification and recorded using a high speed camera (Phantom®, v649).
ATPS
PEG (MW 6000) and DEX (MW 500000) were purchased from Sigma Aldrich and used as received. ATPS were formed by dissolving 3.8% PEG and 5.5% DEX in 90.7% phosphate-buffered saline (PBS, Invitrogen) (w/w/v). The ATPS solution was mixed thoroughly using a vortex and then centrifuged at 5000g for 20 min to separate the two phases. Top and bottom phases were extracted separately and loaded into two syringes.Cells
Jurkat cells were obtained from American Type Culture Collection (ATCC). The culture medium was prepared using 88% RPMI supplemented with 10% foetal bovine serum (FBS), 1% L-glutamine and 1% penicillin–streptomycin (all purchased from Invitrogen). Jurkat cells were cultured in-house, harvested when confluent and re-seeded to continue cell culturing. Experiments were carried out using cells from cultures between passages 0 and 10.Cell sample preparation
Mouse monoclonal anti-CD3-FITC conjugates (Ab), itaconic anhydride, NIPAM, ammonium persulfate (APS), N,N,N′,N′-tetramethylethylenediamine (TEMED) and dialysis bags were purchased from Sigma Aldrich. The protocol for the copolymerisation of antibodies with NIPAM follows the recipe presented by Kumar et al., with adjustments made to suit the microfluidic environment.29 All solutions were prepared using 150 mM phosphate buffer at pH 7.8. The buffer was purchased at pH 7 from Sigma Aldrich and 10 drops of 1 M NaOH were added to 20 ml of buffer to increase the pH to 7.8. 100 μl of Ab-FITC solution was added to 4.9 ml of the phosphate buffer. While continuously stirring, 114.3 μl of itaconic anhydride was added to this, resulting in a decrease in pH. Accordingly, 500 mM NaOH was added drop-wise to re-adjust the pH to 7.8. Subsequently, 250 mg of glucose was added and the mixture incubated at approximately 4 °C for 30 min with continuous stirring. Glucose was used since it is known to stabilise the reaction with itaconic anhydride.29 The mixture was then dialysed overnight against DI water at 4 °C, with the volume of the solution nearly doubling at the end of the dialysis. For copolymerisation with NIPAM, 0.05 g of NIPAM was added and the solution placed in a desiccator for de-gassing. Subsequently, 100 μl of APS was added and de-gassing repeated. Finally, 10 μl of TEMED was added to the mixture. The reaction mixture was kept on ice for 5 min and then allowed to polymerise by incubating at 4 °C for 6 h. To precipitate the Ab-NIPAM conjugates, NaCl was added to a final concentration of 0.5 M and the mixture heated to 30 °C. Centrifugation at 9000g for 5 min allowed the precipitated conjugates to be collected in pellets at the bottom of the centrifuge tube. The supernatant was decanted and the pellets were dissolved in 2 ml DI water. The Ab-NIPAM conjugates were dialysed overnight against DI water at room temperature. The mixture was then loaded into Eppendorf tubes in 200 ml aliquots and stored at 4 °C.To prepare the Jurkat-Ab-NIPAM conjugates, the Ab-NIPAM aliquots were firstly diluted with DI water (1![[thin space (1/6-em)]](https://www.rsc.org/images/entities/char_2009.gif) :
:![[thin space (1/6-em)]](https://www.rsc.org/images/entities/char_2009.gif) 4 v/v). The Jurkat cells were incubated in the Ab-NIPAM solution for 20 min at 4 °C. To ensure a stable ATPS interface on-chip, it was essential to avoid a dilution of the DEX phase when adding the cell suspension. Common centrifugal tubes collect the required samples in a pellet at the bottom of the tubes, such that the supernatant can be removed through pipetting or other aspiration methods. However, this process resulted in the NIPAM forming large clusters rendering the conjugates unusable. Thus, centrifugal filter units (Vivaspin 500, Fisher Scientific Ltd, UK) were used instead. These filter units removed the supernatant through the filters at the bottom of the tubes, leaving a Jurkat-Ab-NIPAM suspension at high concentration. The cell suspension was centrifuged in these filter units at 1000 rpm for 10 min. Finally, DEX was added to the high concentration cell suspension and the sample was loaded into a syringe.
4 v/v). The Jurkat cells were incubated in the Ab-NIPAM solution for 20 min at 4 °C. To ensure a stable ATPS interface on-chip, it was essential to avoid a dilution of the DEX phase when adding the cell suspension. Common centrifugal tubes collect the required samples in a pellet at the bottom of the tubes, such that the supernatant can be removed through pipetting or other aspiration methods. However, this process resulted in the NIPAM forming large clusters rendering the conjugates unusable. Thus, centrifugal filter units (Vivaspin 500, Fisher Scientific Ltd, UK) were used instead. These filter units removed the supernatant through the filters at the bottom of the tubes, leaving a Jurkat-Ab-NIPAM suspension at high concentration. The cell suspension was centrifuged in these filter units at 1000 rpm for 10 min. Finally, DEX was added to the high concentration cell suspension and the sample was loaded into a syringe.
Results
ATPS formation
As described above, a device to successfully introduce samples and generate an ATPS in a microfluidic droplet format was realised. A standard T-junction configuration was employed to generate aqueous droplets in the oil carrier fluid. The two aqueous phases, PEG and DEX solutions, were delivered into the microfluidic device through 2 separate aqueous inlets (Fig. 1a). Upstream of the T-junction, the two solutions form a laminar flow arrangement with a clean and stable interface (Fig. 1b). At the T-junction, droplets containing both phases were formed in a highly reproducible fashion. Moreover, a definite separation between the two phases was observed at the second serpentine channel (as shown in the inset of Fig. 1b). Since the DEX flow rate is much smaller than the PEG flow rate the smaller droplet is composed of DEX, while the PEG phase forms the outer droplet that encapsulates the DEX phase. The phase configuration can also be predicted on the basis of the interfacial tension.33,34 With interfacial tension g, for phases 1 and 3 suspended in a phase 2, phase 1 is completely engulfed by phase 3, when g12 > g23. So we may assume that for this ATPS, gDEX-oil is larger than goil-PEG. A cartoon of this arrangement is shown in Fig. 1e.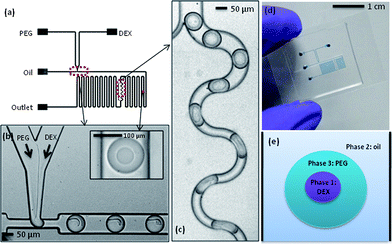 | ||
| Fig. 1 (a) Schematic illustrating device design. (b) Image showing droplet formation at the T-junction, with an inset showing an ATPS droplet further downstream. (c) The mixing region in the channel network. Droplets follow the winding channel path, which induces mixing through chaotic advection. Oil flows through the narrow channel path. (d) Image showing a complete device (channels are filled with blue dye for visualisation). (e) A sketch to illustrate the ATPS in a microfluidic droplet, with the PEG phase encapsulating the smaller DEX droplet. | ||
It was found that the entire droplet must be smaller than the cross-sectional channel dimension to maintain a stable separation of the two phases; we obtain spherical droplets with diameters in the range of 90–95 μm. Conversely, when plugs form, contact with the channel walls enables mixing within the droplets, such that the two-phase interface does not form. The smaller droplet size was achieved by using a restricted T-junction configuration, i.e. at the T-junction the channel width is approximately 45 μm, with the channel subsequently dilating to a width of 100 μm.
As in bulk experiments, the two phases must be mixed to achieve partitioning of the contained cells. This process can be expedited by agitating the ATPS after addition of the cells, which affords close contact between the two phases within a short time period. Though the distribution of the cells takes place during agitation, it is only after the two phases separate and form a clean interface that the distribution can be experimentally determined and processed. In a segmented-flow microfluidic platform, the most facile way to ensure complete mixing within each droplet is by way of chaotic advection. To initiate chaotic advection we integrated a winding channel section of smaller cross-sectional width than the droplets. Unfortunately, initial experiments showed that the increased pressure (due to a decreased channel volume) destabilises the ATPS, such that a clean separation is not possible. To overcome this problem and maintain the upstream channel volume, the channel was divided into two paths, one wider droplet path and one much narrower oil path. After entering the winding channel section, droplets were subjected to efficient chaotic mixing and consequently, the two phases were mixed thoroughly (Fig. 1c). Importantly, the PEG–DEX interface is re-established at the following second serpentine channel. The PEG and DEX droplet sizes were directly controlled via variation of the flow rates of the aqueous inlets, while the total droplet size was determined by the water fraction (the ratio of the total aqueous flow to the sum of the aqueous and oil flows).3 Typical oil and (total) aqueous flow rates were 4.0 μl min−1 and 1.5 μl min−1, respectively, thus generating a water fraction of 0.27. The effect of the ratio of the two aqueous phases on the PEG and DEX droplet sizes was investigated. While the PEG droplet size only changes minimally, the DEX droplet size decreases significantly, when the flow rate is varied by 0.4 μl min−1 (Fig. 2). For the cell experiments described herein, the most suitable flow rates were determined to be oil = 4.0 μl min−1, PEG = 1.4 μl min−1 and DEX = 0.1 μl min−1. These conditions generated droplets large enough to hold cells in either the DEX or PEG phase, with diameters of approximately (93 ± 5) μm for the PEG droplet and (41 ± 5) μm for DEX.
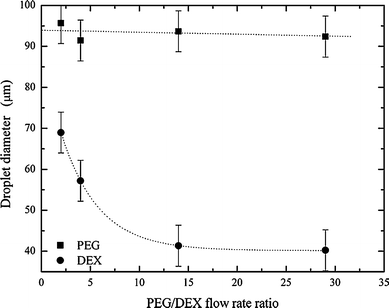 | ||
| Fig. 2 The dependence of PEG and DEX droplet size on flow rate ratios. The oil flow rate is held constant at 4 μl min−1. The aqueous flow rate ratio is varied, whilst maintaining a total aqueous flow rate of 1.5 μl min−1. | ||
Cell sample preparation
Fig. 3a shows a bright field image of Jurkat cells prior to incubation in Ab-NIPAM. Since FITC is bound to the Ab, the efficiency of Ab binding to the Jurkat cell surface can be determined by comparing fluorescence images before and after incubation. Fig. 3b illustrates the auto-fluorescence of cells, while the fluorescence of the cell after incubation is shown in Fig. 3d. The fluorescence intensity is significantly higher after incubation, indicating successful binding of the Ab-NIPAM conjugate to the Jurkat cell surface. Moreover, binding of the Ab-NIPAM conjugate to the cell surface is evident in the associated bright field image (Fig. 3c), with the cells appearing to be well coated by the polymer. It should be noted that the cell density after the centrifugation is considerably lower than the initial density. This is a result of cells being lost both during the centrifugation step and also during the transfer from the filter units to the syringe. To acquire a reasonable cell density in the syringe, an initial cell density of 3 × 10⁶ cells ml−1 was used for all experiments. The cells are viable post Ab-NIPAM treatment. Importantly, it should be noted that FITC was used in the current experiments as a way of monitoring the success of the binding of the Ab-NIPAM conjugate to the cell surface and analogous experiments can be carried out on populations without the fluorescence tag.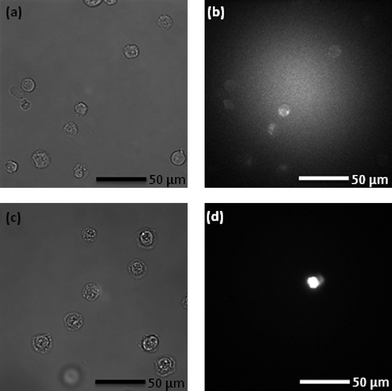 | ||
| Fig. 3 (a) Jurkat cells on a cover slip after harvesting from a cell culture, and (b) auto-fluorescence of cells when excited with 488 nm radiation. Note that the high intensity at the centre of the image is due to the excitation laser scattering. (c) Bright field image of Jurkat cells in DEX after incubation in the Ab-NIPAM conjugate and (d) fluorescence from harvested cells when excited with 488 nm radiation. Note that images (c) and (d) do not correlate directly. All cells labelled with Ab-NIPAM conjugates fluoresce. | ||
Partitioning of cells
The DEX sample containing the Jurkat-Ab-NIPAM conjugates was delivered into one aqueous inlet and the PEG solution introduced into the other aqueous inlet. Accordingly, cells enter the aqueous two phase microdroplet system within the DEX solution (Fig. 4a) and remain within the DEX droplet even after the interface between the two aqueous phases is established (Fig. 4b). It should also be noted that due to the high viscosity of DEX, a much smaller daughter droplet is also formed during the generation process. This droplet does not interfere with any downstream droplet manipulations. During the winding channel section, the two phases are thoroughly mixed, such that cells are free to experience both phases. At this point, the cells are close to both phases and once past the mixing section, the cells can be partitioned to the outer PEG phase, as seen in Fig. 4c. The mixing time in the winding channel is estimated to be 200 ms and upon exiting the winding channel section the phases separate within 650 ms. To assess the portioning process, the location of cells before and after mixing was evaluated. Using the centre of the DEX droplet as a reference point, the radial distance of the cell location from this position was determined (Fig. 5). Droplet videos were analysed using commercially available software (Image J, National Institutes of Health), and the distance from the DEX centre to the cell (for 150 droplets) for each condition were extracted. The error on the cell location measurement was estimated to be 5 μm. Analysing images limits location measurements to the lateral radial distance of the cells. To determine which phase the cells reside in, observations were made from the point of reforming of the ATPS after the winding channel section to the exit of the device. Cells residing within the DEX droplet move in and out of focus but do not cross the PEG–DEX boundary. Cells within the PEG phase also move in and out of focus, but when cells are laterally adjacent to the DEX droplet, they are clearly identifiable to be in the PEG phase and the radial distance can be measured. If cells in the PEG phase are below or above the DEX droplet, they are observed to move laterally adjacent to the DEX further downstream. Thus, tracing the cell location allows for definite identification of the phase in which the cells reside. Before incubation in Ab-NIPAM, the cells clearly remain in the DEX droplet, with 98% being located within the DEX droplet. Once cells have bound to Ab-NIPAM conjugate, they partition to the PEG phase, such that approximately 93% of cells are found in the outer PEG droplet. Additionally, it was found that cells predominantly localise well away from the PEG–DEX boundary. Various factors will affect the exact location of the cells within the PEG phase. These include the initial position of the cell when droplets are formed at the T-junction, the input flow rates utilised, the stability of the system and the position of the cells as droplets enter the mixing region.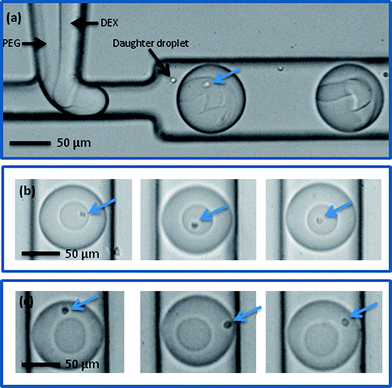 | ||
| Fig. 4 Cells with Ab-NIPAM conjugate in DEX at a microfluidic T-junction (a) and in a DEX droplet prior to mixing (b). Note that although small daughter droplets are formed, they do not merge with the larger ATPS droplets. After mixing, cells partition to the outer PEG phase (c). (Cells are indicated by arrows). | ||
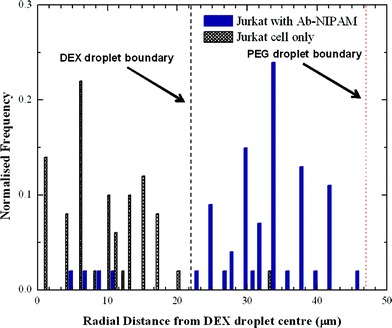 | ||
| Fig. 5 Distribution of cells before and after incubation with Ab-NIPAM conjugate. The average radii of DEX and PEG are shown as a dashed line. | ||
Conclusions
Herein, we have demonstrated that an ATPS can be realised in a microfluidic droplet format, suggesting significant opportunities in cell sorting in a high-throughput manner. Indeed, we believe that this technique is highly applicable to separating a heterogeneous cell population in high-throughput. The use of Ab-NIPAM conjugates can be applied to other cell systems, given that a suitable Ab is chosen, thus giving this method a wide range of applications. Moreover, the microfluidic system can easily be modified to separate the aqueous droplets from the oil phase35 and subsequently separate the two aqueous phases to extract cells. Accordingly, clean cell samples can be used for further analysis or manipulations.Acknowledgements
This work was supported in part by the RCUK Microdroplets Basic Technology Project (EP/D048664/1). KV would also like to acknowledge Fiona Pereira for assistance with sample preparation. The authors would like to acknowledge useful discussion with Antonio Garcia.Notes and references
- M. Srisa-Art, A. J. deMello and J. B. Edel, Anal. Chem., 2007, 79, 6682–6689 CrossRef CAS.
- H. Song, J. D. Tice and R. F. Ismagilov, Angew. Chem., Int. Ed., 2003, 42, 768–772 CrossRef CAS.
- A. Huebner, S. Sharma, M. Srisa-Art, F. Hollfelder, J. B. Edel and A. J. deMello, Lab Chip, 2008, 8, 1244–1254 RSC.
- M. Srisa-Art, E. C. Dyson, A. J. deMello and J. B. Edel, Anal. Chem., 2008, 80, 7063–7067 CrossRef CAS.
- M. Kamihira and A. Kumar, Adv. Biochem. Eng./Biotechnol., 2007, 106, 173–193 Search PubMed.
- A. Huebner, M. Srisa-Art, D. Holt, C. Abell, F. Hollfelder, A. J. deMello and J. B. Edel, Chem. Commun., 2007, 1218–1220 RSC.
- M. Srisa-Art, I. C. Bonzani, A. Williams, M. M. Stevens, A. J. deMello and J. B. Edel, Analyst, 2009, 134, 2239–2245 RSC.
- S. Koster, F. E. Angile, H. Duan, J. J. Agresti, A. Wintner, C. Schmitz, A. C. Rowat, C. A. Merten, D. Pisignano, A. D. Griffiths and D. A. Weitz, Lab Chip, 2008, 8, 1110–1115 RSC.
- J. U. Shim, L. F. Olguin, G. Whyte, D. Scott, A. Babtie, C. Abell, W. T. S. Huck and F. Hollfelder, J. Am. Chem. Soc., 2009, 131, 15251–15256 CrossRef CAS.
- M. Chabert and J. L. Viovy, Proc. Natl. Acad. Sci. U. S. A., 2008, 105, 3191–3196 CrossRef CAS.
- E. Brouzes, M. Medkova, N. Savenelli, D. Marran, M. Twardowski, J. B. Hutchison, J. M. Rothberg, D. R. Link, N. Perrimon and M. L. Samuels, Proc. Natl. Acad. Sci. U. S. A., 2009, 106, 14195–14200 CrossRef CAS.
- L. M. Fidalgo, G. Whyte, D. Bratton, C. F. Kaminski, C. Abell and W. T. S. Huck, Angew. Chem., Int. Ed., 2008, 47, 2042–2045 CrossRef CAS.
- J. C. Baret, O. J. Miller, V. Taly, M. Ryckelynck, A. El-Harrak, L. Frenz, C. Rick, M. L. Samuels, J. B. Hutchison, J. J. Agresti, D. R. Link, D. A. Weitz and A. D. Griffiths, Lab Chip, 2009, 9, 1850–1858 RSC.
- K. Ahn, C. Kerbage, T. P. Hunt, R. M. Westervelt, D. R. Link and D. A. Weitz, Appl. Phys. Lett., 2006, 88, 024104 CrossRef.
- B. Ahn, K. Lee, R. Louge and K. W. Oh, Biomicrofluidics, 2009, 3, 044102 CrossRef.
- P.-A. Albertsson, Partition of Cell Particles and Macromolecules, John Wiley & Sons, 1986 Search PubMed.
- A. Azevedo, P. Rosa, I. Ferreira and M. Aires-Barros, Trends Biotechnol., 2009, 27, 240–247 CrossRef CAS.
- B. Maestro, I. Velasco, I. Castillejo, M. Arevalo-Rodriguez, A. Cebolla and J. M. Sanz, J. Chromatogr., A, 2008, 1208, 189–196 CrossRef CAS.
- P. A. J. Rosa, A. M. Azevedo, S. Sommerfeld, M. Mutter, M. R. Aires-Barros and W. Backer, J. Biotechnol., 2009, 139, 306–313 CrossRef CAS.
- S. C. Ribeiro, G. A. Monteiro, J. M. S. Cabral and D. M. F. Prazeres, Biotechnol. Bioeng., 2002, 78, 376–384 CrossRef CAS.
- F. Luechau, T. C. Ling and A. Lyddiatt, Sep. Purif. Technol., 2009, 66, 397–404 CrossRef CAS.
- G. A. Gomes, A. M. Azevedo, M. R. Aires-Barros and D. M. F. Prazeres, Sep. Purif. Technol., 2009, 65, 22–30 CrossRef CAS.
- T. S. Porto, G. Silva, C. S. Porto, M. T. H. Cavalcanti, B. B. Neto, J. L. Lima, A. Converti, A. L. F. Porto and A. Pessoa, Chem. Eng. Process., 2008, 47, 716–721 CrossRef CAS.
- R. Hamamoto, M. Kamihira and S. Iijima, J. Ferment. Bioeng., 1996, 82, 73–76 CrossRef CAS.
- J. M. S. Cabral, in Cell Separation: Fundamentals, Analytical and Preparative Methods, ed. A. Kumar, I. Y. Galaev and B. Mattiasson, Springer-Verlag, Berlin, 2007, pp. 151–171 Search PubMed.
- K. Nam, W. Chang, H. Hong, S. Lim, D. Kim and Y. Koo, Biomed. Microdevices, 2005, 7, 189–195 CrossRef.
- R. J. Meagher, Y. K. Light and A. K. Singh, Lab Chip, 2008, 8, 527–532 RSC.
- H. Tavana, A. Jovic, B. Mosadegh, Q. Y. Lee, X. Liu, K. E. Luker, G. D. Luker, S. J. Weiss and S. Takayama, Nat. Mater., 2009, 8, 736–741 CrossRef CAS.
- A. Kumar, M. Kamihira, I. Galaev, B. Mattiasson and S. Iijima, Biotechnol. Bioeng., 2001, 75, 570–580 CrossRef CAS.
- N. P. Beard, J. B. Edel and A. J. deMello, Electrophoresis, 2004, 25, 2363–2373 CrossRef CAS.
- M. Bringer, C. Gerdts, H. Song, J. Tice and R. Ismagilov, Philos. Trans. R. Soc. London, Ser. A, 2004, 362, 1087–1104 CrossRef CAS.
- H. Song, M. Bringer, J. Tice, C. Gerdts and R. Ismagilov, Appl. Phys. Lett., 2003, 83, 4664–4666 CrossRef CAS.
- S. Torza and S. Mason, J. Colloid Interface Sci., 1970, 33, 67 CrossRef CAS.
- N. Pannacci, H. Bruus, D. Bartolo, I. Etchart, T. Lockhart, Y. Hennequin, H. Willaime and P. Tabeling, Phys. Rev. Lett., 2008, 101, 4.
- X. Z. Niu, B. Zhang, R. T. Marszalek, O. Ces, J. B. Edel, D. R. Klug and A. J. deMello, Chem. Commun., 2009, 6159–6161 RSC.
| This journal is © The Royal Society of Chemistry 2010 |
