Conducting polymer-coated thermally expandable microspheres†
H. E.
Cingil
a,
J. A.
Balmer
a,
S. P.
Armes
*a and
P. S.
Bain
b
aDepartment of Chemistry, University of Sheffield, Dainton Building. Sheffield, South Yorkshire S3 7HF, UK. E-mail: s.p.armes@sheffield.ac.uk
bDe-Bonding Ltd, 103 Rein Road, Tingley, West Yorkshire WF3 1JQ, UK
First published on 4th June 2010
Abstract
Thermally expandable microspheres (TEMs) consist of a copolymer shell encapsulating a liquid hydrocarbon core and expand irreversibly to many times their original volume on heating. In this work commercial TEMs with a mean diameter of approximately 13 µm were coated with either polypyrrole, polyaniline or poly(3,4-ethylenedioxythiophene) [PEDOT] at conducting polymer mass loadings of 0.1 to 1.5%. Laser diffraction showed that aqueous suspensions of these conducting polymer-coated TEMs were well-dispersed, indicating minimal particle aggregation. Scanning electron microscopy studies indicated that these TEMs have relatively rough surfaces both before and after coating with conducting polymer. Raman spectroscopy was very sensitive to the presence of conducting polymer and could be used to confirm the presence of polypyrrole at target mass loadings as low as 0.1 wt%. The presence of polypyrrole at the TEM surface was confirmed from the Cl/N atomic ratios determined by X-ray photoelectron spectroscopy. This technique allowed the polypyrrole-coated TEMs to be ranked correctly according to their targeted conducting polymer loadings. All the conducting polymer-coated TEMs were subjected to irradiation using a near-infrared lamp with a λmax of 1200 nm. Since conducting polymers absorb strongly in the near-infrared region, this leads to efficient localised heating of the coated TEMs. Thus the onset time required for the expansion of conducting polymer-coated TEMs under a given set of irradiation conditions is reduced significantly compared to control experiments conducted with uncoated TEMs (from 162 ± 2 seconds to 11 ± 1 seconds). For the polypyrrole-coated TEMs, systematic reduction of the target polypyrrole mass loading from 1.5 to 0.3% had surprisingly little effect on the observed onset times for volumetric expansion. Polypyrrole, polyaniline and PEDOT-coated TEMs all exhibited similar onset times (10 ± 1 seconds) when compared at the same mass loading (1.5%). However, EDOT is relatively expensive compared to pyrrole and polymerisation of the former monomer is substantially incomplete even at 50 °C. Moreover, aniline is significantly more toxic than pyrrole and its polymerisation requires a more expensive oxidant. Thus it is concluded that polypyrrole is the preferred conducting polymer for coating TEMs in order to optimise their thermo-responsive volumetric expansion behaviour.
Introduction
Thermally Expandable Microspheres (TEMs) consist of an impermeable copolymer shell comprising various comonomers such as vinylidene chloride, acrylonitrile, methacrylonitrile and methyl methacrylate surrounding a liquid hydrocarbon such as isobutane or isopentane. Volumetric expansion of TEMs occurs on heating to a certain critical temperature, which corresponds to both the boiling point of the encapsulated hydrocarbon and also the glass transition temperature (Tg) of the copolymer shell.1–3A volumetric expansion factor of up to sixty can be achieved for such TEMs, with a concomitant reduction in density from 1000 g L−1 to 30 g L−1.4 TEM expansion is an irreversible process; the particles remain enlarged on removing the heat source, although partial collapse typically occurs due to the loss of the hydrocarbon solvent from the core. TEM particles are graded according to their particle size, heat resistance, chemical and solvent resistance, and their characteristic expansion factor. Critical expansion temperatures can be varied from 80 to 190 °C and mean TEM diameters typically range from 6 µm to 90 µm. TEM particles can be used as blowing agents, as light-weight additives in the cable industry or for polyurethane coatings.5 More recent applications include the use of TEM particles for the controlled handling of nanolitre volumes in microfluidics applications.6
Schmid and co-workers7 recently reported that TEM particles can be covered with an ultrathin polypyrrole overlayer. This conducting polymer coating absorbs strongly in the near-infrared, causing rapid heating of the TEMs when irradiated using a commercial IR lamp with a peak output wavelength of 1200 nm. This allows rapid thermal expansion of the TEMs on demand, which may be convenient for the rapid removal of car glazing and various composite panels if end-of-lifetime recycling initiatives are adopted within the car manufacturing industry in the near future. Such efficient localised heating of polypyrrole-coated TEMs potentially offers several advantages over bulk thermal heating. Firstly, the time required to break the adhesive bond is significantly reduced, thus a greater throughput may be achieved. Secondly, cleaner delaminated surfaces are achieved. However, Schmid et al. examined only one type of conducting polymer (polypyrrole) and investigated just a single mass loading (1.5 wt%). In the present work, we seek to extend this preliminary study by (i) examining the effect of systematically varying the conducting polymer loading on the onset time for TEM expansion and (ii) comparing the performance of three different conducting polymers (polypyrrole [PPy], polyaniline [PANi] and poly(3,4-ethylenedioxythiophene) [PEDOT]), as IR-absorbing coatings for the localised heating of TEMs.
Experimental
Materials
TEM batch 551 DU 40 was obtained from AkzoNobel (Expancel division, Sweden). These TEMs are approximately 13 µm diameter and consist of an acrylonitrile/vinylidene chloride copolymer shell encapsulating isobutane with a critical volumetric expansion temperature of 98 °C. Pyrrole was purchased from BASF (Germany) and passed through a basic alumina column to remove the inhibitor prior to being stored at −25 °C before use. 3,4-Ethylenedioxythiophene (EDOT) was obtained from Bayer (Germany) and stored at 5 °C prior to use. Aniline hydrochloride, iron(III) trichloride hexahydrate and ammonium persulfate were purchased from Aldrich and used as received. Iron(III) tris(p-toluenesulfonate) was synthesised as described in the literature.8 De-ionised water obtained from an Elgastat Option 3A water purifier was used in all experiments. Methanol was purchased from Fisher Scientific and used as received.Synthesis of polypyrrole bulk powder
Iron(III) trichloride hexahydrate (9.10 g) was dissolved in de-ionised water (100 mL) in a 125 ml bottle with magnetic stirring at room temperature. The initial solution pH was measured using a pH meter. Purified pyrrole monomer (1.0 mL) was added to this solution, which turned black within a few minutes. After 4 h, the black precipitate was vacuum-filtered and washed with de-ionised water and methanol. The moist black powder was dried at room temperature in a vacuum desiccator overnight.Synthesis of polyaniline bulk powder
Ammonium persulfate (3.06 g) was dissolved in 100 mL de-ionised water in a 125 mL bottle with magnetic stirring at room temperature. After dissolution, aniline hydrochloride (1.39 g) was added to the reaction solution, which turned dark green. The dark green precipitate was vacuum-filtered after 4 h and washed with 1 M HCl. The moist dark green powder was dried at room temperature in a vacuum desiccator overnight.Synthesis of PEDOT bulk powder
Iron(III) tris(p-toluenesulfonate) (6.225 g) was dissolved in de-ionised water (46 mL) in a 100 mL round-bottomed flask equipped with a magnetic stirrer and an air condenser and heated to 50 °C. Then a mixture of EDOT (0.50 mL) and methanol (1.00 mL) was injected via syringe. The reaction solution was stirred at 250 rpm at 50 °C for 24 h. The dark blue PEDOT precipitate was centrifuged at 9000 rpm for 40 min and a 1 : 1 de-ionised water/methanol mixture was used to replace the supernatant. This process was repeated three times, and then successive supernatants were replaced with de-ionised water until a clear supernatant was obtained. The moist PEDOT precipitate was dried in a 50 °C oven overnight. A yield of 57% was obtained for this PEDOT bulk powder synthesis.Preparation of conducting polymer-coated TEMs
TEMs were coated using the three different conducting polymers at various mass loadings (see Fig. 1a for a schematic representation of the general coating protocol). | ||
| Fig. 1 (a) Schematic representation of the protocol used to coat thermally expandable microspheres (TEMs) with polypyrrole (PPy). (b) Digital photograph of sample bottles containing the uncoated TEMs and a series of PPy-coated TEMs prepared at 1.5–0.1 wt% PPy loadings. | ||
For the preparation of PPy-coated particles, TEMs (12.5 g) were suspended in de-ionised water (50 mL) in a 150 mL sample bottle by hand-shaking. Iron(III) trichloride hexahydrate (0.10–1.50 g) dissolved in 6.0 mL water was added to the aqueous TEM suspension. After mixing using a mechanical roller, pyrrole monomer (11.3–169.2 µL) was added using a micro-pipette. The amounts of oxidant and monomer were adjusted for each desired loading according to the data given in Table S1† but the oxidant/monomer molar ratio was held constant at 2.33 : 1 in each case. Mechanical rotation of the reaction solutions was continued for 22–24 h at room temperature. The resulting suspensions were vacuum-filtered and the coated TEMs were washed several times with de-ionised water before being transferred to a vacuum desiccator overnight to obtain a dry free-flowing powder.
A similar protocol was used for the preparation of PANi-coated particles. TEMs (12.5 g) were suspended in de-ionised water (50 mL) in a 150 mL sample bottle by hand-shaking. Ammonium persulfate (0.098–0.491 g) in 6.0 mL water was added to the aqueous TEM suspension. After mixing using a mechanical roller, aniline hydrochloride (0.045–0.223 g) was added (see Table S2† for a summary of the target polyaniline loadings) such that the oxidant/monomer ratio was held constant at 1.25 : 1 in each case. The reaction solutions were left on mechanical rollers for 22–24 h at room temperature. The resulting suspensions were vacuum-filtered and the coated TEMs were washed several times with 1 M HCl so as to avoid de-doping of the conducting polymer. The samples were then transferred to a vacuum desiccator overnight to obtain a dry free-flowing powder.
A single PEDOT target loading of 1.5 wt% was selected in order to compare this conducting polymer with both polypyrrole- and polyaniline-coated TEMs. In this case, the coating protocol was as follows. TEMs (12.5 g) were suspended in de-ionised water (17.5 mL) in a 30 mL sample bottle by hand-shaking. Iron(III) tris(p-toluene sulfonate) (2.47 g) was dissolved in 19 mL de-ionised water in a 100 mL round-bottomed flask equipped with a magnetic stirrer and the TEM suspension was added to this flask. The reaction flask was equipped with an air condenser and transferred to a preheated 50 °C oil bath. After 20 min, EDOT (131.78 µL) dissolved in methanol (1.0 mL) was injected via syringe. The reaction solution gradually turned dark blue and was stirred at 250 rpm at 50 °C for 24 h. This temperature was selected in order to prevent TEM expansion during the coating process. It is somewhat lower than that used by Khan and Armes9 (who reported a 75% PEDOT yield after 24 h at 85 °C) and hence a correspondingly lower PEDOT bulk powder yield (57%) was obtained within the same time period.
Particle size analysis by laser diffraction
Particle size analysis by laser diffraction was achieved using a Malvern Mastersizer 2000 instrument equipped with a ‘small volume’ (ca. 50 mL) Hydro2000SM sample dispersion unit, a HeNe laser operating at 633 nm, and a solid-state blue laser source operating at 466 nm. The dispersion unit was filled with de-ionised water. A background scan was taken in order to perform corrections for background electrical noise or any contaminants in the continuous phase. A few drops of the TEM dispersions were then added to the dispersion unit in order to obtain a laser obscuration of approximately 3%. The stirring rate was set to 1500 rpm in order to achieve uniform dispersion. A mean particle diameter was calculated from a series of six measurements taken over the course of ten seconds.Vibrational spectroscopy
FT-IR spectra were recorded using a Thermo Scientific Nicolet iS10 FT-IR spectrometer using OMNIC Spectra software (32 scans, 4 cm−1 resolution) within the range 4000 cm−1 to 400 cm−1. KBr discs were prepared using a pellet press. Raman spectra (10 scans per spectrum) were recorded using a Renishaw Raman Imaging Microscope combined with a Leica microscope equipped with an objective lens of ×50 magnification. The Raman source was a He–Ne laser operating at 632.8 nm and 15 mW. Dried samples were dispersed in a 5 wt% gelatin solution and then spin-coated onto microscope slides for analysis.Scanning electron microscopy
Scanning electron microscopy images of coated and uncoated TEMs were obtained using a FEI Inspect field emission instrument operating at 10 kV. Carbon tape was used to place the sample onto an aluminium stub before sputter-coating with a thin layer of gold in order to minimise sample-charging problems.X-Ray photoelectron spectroscopy
A Kratos Axis Ultra DLD X-ray photoelectron spectrometer operating at a base pressure of ∼10−8 Torr was used for XPS analysis. A monochromatic Al X-ray source (10.0 mA, 15 kV) was used with a step size of 1.0 eV for the survey spectra (pass energy = 160 eV) and 0.1 eV for the core-line spectra (pass energy = 20 eV). Samples were prepared by pressing dry powders into indium foil.Hot-stage optical microscopy
Optical microscopy studies were conducted using an Olympus BX50 optical microscope equipped with both a Linkam heating stage and a PC-controlled Hitachi CCD camera in order to examine whether the presence of the conductive polymer overlayer retarded the bulk thermal expansion of the coated TEMs. Each sample was heated from room temperature at a heating rate of 5 °C min−1 and digital images were recorded every 5 seconds for 8 min once a temperature of 70 °C had been attained.Infrared lamp irradiation experiments
The IR lamp set-up was designed to provide relatively uniform irradiation of the TEMs inside the test tube (see Fig. S1 in ESI†). The experimental set-up consisted of a base and vertical surround, which were both wrapped with aluminium foil to enable efficient reflection of infrared radiation onto the test tube, and an infrared lamp (Trisk UK ETS221d; 3.3 kW; maximum absorption wavelength, λmax, occurs at approximately 1200 nm) placed at a distance of 10 cm from the test tube. This optimal distance was determined empirically after initial experiments conducted at closer distances led to substantial sample charring, which prevented accurate estimation of the total expansion time required for volumetric expansion of the TEMs. In each experiment, a single test tube containing dried TEMs (0.70 g) was placed within the middle of the base in a fixed position relative to the IR lamp. In situ expansion of the TEM particles led to an easily visualised increase in sample volume. The onset and total expansion times were recorded with a stopwatch, and the experiment was repeated at least three times for each sample in order to ensure reliability and reproducibility.Results and discussion
Preparation of conducting polymer-coated TEMs
PPy-, PANi- and PEDOT-coated TEMs were successfully prepared by in situ deposition from aqueous solution. A range of PPy loadings between 0.1 and 1.5 wt% were targeted in order to examine the effect of polymer content on volumetric expansion of the TEMs under IR irradiation. Fig. 1b shows a digital photograph of a series of sample bottles containing the uncoated TEMs and a range of PPy-coated TEMs at different PPy loadings. The 1.5 wt% PPy-coated TEMs exhibit the characteristic black colour of PPy, thus indicating its presence as a coating. As the targeted PPy loading is reduced, the black colour becomes less intense, becoming grey at lower loadings (see Fig. 1b). In the case of PANi-coated TEMs, four different PANi loadings were targeted in order to compare with selected PPy-coated TEMs. The 1.5 wt% PANi-coated TEM sample was dark green, whereas the lowest loading (0.3 wt%) was significantly lighter in colour. A single sample of 1.5 wt% PEDOT-coated TEMs exhibited the dark blue colour that is characteristic of PEDOT. It should be noted that the targeted PPy and PANi loadings assume 100% monomer conversion and 100% deposition in each case. There is good literature precedent to suggest that both these approximations are reasonable.10,11 However, the PEDOT bulk powder yield was substantially less than 100% at 50 °C (typically 57%), so the amounts of monomer and oxidant were increased accordingly in order to ensure a 1.5 wt% PEDOT loading.Particle size analysis
The dry conducting polymer-coated TEM powders were redispersed in water for particle size analysis in order to examine whether the conducting polymer coating caused any agglomeration. The volume-average mean diameter of the uncoated TEMs was 12.3 ± 4.1 µm, which is within the range of 10–16 µm stated by the manufacturer. Fig. 2a shows the particle size distributions obtained for various PPy-loaded TEMs. Clearly, the volume-average mean diameters of the PPy-coated TEMs (for example, 12.8 ± 4.2 µm for the 1.5 wt% PPy-coated TEMs) are comparable to those of the uncoated TEMs, indicating a relatively high degree of dispersion (minimal agglomeration). Laser diffraction particle size distributions obtained for the PPy-coated TEMs, the PANi-coated TEMs and the PEDOT-coated TEMs at a fixed conducting polymer loading of 1.5 wt% also confirm little or no change in mean diameter (see Fig. 2b). In summary, coating TEM particles with these three conductive polymers does not seem to lead to a significant change in the particle size distribution of the resulting dilute aqueous suspensions, suggesting minimal aggregation of the primary particles. | ||
| Fig. 2 Laser diffraction particle size distributions obtained for dilute aqueous suspensions of (a) uncoated TEMs compared with PPy-coated TEMs prepared at varying PPy loadings and (b) uncoated TEMs compared with PPy, PANi- and PEDOT-coated TEMs prepared at a fixed 1.5% conducting polymer loading. | ||
Scanning electron microscopy
Field emission scanning electron microscopy (FE-SEM) was used to investigate the particle size and surface morphology. According to Schmid et al.7 scanning electron microscopy images of PPy-coated TEMs revealed a rougher surface than the uncoated TEMs, due to the relatively non-uniform PPy overlayer. However, high resolution FE-SEM images of uncoated TEMs reveal that the pristine particles have a relatively rough surface morphology, see Fig. 3. None of the conducting polymer-coated TEMs exhibited significant morphological differences compared to the uncoated TEMs, thus unfortunately FE-SEM cannot be used to confirm the presence of the conducting polymer overlayer, at least for the particular TEM batch used in the current study. | ||
| Fig. 3 Scanning electron micrographs obtained for: (a) uncoated TEMs, (b) polypyrrole (PPy) bulk powder, (c) 1.5 wt% PPy-coated TEMs at high magnification and (d) 1.5 wt% PPy-coated TEMs at lower magnification. | ||
Nevertheless, lower magnification FE-SEM images can still be used to obtain an approximate mean particle diameter for the TEM particles. The approximate number-average particle diameters calculated from the SEM images of 1.5 wt% PPy-loaded TEMs and 0.1 wt% PPy-loaded TEMs were 10.8 µm and 11.4 µm, respectively. These diameters are quite close to the manufacturer's size specification, but are understandably somewhat smaller than the volume-average diameters indicated by laser diffraction due to the effect of polydispersity. The latter technique typically analyses many more particles than can be conveniently sampled by FE-SEM, which leads to more reliable size distributions and mean diameters.
FT-IR spectroscopy
FT-IR spectra were recorded to obtain spectroscopic evidence for the presence of all three conducting polymer coatings on the TEMs. The IR spectrum recorded for PPy bulk powder is in good agreement with literature spectra.10 Characteristic IR bands were observed at 1538 cm−1 and 1435 cm−1 (PPy ring vibrations), 1305 cm−1 and 1040 cm−1 (![[double bond, length as m-dash]](https://www.rsc.org/images/entities/char_e001.gif) C–H in-plane vibrations), 1180 cm−1 (N–C stretching) and 900 cm−1 (C–H out-of-plane vibrations). The TEM particles exhibit strong absorption bands between 1000 and 1400 cm−1. Thus the two PPy bands that are most useful in this study are at 900 and 1550 cm−1 (see dashed lines in Fig. 4). These two distinctive polypyrrole bands were clearly observed in the PPy-coated TEM spectra at loadings of 0.5 wt% PPy or above.
C–H in-plane vibrations), 1180 cm−1 (N–C stretching) and 900 cm−1 (C–H out-of-plane vibrations). The TEM particles exhibit strong absorption bands between 1000 and 1400 cm−1. Thus the two PPy bands that are most useful in this study are at 900 and 1550 cm−1 (see dashed lines in Fig. 4). These two distinctive polypyrrole bands were clearly observed in the PPy-coated TEM spectra at loadings of 0.5 wt% PPy or above.
 | ||
| Fig. 4 FT-IR spectra recorded for: (a) uncoated TEMs, (b) 0.5 wt% PPy-coated TEMs, (c) 1.0 wt% PPy-coated TEMs, (d) 1.5 wt% PPy-coated TEMs and (e) PPy bulk powder. | ||
FT-IR spectra were also recorded for PANi and PEDOT bulk powders and for PANi- and PEDOT-coated TEMs. However, unlike for PPy-coated TEMs, there were no unique IR bands that could be used to confirm the presence of the conducting polymer coating on the TEM surface (data not shown).
Raman spectroscopy
Raman spectra were recorded because our previous experience indicated that this technique should be more sensitive than FT-IR spectroscopy for the lower conducting polymer loadings.12,13Fig. 5 shows the Raman spectrum recorded for the uncoated TEM particles (see spectrum ‘a’). The expected characteristic bands are observed at 2250 cm−1 (C![[triple bond, length as m-dash]](https://www.rsc.org/images/entities/char_e002.gif) N stretch due to the acrylonitrile comonomer) and 2800–3000 cm−1 (aliphatic C–H stretch). The extensively conjugated, highly absorbing nature of the metallic-like conducting polymer chains gives rise to a very strong resonance Raman effect for PPy bulk powder,12,14 which is clearly evident in spectrum ‘f’. Raman bands were previously assigned by Vigmond et al.15 as 1575 cm−1 (CC stretch), 1350 cm−1 (C–C stretch), 1040 cm−1 (C–H deformation), and 900–1000 cm−1 (C–H out-of-plane deformation). These characteristic PPy features are also evident in the Raman spectra of each of the PPy-coated TEMs (see Fig. 5b–e), which are remarkably dominated by the minor conducting polymer component due to the resonance Raman effect.14 Although Raman bands due to the underlying TEM particles finally become prominent in these spectra at the lowest PPy loadings, characteristic bands due to the conducting polymer at 1575 cm−1 can still be distinguished even for 0.1 wt% PPy-coated TEMs. Closer inspection confirms that the PPy band at 1575 cm−1 becomes less intense relative to the TEM bands at 2250 cm−1 and 2800–3000 cm−1 as the targeted PPy loading is reduced, as expected. Thus Raman spectroscopy allows the PPy-coated TEM samples to be ranked according to their PPy loadings, although quantification of the actual conducting polymer content is not possible using this technique due to the strongly non-linear nature of the resonance Raman effect. A good-quality Raman spectrum (not shown) was also obtained for the PANi-coated TEM particles, with characteristic bands observed at 1595 cm−1 (CC stretch), 1469 cm−1 (CN stretch), 1332 cm−1 (C–N+ stretch), 1221 cm−1 (C–N stretch), 1163 cm−1 (C–H in-plane bending), 809 cm−1 (C–H deformation), 747 cm−1 (quinonoid ring deformation), 577 cm−1 (benzenoid ring deformation), and 414 cm−1 (C–N–C torsion). Unfortunately, in this case it was not possible to obtain a good-quality reference spectrum for PANi bulk powder. Nevertheless, comparison with appropriate literature spectra16 confirmed that the conducting polymer component again dominated the spectrum.
N stretch due to the acrylonitrile comonomer) and 2800–3000 cm−1 (aliphatic C–H stretch). The extensively conjugated, highly absorbing nature of the metallic-like conducting polymer chains gives rise to a very strong resonance Raman effect for PPy bulk powder,12,14 which is clearly evident in spectrum ‘f’. Raman bands were previously assigned by Vigmond et al.15 as 1575 cm−1 (CC stretch), 1350 cm−1 (C–C stretch), 1040 cm−1 (C–H deformation), and 900–1000 cm−1 (C–H out-of-plane deformation). These characteristic PPy features are also evident in the Raman spectra of each of the PPy-coated TEMs (see Fig. 5b–e), which are remarkably dominated by the minor conducting polymer component due to the resonance Raman effect.14 Although Raman bands due to the underlying TEM particles finally become prominent in these spectra at the lowest PPy loadings, characteristic bands due to the conducting polymer at 1575 cm−1 can still be distinguished even for 0.1 wt% PPy-coated TEMs. Closer inspection confirms that the PPy band at 1575 cm−1 becomes less intense relative to the TEM bands at 2250 cm−1 and 2800–3000 cm−1 as the targeted PPy loading is reduced, as expected. Thus Raman spectroscopy allows the PPy-coated TEM samples to be ranked according to their PPy loadings, although quantification of the actual conducting polymer content is not possible using this technique due to the strongly non-linear nature of the resonance Raman effect. A good-quality Raman spectrum (not shown) was also obtained for the PANi-coated TEM particles, with characteristic bands observed at 1595 cm−1 (CC stretch), 1469 cm−1 (CN stretch), 1332 cm−1 (C–N+ stretch), 1221 cm−1 (C–N stretch), 1163 cm−1 (C–H in-plane bending), 809 cm−1 (C–H deformation), 747 cm−1 (quinonoid ring deformation), 577 cm−1 (benzenoid ring deformation), and 414 cm−1 (C–N–C torsion). Unfortunately, in this case it was not possible to obtain a good-quality reference spectrum for PANi bulk powder. Nevertheless, comparison with appropriate literature spectra16 confirmed that the conducting polymer component again dominated the spectrum.
 | ||
| Fig. 5 Raman spectra recorded for: (a) uncoated TEMs, (b) 0.1 wt% PPy-coated TEMs, (c) 0.2 wt% PPy-coated TEMs, (d) 0.5 wt% PPy-coated TEMs, (e) 1.5 wt% PPy-coated TEMs and (f) PPy bulk powder. | ||
The Raman spectrum recorded for PEDOT bulk powder also agrees well with literature data (see Fig. 6).17 In contrast to the Raman spectra observed for PPy and PANi bulk powders, the PEDOT spectrum gave more prominent bands that were relatively free from background fluorescence. The intense band at 1424 cm−1 is assigned to the symmetric CαCβ stretching band. An asymmetric CαCβ stretching band and a Cβ–Cβ stretching band are also observed at 1507 and 1366 cm−1, respectively. The band at 1263 cm−1 is attributed to Cα–Cα (inter-ring) stretching. Various deformation bands are observed below 1100 cm−1, including the C–O–C deformation at 1096 cm−1, oxyethylene ring deformation at 984 and 569 cm−1, and a symmetric C–S–C deformation at 695 cm−1. In the Raman spectrum recorded for the 1.5 wt% PEDOT-coated TEMs, each of these characteristic PEDOT bands are observed, alongside bands arising from the underlying TEM particles (see Fig. 6).
 | ||
| Fig. 6 Raman spectra recorded for (a) uncoated TEMs, (b) 1.5 wt% PEDOT-coated TEMs and (c) PEDOT bulk powder. | ||
In summary, Raman spectroscopy is much more sensitive than FT-IR for the analysis of conducting polymer-coated TEMs. The former technique confirms the presence of PANi and PEDOT coatings and is also able to confirm the presence of PPy chains at loadings as low as 0.1 wt%.
X-Ray photoelectron spectroscopy
X-Ray photoelectron spectroscopy (XPS) studies were conducted in order to obtain surface compositional data before and after coating TEMs with either PPy or PANi. Firstly, XPS spectra were recorded for the PPy bulk powder and the uncoated TEM particles. Unfortunately, the Cl2p and N1s signals, which can often be used as unique elemental markers for PPy,18 were also present in the spectrum obtained for the uncoated TEMs, since the copolymer shell comprises nitrogen-based acrylonitrile and chlorine-based vinylidene chloride comonomers. As a result, these XPS signals could not be used as unique elemental markers for the presence of PPy. Similar problems were encountered for the X-ray photoelectron spectra recorded for the PANi-coated TEMs (data not shown). It is perhaps also noteworthy that the two Si signals observed for the uncoated TEMs are not due to surface contamination, but instead indicate that silica particles were used as a Pickering emulsifier by the manufacturer in the synthesis of the pristine TEM particles via interfacial copolymerisation.Fortunately, the Cl/N atomic ratio19 can provide useful information regarding the PPy surface coverage of the PPy-coated TEMs. Qualitative confirmation of this hypothesis can be obtained from close inspection of Fig. 7. In the case of PPy bulk powder, the N1s signal at ∼400 eV is more intense than the Cl2p signal at ∼200 eV. In contrast, the Cl2p signal is more intense than the N1s signal in the spectrum recorded for uncoated TEM particles, while these two signals are of comparable intensities in the spectrum obtained for the 1.5% PPy-coated TEM sample. For PPy bulk powder alone, the Cl/N atomic ratio should be approximately 0.33, as there should be on average one chloride anion for every three polymerised pyrrole repeat units.20 However, in the present study a slightly higher Cl/N atomic ratio of 0.43 was observed, which may indicate some degree of over-oxidation. This hypothesis is supported by the presence of a weak carbonyl band at approximately 1700 cm−1 in the FT-IR spectrum of PPy bulk powder (see Fig. 4).21 For the series of PPy-coated TEMs, the calculated Cl/N atomic ratios decrease monotonically for higher polypyrrole loadings, thus indicating thicker and/or more uniform PPy coatings (see Table 1).
 | ||
| Fig. 7 XPS survey spectra recorded for: (a) uncoated TEMs, (b) PPy bulk powder and (c) 1.5 wt% PPy-loaded TEMs. | ||
| Sample | Cl Atom (%) | N Atom (%) | Cl/N Ratio (±0.1) |
|---|---|---|---|
| PPy Bulk powder | 6.6 | 15.6 | 0.4 |
| Uncoated TEM | 11.4 | 5.4 | 2.1 |
| 0.1 wt% PPy | 9.7 | 5.0 | 1.9 |
| 0.2 wt% PPy | 10.1 | 4.6 | 2.2 |
| 0.3 wt% PPy | 8.9 | 4.7 | 1.9 |
| 0.4 wt% PPy | 8.8 | 5.3 | 1.7 |
| 0.5 wt% PPy | 8.0 | 6.5 | 1.2 |
| 1.0 wt% PPy | 7.8 | 6.4 | 1.1 |
| 1.5 wt% PPy | 7.3 | 7.4 | 1.0 |
Cl2p core-line spectra were also examined to identify a suitable sub-peak that would confirm the presence of the conducting polymer on the surface of the coated TEMs (Fig. 8). Even though Cl is present in both the uncoated TEMs and PPy bulk powder, the covalent chlorine (i.e. C–Cl) species due to the vinylidene chloride comonomer in the TEM can be readily differentiated from the anionic chloride dopant anion that is characteristic of PPy. The ionic Cl signal at ∼196.8 eV (see spectrum ‘b’) due to the conducting polymer component was clearly observed in the Cl2p core-line spectra recorded for PPy-loaded TEMs at PPy loadings of 1.0 and 1.5% (see spectra ‘c’ and ‘d’). However, this characteristic signal is no longer detected at lower loadings (e.g. 0.5% and 0.1% PPy; see spectra ‘e’ and ‘f’) and the Cl2p spectrum becomes entirely dominated by the covalent chlorine species.
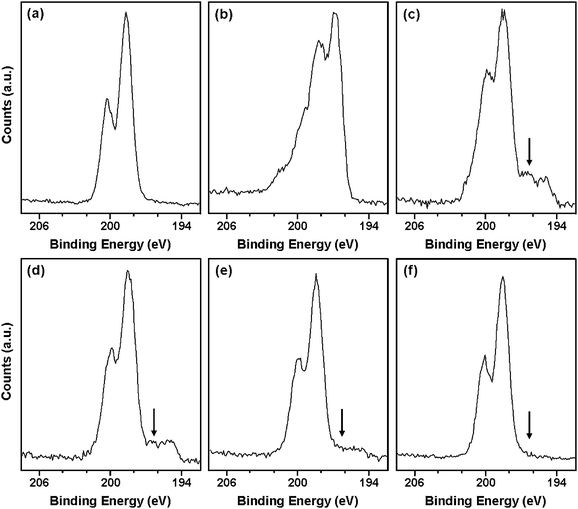 | ||
| Fig. 8 XPS Cl2p core-line spectra recorded for: (a) uncoated TEMs, (b) PPy bulk powder, (c) 1.5 wt% PPy-coated TEMs, (d) 1.0 wt% PPy-coated TEMs, (e) 0.5 wt% PPy-coated TEMs and (f) 0.1 wt% PPy-coated TEMs. | ||
Hot-stage optical microscopy
Hot-stage optical microscopy studies of the uncoated TEMs and both PPy- and PANi-coated TEMs at different loadings confirmed that, in all cases, the particles begin to expand to many times their original volume at approximately the same characteristic temperature of 98 °C. These results agree well with the findings of Schmid et al.,7 who reported that the onset temperature for TEM expansion was not affected by the conductive polymer overlayer during conventional bulk heating for a 1.5 wt% PPy loading.Infrared lamp irradiation experiments
Infrared radiation can be used to trigger efficient volumetric expansion of the TEMs. In previous work by Schmid et al.7 it was shown that a 1.5 wt% PPy loading substantially reduced the irradiation time required for TEM expansion. This is presumably due to enhanced localised IR absorption by the conducting polymer overlayer, which has a broad absorption maximum at around 900–1100 nm.22,23 In the present study, the effect of systematically varying the PPy loading was examined and the PPy, PANi and PEDOT coatings were also compared at a fixed mass loading of 1.5% (see Table 2). The characteristic onset time is defined as the time at which expansion of the TEM particles is first observed visually, and the total expansion time represents the time after which no further expansion occurs. However, in our experimental set-up (see Fig. S1 in the ESI†), the radiation-induced volumetric expansion was often accompanied by some degree of burning or charring of the TEM particles. This problem was more pronounced for the uncoated TEMs and thus the total expansion time for such samples was more difficult to determine precisely.| Conducting polymer coating | Loading (wt%) | Mean onset time for expansion/s | Mean total expansion time/s |
|---|---|---|---|
| PPy | 1.5 | 11 ± 1 | 101 ± 1 |
| 1.0 | 10 ± 1 | 101 ± 3 | |
| 0.5 | 11 ± 1 | 108 ± 8 | |
| 0.4 | 12 ± 1 | 125 ± 5 | |
| 0.3 | 11 ± 1 | 122 ± 2 | |
| 0.2 | 13 ± 1 | 126 ± 3 | |
| 0.1 | 18 ± 1 | 145 ± 8 | |
| PANi | 1.5 | 9 ± 1 | 85 ± 4 |
| 1.0 | 11 ± 1 | 109 ± 7 | |
| 0.5 | 12 ± 1 | 110 ± 2 | |
| 0.3 | 12 ± 1 | 120 ± 3 | |
| PEDOT | 1.5 | 10 ± 1 | 84 ± 6 |
| Uncoated TEMs | 0.0 | 162 ± 2 | 360 ± 5 |
IR lamp irradiation experiments conducted on the series of PPy-coated TEMs showed that onset times for TEM expansion were very similar (11 ± 1 s) at or above 0.3 wt% PPy loading. This characteristic onset time is slightly higher for the 0.2 wt% PPy-coated TEMs, and increased further (to 18 ± 1 s) for a 0.1 wt% PPy coating. Nevertheless, all these PPy-coated TEM onset times are significantly faster than the baseline onset time of 162 ± 2 s observed for the uncoated TEMs. Total expansion times follow the same trend: the uncoated TEMs take up to 360 s to achieve complete expansion, whereas only approximately 100 s is required for the 1.5 wt% PPy-coated TEMs. These observations are potentially significant for recycling applications, since a relatively low PPy loading can reduce the overall irradiation time required for TEM expansion by at least a factor of approximately three without noticeable loss of performance. Thus significantly faster throughput could be achieved in recycling applications.
A direct comparison between three PPy-, PANi- and PEDOT-coated TEMs (each prepared at a fixed conducting polymer mass loading of 1.5%) revealed that onset expansion times were very similar (see Table 2). Total expansion times were perhaps slightly faster for the PANi and PEDOT coatings than that achieved for the PPy coatings, but this effect is close to the experimental uncertainty associated with the in situ charring of the TEM particles after prolonged exposure to the IR irradiation. The effect of varying the conducting polymer loading was also assessed for the series of four PANi-coated TEMs: expansion onset times were comparable for the 1.5 wt%, 1.0 wt%, 0.5 wt% and 0.3 wt% loadings. These findings are broadly similar to those observed for PPy-coated TEMs.
In summary, it is clear that conducting polymer-coated TEMs expand significantly faster upon exposure to IR radiation compared to uncoated TEMs. EDOT monomer is relatively expensive compared to pyrrole and polymerisation of the former monomer is substantially incomplete even at 50 °C. Moreover, aniline is more toxic than pyrrole, and the oxidant required to polymerise the former monomer is significantly more expensive than that required for the latter. Thus polypyrrole is most likely to be the preferred conducting polymer for coating TEMs in order to optimise their thermo-responsive volumetric expansion behaviour for recycling applications.
Conclusions
A series of polypyrrole-, polyaniline- and PEDOT-coated TEMs at various conducting polymer loadings were successfully prepared by in situ deposition from aqueous solution. Particle size analyses show that these conducting polymer overlayers did not result in significant aggregation of the TEMs. Unfortunately, the surface morphology of the uncoated TEMs was too rough to allow positive visual identification of the deposited conducting polymer overlayers. However, images taken at low magnification could be used to estimate the mean TEM particle diameter, which was in reasonably good agreement with that determined from laser diffraction. FT-IR spectroscopy proved to be rather ineffective for characterising coated TEMs with low conducting polymer loadings due to a lack of sensitivity. Nevertheless, the presence of the conducting polymer component could be identified for PPy-coated TEMs containing more than 0.5 wt% PPy. Raman spectroscopy proved to be much more useful: even 0.1 wt% PPy-coated TEMs exhibited Raman signals that were attributable to the conducting polymer component. The intensities of the conducting polymer Raman bands relative to the TEM Raman bands for the PPy-coated TEM series correlated with the rank order expected from the targeted mass PPy loadings. The surface compositions of these polypyrrole-coated TEMs were assessed by XPS. Although there were no unique elemental markers for either the conducting polymer overlayer or the underlying TEM, the Cl/N surface atomic ratio calculated using XPS could be correlated with the target conducting polymer loading used to prepare the polypyrrole-coated TEMs. Moreover, close inspection of the Cl2p core-line spectra allows the covalent chlorine (i.e. C–Cl) species due to the vinylidene chloride comonomer in the TEM to be differentiated from the anionic chloride dopant anion found in polypyrrole. Thus XPS, Raman and visual inspection (colour intensity) could each be used to rank the polypyrrole-coated TEMs in terms of their conducting polymer loadings. However, it was not possible to determine the precise amount of conducting polymer deposited for each target loading. Hot-stage optical microscopy studies confirmed that the dramatic volumetric change observed for the TEMs at their critical thermal expansion temperature of 98 °C is not affected by the presence of the conducting polymer overlayer, even at the highest loading. Infrared lamp irradiation experiments were conducted to compare the relative performance of PPy-, PANi- and PEDOT-coated TEMs. Volumetric expansion of conducting polymer-coated TEMs invariably occurred on much shorter time scales than that of uncoated TEMs. The conducting polymer coating absorbs strongly in the near-infrared region, causing efficient localised heating of the TEMs when irradiated using a commercial IR lamp. Moreover, PPy appears to be the most appropriate TEM coating, since good performance was achieved even at loadings as low as 0.3 wt%. The performance of PEDOT and PANi overlayers appears to be comparable to PPy at similar loadings. However, pyrrole is significantly cheaper than EDOT and much less toxic than aniline. Moreover, the deposition protocol for polypyrrole on the TEMs is much more efficient than for PEDOT, and the chemical oxidant required for pyrrole polymerisation is very cheap. Thus polypyrrole appears to be the optimum coating for the production of TEM particles with rapid thermo-responsive behaviour.Acknowledgements
De-Bonding Ltd is thanked for partial financial support of this work. JAB thanks AkzoNobel for an Industrial CASE EPSRC PhD studentship. Pete Bailey is thanked for assistance with the IR lamp irradiation experiments.References
-
D. S. Morehouse and R. J. Tetreault, US Pat., 3
![[thin space (1/6-em)]](https://www.rsc.org/images/entities/char_2009.gif) 615972, 1971.
615972, 1971. -
(a)
W. E. Cohrs, R. E. Gunderman and W. A. Crozier, US Pat., 4016110, 1977;
(b)
J. L. Garner, US Pat., 3945956, 1976.
-
(a)
A. Kron, P. Sjögren and O. Bjerke, US Pat., 6509384, 2003;
(b)
O. Nordin, H. Strom, C. Nyholm and C. Hammer, US Pat., 2007/0208093 A1, 2007;
(c) M. Jonsson, O. Nordin, E. Malmstrom, C. Nyholm and C. Hammer, Polymer, 2006, 47, 3015.
- Expancel® Microspheres: An Introduction, Expancel, AkzoNobel, Sundsvall, Sweden, 2005 Search PubMed.
- Expancel, AkzoNobel, www.akzonobel.com/expancel, accessed February 2010.
- P. Griss, H. Andersson and G. Stemme, Lab Chip, 2002, 2, 117 RSC.
- A. Schmid, L. R. Sutton, S. P. Armes, P. S. Bain and G. Manfrè, Soft Matter, 2009, 5, 407 RSC.
- J. A. Walker, L. F. Warren and E. F. Witucki, J. Polym. Sci., Part A: Polym. Chem., 1988, 26, 1285 CrossRef CAS.
- M. A. Khan and S. P. Armes, Langmuir, 1999, 15, 3469 CrossRef CAS.
- S. F. Lascelles and S. P. Armes, J. Mater. Chem., 1997, 7, 1339 RSC.
- C. Barthet, S. F. Lascelles, H. M. E. Stanley, S. P. Armes and S. Y. Luk, Langmuir, 1998, 14, 2032 CrossRef.
- S. F. Lascelles, S. P. Armes, P. Zhdan, S. J. Greaves, A. M. Brown, J. F. Watts, S. R. Leadley and S. Y. Luk, J. Mater. Chem., 1997, 7, 1349 RSC.
- C. Barthet, S. P. Armes, C. Bilem, M. M. Chehimi and M. Omastova, Langmuir, 1998, 14, 5032 CrossRef CAS.
- J. Ormond-Prout, D. Dupin, S. P. Armes, N. J. Foster and M. J. Burchell, J. Mater. Chem., 2009, 19, 1433 RSC.
- S. J. Vigmond, V. Ghaemmaghami and M. Thompson, Can. J. Chem., 1995, 73, 1711 CAS.
- G. Ćirić-Marjanović, M. Trchová and J. Stejskal, J. Raman Spectrosc., 2008, 39, 1375 CrossRef CAS.
- W. W. Chiu, J. Travaš-Sejdić, R. P. Cooney and G. A. Bowmaker, J. Raman Spectrosc., 2006, 37, 1354 CrossRef CAS.
- S. Maeda, M. Gill, S. P. Armes and I. W. Fletcher, Langmuir, 1995, 11, 1899 CrossRef CAS.
- XPS signals typically have associated experimental errors of 5–10%, therefore the Cl/N atomic ratios are quoted with an estimated overall uncertainty of ±0.1.
- S. P. Armes, Synth. Met., 1987, 20, 365 CrossRef CAS.
- S. Maeda and S. P. Armes, J. Mater. Chem., 1994, 4, 935 RSC.
- (a) J. Y. Lee, D. Y. Kim and C. Y. Kim, Synth. Met., 1995, 74, 103 CrossRef; (b) J. K. Avlyanov, H. H. Kuhn, J. Y. Josefowicz and A. G. MacDiarmid, Synth. Met., 1997, 84, 153 CrossRef CAS.
- F. Li, M. A. Winnik, A. Matvienko and A. Mandelis, J. Mater. Chem., 2007, 17, 4309 RSC.
Footnote |
| † Electronic supplementary information (ESI) available: Full details of TEM coating formulations; schematic diagram of IR lamp set-up. See DOI: 10.1039/c0py00108b |
| This journal is © The Royal Society of Chemistry 2010 |