Modification of bone-like apatite nanoparticle size and growth kinetics by alizarin red S
Casper Jon Steenberg
Ibsen
and
Henrik
Birkedal
*
Department of Chemistry and Interdisciplinary Nanoscience Center (iNANO), Aarhus University, 140 Langelandsgade, DK-8000, Aarhus C, Denmark. E-mail: hbirkedal@chem.au.dk
First published on 7th October 2010
Abstract
The formation of nanocrystals in biomineralization such as in bone occurs under the influence of organic molecules. Prompted by this fact, the effect of alizarin red S, a dye used in in vivo bone labeling methods, on bone-like carbonated apatite nanocrystal formation was investigated as a function of alizarin red S additive concentration. The obtained nanoparticles were investigated by powder X-ray diffraction (XRD), FTIR as well thermogravimetric analysis (TGA) and differential scanning calorimetry (DSC) while the kinetics of nanoparticle formation was investigated by in situ pH and synchrotron XRD measurements. Increasing alizarin red S concentration lead to amorphous particles over a threshold concentration and to smaller crystallites in a dose-dependent fashion. Alizarin red S induced a macroscopic lattice strain that scaled linearly with the alizarin red S concentration; this effect is reminiscent of that seen in biogenic calcium carbonates. TGA showed that the amorphous particles contained significantly more water than the crystalline samples and the DSC data showed that crystallization occurs after loss of most of the included organic material. The in situ studies showed that the formation of apatite goes via the very rapid formation of an amorphous precursor that after a certain nucleation time crystallizes into apatite. This nucleation time increased exponentially with alizarin red S concentration showing that this additive strongly stabilizes the amorphous precursor phase.
Introduction
In biomineralization, crystallization of inorganic minerals takes place under the influence of range of controlling factors.1 One of these is additives that interact with the forming mineral phase and/or changes the activity of the participating ions through complexation of cations. In bone the mineral phase is carbonated apatite nanoparticles that, together with collagen type I, water and a sleuth of noncollagenous proteins, is the building block of the complex hierarchical structure that is bone.2 In vertebrate apatite mineralization, phosphorylated proteins appear to participate in controlling apatite nucleation, growth and inhibition.3 There is an ongoing debate in the literature of which factors govern nanocrystal formation in bone mineralization. One of the hotly debated issues is through which intermediates the mineral phase is formed: an amorphous precursor (or very poorly crystalline apatitic phase), which is turned into apatite through dissolution/reprecipitation or phase transformation, or a crystalline intermediate such as octacalcium phosphate.4 This is a thorny issue in part because of the great difficulty in experimentally establishing the true nature of the first formed mineral deposits.4b Most recently, zebrafish fin bony rays, that grow continuously and thus can be used as a model displaying all time points in a single sample, were shown to contain granules of amorphous calcium phosphate (ACP) that transformed into apatite upon maturation.5In the present paper we investigate the influence of Alizarin Red S (ARS), Figure 1A, on apatite mineralization to shed more light on the factors governing apatite formation. ARS is a dye molecule that is used to label Ca-rich material in histological investigations6 and as an in vivo label in animal experimentation for an example of the latter see reference 7. It is a catechol sulfonate, see Figure 1, and we use this molecule as a chelating active agent that is charged over the relevant pH ranges in a manner not unlike phosphorylated proteins. ARS binds strongly to preformed apatite and can displace phosphate leading to Ca-ARS deposits.8 FTIR investigations of ARS adsorbed to preformed hydroxylapatite crystals indicates that ARS binds to calcium in apatite by the two catechol oxygens and not via the sulfonic acid group;9 this mode of binding is also observed in Pb(II)-exchanged hydroxylapatite but for Fe(III)-exchanged hydroxylapatite the binding mode involves a resonance stabilized form involving one of the central ring carbonyls and one of the catechol OH groups.10 ARS has also been found, in a qualitative study with microamounts of ARS (not further specified), to lead to broadening of diffraction peaks of apatite.11 Large doses of ARS has been shown to inhibit bone formation in vivo in dogs.12 There is a recurring concern that some dyes may influence bone formation, but ARS as currently used does not appear to have a deleterious effect.13
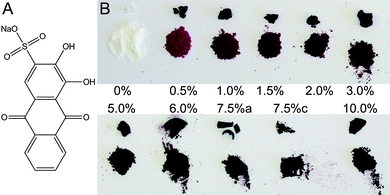 | ||
| Fig. 1 Nanocrystalline hydroxylapatite was synthesized in the presence of alizarin red S (ARS) the sodium salt of which is shown in panel A. Panel B shows a photograph of some of the synthesized samples; for each sample the as purified agglomerate nodule is shown on top while powdered material is shown below. See text for details. | ||
In the present paper we investigate the effects of ARS as an additive in the synthesis of bone-like apatite nanoparticles and investigate the synthesized nanoparticles by thermal analysis, FTIR as well as X-ray powder diffraction (XRD) with ensuing Rietveld refinement. This obtains an in-depth view of the effects of ARS on apatite synthesis. The effects on kinetics are explored using in situ pH measurements and in situ synchrotron XRD. The latter technique is emerging as an extremely powerful tool to obtain detailed insights into materials syntheses as it is now possible to perform full Rietveld refinement of the time resolved diffraction data.14
Results and discussion
We use the ambient temperature apatite nanoparticle synthesis of Kumta et al. as a starting point.15 They proposed mixing a solution of CaCl2 with one of Na3PO4 and NaOH following| 10 CaCl2(aq) + 6 Na3PO4(aq) + 2 NaOH(aq) → Ca10(PO4)6(OH)2 (s) + 20 NaCl (aq) | (1) |
The synthesis was modified by adding ARS to the phosphate solution in a concentration that was a fraction of the total molar concentration of Ca2+ in the final suspension. ARS concentrations from 0 to 10% of the Ca2+-concentration were used. After 24 h reaction time, the suspended powder was isolated and dried. The apatite nanoparticles synthesized in the presence of ARS were all red to purple in color, see Figure 1B, with the intensity and tone of the color scaling with the ARS concentration. Two samples where synthesized with 7.5% ARS: 7.5%a and 7.5%c with reaction times of 1 and 7 days, respectively (see below). High resolution X-ray powder diffractograms of the resulting samples are shown in Figure 2. XRD Samples with 0% to 5% ARS are nanocrystalline apatite while the 10% ARS is amorphous.
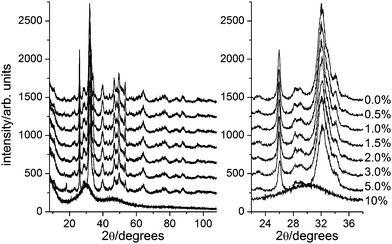 | ||
| Fig. 2 X-ray powder diffractograms of a selection of the synthesized nanoparticles with added alizarin Red S ranging from 0 (top) to 10% (bottom) of the Ca2+ concentration in solution. The left panel shows complete diffractograms while the right hand panel shows a restricted 2θ-range. Note how the peaks broaden with increasing alizarin Red S concentration reflecting the smaller crystallite size; with 10% alizarin red S the sample is amorphous. | ||
Additional experiments showed that 6% ARS was enough to result in amorphous products as illustrated in Figure 3. The amorphous diffractograms display two peaks at 30.2 and 46.0° 2θ corresponding to d-spacings of 2.96 and 1.97 Å.
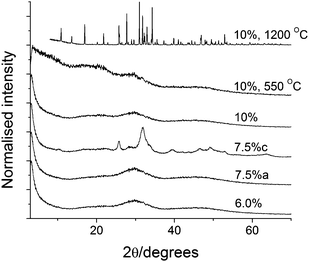 | ||
| Fig. 3 High ARS content XRD data; the 7.5%c sample has been reacted for a week and is crystalline while the remaining samples have been allowed to react for 24 h and are amorphous. The two top diffractograms are from 10% samples that have been heated. The peak at ∼20° 2θ in the bottom five diffractograms originate from the sample mounting tape. | ||
FTIR spectra are shown in Figure 4A and B that compares spectra of the apatite samples with that of pure ARS. The apatite spectra consist of a broad O–H band from 3500 − 3000 cm−1. PO43− absorptions 1100, 1033, 961, 602 and 564 cm−1, CO32− absorptions at 1500−1420 and 876 cm−1.16 The carbonate absorptions prove that the synthesized material is carbonated apatite.15 The position of the carbonate bands indicates that mostly B type substitutions (i.e. on the phosphate site) occur in agreement with the conclusions of Kumta et al.15 ARS also absorbs in these regions as seen by the new peaks appearing with increasing ARS concentration. The phosphate signals are broad signifying a rich variety of microenvironments resulting from small crystal size. For the amorphous 10% sample individual resonances are no longer distinguishable. Deconvolution of the bands in the 700 − 450 cm−1 region shows only slight changes in FWHM and position for the crystalline samples (not shown).
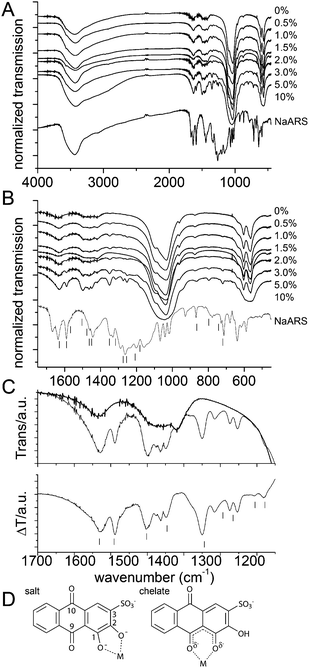 | ||
| Fig. 4 FTIR spectra of the synthesized apatite nanoparticles showing the full range (A) and the low wavenumber region (B). The IR transmission has been normalized to the absorption in the 1033 cm−1 phosphate peak. The pure Na-ARS spectrum is shown as a reference. In the bottom panel, clearly identifiable peaks originating from addition of dye to the apatite nanoparticles have been indicated by vertical bars next to the Na-ARS spectrum. (C) Comparison of rescaled spectra of 0% (fat line) and 10% (thin line) ARS samples (top) and the difference between the two (bottom); difference spectra obtained with 3% and 5% ARS were identical to the one showed here. Vertical bars indicate spectral lines observed by Moriguchi et al.10 in their study of ARS adsorption onto lead exchanged apatite. (D) Binding schemes discussed by Moriguchi et al.:10 either in the salt (left, with key atomic positions numbered) or chelate form (right). | ||
Upon increasing ARS content, new peaks are observed that increase in relative intensity with increasing ARS content. The positions of some of these peaks are indicated next to the ARS reference spectrum in Figure 4B. It is seen that some peaks have the same frequencies as in Na-ARS while some appear at other resonance frequencies. This reflects that the binding environment of ARS is different when attached to the apatite nanocrystals than in the sodium salt and proves that the ARS molecules are intimately linked to the apatite nanocrystals. The top panel of Figure 4C compares rescaled spectra in the 1700 − 1150 cm−1 wavenumber range of the 0% and 10% ARS samples. The bottom panel shows the difference spectrum obtained by subtracting the 0% from the 10% spectrum; it contains at 13 resonances originating from the presence of ARS.
It also presents the peaks found by Moriguchi et al. in their study of ARS adsorption on preformed lead exchanged apatite particles.10 These authors compared binding to Fe(III) and Pb(II) exchanged hydroxylapatite and found that the binding mode is different with lead adopting the salt and iron the chelate form (Figure 4D).10 Comparison of their Pb(II) difference spectrum with that found in the present work shows that they agree almost perfectly even though the resolution of the present spectrum is somewhat higher allowing separation of more close-lying peaks. These authors assigned the band at 1180 (1178 in their spectra) and 1207 (1205 in their spectra) cm−1 to the carbonyl C–C–C stretching and bending modes even though sulfonate groups also absorb in this range17 and may contribute to at least one of the bands. The bands at 1254 and 1274 cm−1 were not considered separate bands by Moriguchi et al. even though a shoulder below their main absorption at 1265 cm−1, that they assign to ν(C–O)−2 (see Figure 4D for atomic labels), is clearly visible. Resonance Raman studies of the binding of catechol and derivatives thereof to Fe(III) in proteins indicate bands originating from catechol binding to iron (sketched in the left panel of Figure 4D) occur around 1262, 1320 and 1470 cm−1 with some variation in the precise frequency due to changes in the nature of the ligand and the microenvironment.18 Whether the doublet nature of this peak is due to different binding modes influencing ν(C–O)−2 or to an independent vibration is not entirely clear, the lower lying peak may also originate from the sulfonate group even though such bands are normally found at slightly lower frequencies.17 Moriguchi et al. observe a band they assign to δ(OH) at 1293 cm−1 reflecting incomplete ionization (and hence coordination) of the catechol groups. We do not observe this band reflecting that all included ARS is involved in coordination to calcium. The typical catechol coordination resonance at ∼1320 cm−1 is in the present case observed at 1316 cm−1, it is assigned to ν(C1–C2).18c The band at 1349.5 cm−1 was assigned by Moriguchi et al. to be ν(C–O)−1 (and found at 1344 cm−1 in their spectrum). The peak at 1449 cm−1 was assigned to ν(Ar C![[double bond, length as m-dash]](https://www.rsc.org/images/entities/char_e001.gif) C) by Moriguchi et al. Again this is actually a multipeak with additional resonances at 1463 and 1476 cm−1; these resonances are also visible in the spectrum of Moriguchi et al. but not assigned by them. We assign one of these three bands to the typical coordinating catechol C–C vibration normally found at ∼1470 cm−1 and the other bands to additional aromatic ring vibrations. The resonance at 1503 cm−1 is assigned by Moriguchi et al. to originate from a complex ring vibration. However, this resonance has not been observed by resonance Raman18b, c on the analogous iron systems and we therefore suggest that either the band originates from a minor chelate binding mode (Figure 4D, right) or by a ring-system vibration. Completely certain assignment can of course only be made using isotopically labeled ARS.18b, c The vibration at 1589 cm−1 is assigned to ν(Ar C
C) by Moriguchi et al. Again this is actually a multipeak with additional resonances at 1463 and 1476 cm−1; these resonances are also visible in the spectrum of Moriguchi et al. but not assigned by them. We assign one of these three bands to the typical coordinating catechol C–C vibration normally found at ∼1470 cm−1 and the other bands to additional aromatic ring vibrations. The resonance at 1503 cm−1 is assigned by Moriguchi et al. to originate from a complex ring vibration. However, this resonance has not been observed by resonance Raman18b, c on the analogous iron systems and we therefore suggest that either the band originates from a minor chelate binding mode (Figure 4D, right) or by a ring-system vibration. Completely certain assignment can of course only be made using isotopically labeled ARS.18b, c The vibration at 1589 cm−1 is assigned to ν(Ar C![[double bond, length as m-dash]](https://www.rsc.org/images/entities/char_e001.gif) C) by Moriguchi et al. There is again a shoulder at 1567 cm−1 that may be also be attributable to ring resonances.18c Finally, the peak at 1629 is assigned to ν(C9 = O).10 Based on this discussion, we conclude that ARS binds in the salt form (Figure 4D) to the apatite nanoparticles.
C) by Moriguchi et al. There is again a shoulder at 1567 cm−1 that may be also be attributable to ring resonances.18c Finally, the peak at 1629 is assigned to ν(C9 = O).10 Based on this discussion, we conclude that ARS binds in the salt form (Figure 4D) to the apatite nanoparticles.
Thermogravimetric analysis (TGA) data are shown in Figure 5A that contains data on crystalline (0−5% ARS) and amorphous samples (6−10% ARS) as well the 7.5%c sample. All samples present an initial mass loss up to 295 °C that we assign to water bound to the nanoparticles. Thereafter a mass drop centered around 425 °C represents the loss of organic material through burning. Additional mass losses at higher temperatures also occur and are assigned to intracrystalline water and carbonate. It is immediately evident from Figure 5A that (1) the water content is much larger in the amorphous samples than in the crystalline material and (2) the incorporated organic mass scales with the ARS concentration. The water content is shown in Figure 5B and is seen to be essentially constant for the two groups of samples. The average water content is 12.7 ± 0.6 wt% for the amorphous samples while the crystalline samples on average contain 5.6 ± 0.8 wt% or 5.3 ± 0.4 wt% for the crystalline samples except the 7.5%c sample that contains 7.3 wt%. Since this sample has reacted much longer than the other samples and is amorphous after 24 h, it is not unreasonable that it has higher water content even after crystallization. The amount of included organic material is shown as mass fraction of the dry weight (i.e. where the mass loss assigned to water has been subtracted) in Figure 5C. All samples except the 5.0 and 10.0% ARS samples fall on a single line. The expected organic mass fraction is wexpected = PARSMW,ARS/(nCaMW,HAP/10 + (PARS/100)MW,ARS), where PARS is the percentage ARS, nCa is the number of Ca2+ ions per bound ARS, while MW,ARS and MW,HAP are the molecular weights of the bound form of ARS and apatite, respectively. However, even for PARS = 0%, a mass loss is observed, Figure 5C. We expect this to be very tightly bound water and/or carbonate. Assuming that this fraction was constant for all samples, and that ARS binds in a salt fashion, Figure 4D, allowed fitting the mass loss data of all crystalline samples except 5.0% ARS to wexpected + L0, where L0 is the mass loss at 0% ARS. This resulted in an excellent fit (full line in Figure 5C, R2 = 0.9933) with nCa = 3.23 ± 0.12 and L0 = 1.51 ± 0.11%. This suggests that about 30% of the calcium ions in the particles are bound to ARS. This behavior is also followed for two of the amorphous samples while the 10% ARS has a smaller than expected organic content possibly suggesting a saturation behavior. The 5% crystalline sample has a higher than expected organic content. We suspect this is either related to the fact that is at the border between crystalline and amorphous particles, see also the discussion of DSC data below, or to the possible presence of loosely bound (i.e. not fully incorporated) ARS on the surface of the particles.
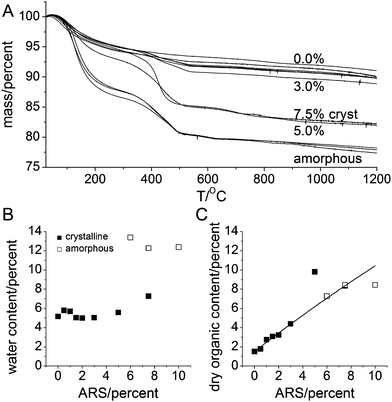 | ||
| Fig. 5 Thermogravimetric analysis. (A) Thermogravimetric data for (from top to bottom) 0%, 0.5%, 1.0%, 1.5%, 2.0%, 3.0%, 7.5%c, 5.0%, and the amorphous 6.0%, 7.5%a and 10.0% samples. (B) Water content estimated as the mass loss from room temperature to 295 °C. (C) Organic content as a fraction of dry weight; obtained from mass loss from 295 to 565 °C. Closed and open symbols in (B) and (C) represent crystalline and amorphous compounds, respectively. | ||
Concurrently with the TGA measurements, differential scanning calorimetry (DSC) data were also recorded. They are summarized in Figure 6A. The water loss at low temperatures is as expected endothermic. The center positions of the water loss peaks are shown in Figure 6B. As for the mass losses, the data are in two distinct groups: the crystalline samples with an average peak temperature of 81 ± 8 °C and the amorphous samples at 123 ± 5 °C†. This is a significant and systematic difference (a student t-test shows that the difference is significant with p<10−4). This difference reflects a tighter binding of water in the amorphous than in the crystalline samples, which in turn suggest that the water is an integral part of the amorphous material.
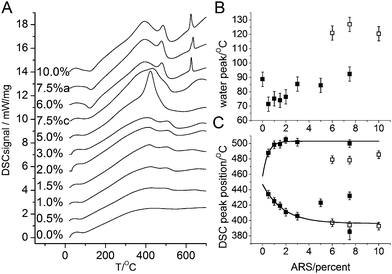 | ||
| Fig. 6 DSC data for various ARS contents (A); the sample labeled 7.5%c is the 7.5% ARS sample that was allowed to react for a week, while 7.5%a was reacted 24 h like all other samples. The individual DSC data have been shifted vertically by 1.4 mW/mg for clarity. The exothermic direction is upwards (positive signals). (B) The position of the endothermic water loss peak seen at low temperatures. Closed and open symbols are for crystalline and amorphous samples, respectively. (C) Positions of the organic burn off peaks. Lines are fits to exponential functions to the first five points. | ||
Around 400 °C, exothermic peaks associated with burning off the organic material are observed. All samples display two peaks, while the 5% sample has a single major peak in between the two peaks seen in the other samples. We assign this peak to the larger organic content discussed above. For the crystalline samples, the low temperature peak moves to lower temperatures with increasing ARS content while the high temperature peak slightly increases. This is seen by expontial fits to the 0.5–3.0% samples that by extrapolation are seen also to fit for the 7.5%c and for the low temperature peak also for the amorphous material. We suggest that the increased ARS content makes the organic material more susceptible to oxidation due to larger accessibility. The 7.5%c sample displays three peaks in the 400–600 °C temperature range, the outer two following the behavior seen in the other crystalline sample, while the remaining peak is intermediate between the peaks.
The amorphous samples display a sharp exothermic peak at 625–635 °C that is associated with a mass loss of about 0.85 wt% (dry weight). We assign this peak to crystallization of the samples. To verify this hypothesis, a 10% sample was heated in the TGA above the main organic loss but below the remineralization temperature (550 °C) and kept at this temperature for 30 min. XRD data on this sample is compared to the other amorphous samples and a 10% sample heated to 1200 °C in Figure 3. The sample heated to 550 °C remains amorphous but the significant small angle scattering (the sharp increase in scattered intensity below 10° 2θ) observed in the as-synthesized samples is no longer present suggesting that burning out the organic changes the mesostructure of the material. Between 550 and 1200 °C the particles crystallize, Figure 3, as also indicated by the DSC data. At the same time the particles sinter and the recuperated powder is macrocrystalline with diffraction lines as sharp as the instrumental resolution. In addition to sintering, new lines corresponding to Whitlockite appear in diffractograms of the post-TGA samples. Whitlockite, Ca3(PO4)2, is obtained when strongly heating Ca-deficient apatites16b following
| Ca10(1-x)(PO4)6(OH)2(1–10x) → (1–10x) Ca10(PO4)6(OH)2 + 30x Ca3(PO4)2 |
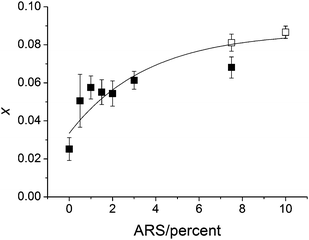 | ||
| Fig. 7 Non-stoichiometry factor, x in Ca10(1-x)(PO4)6(OH)2(1–10x), determined from Rietveld refinement of powders recuperated after heating to 1200 °C in the TGA. Closed and open symbols: initially crystalline and amorphous samples, respectively. The full line is a fit to an asymptotic function against all data. | ||
Detailed information on the crystal size and lattice parameters of the as-synthesized powders were extracted by Rietveld refinement of the data shown in Figure 2. The particle size broadening was clearly anisotropic and could be modeled by a two-parameter surface harmonics fit that effectively describe a needle shape with the long and short axes being parallel to the crystallographic c- and a-axes, respectively. As can be seen qualitatively on the powder diffractograms, addition of ARS reduced the crystallite size. This is shown in Figure 8. The reduction in crystallite size is linearly dependent on the ARS content within the precision of the Rietveld refinement results. The linear fits resulted in the relations size‖a = 5.92(5) nm (1−0.045(4)PARS) and size‖c = 14.1(3) nm (1 − 0.052(7)PARS), where PARS is the percent ARS and the number in parentheses gives the standard uncertainty on the last digit. It is seen from the slopes that the dependence on the ARS concentration is very close to being the same with the difference not being significantly different compared to the standard uncertainty. The size anisotropy is therefore almost independent of ARS concentration.
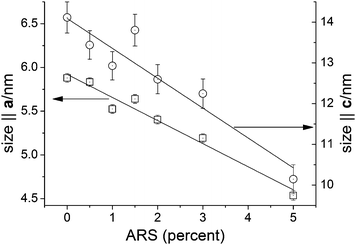 | ||
| Fig. 8 Crystal size parallel to the crystallographic a-axis (squares) and c-axis (circles) as a function of ARS content as obtained from Rietveld refinement. The lines are linear fits to the data. The two ordinate axes are scaled to cover the same relative range. | ||
The unit cell parameters also depended on the ARS concentration. The relative lattice distortion (macro strain), obtained by subtracting the refined 0% values of a = 9.4378(8) Å and c = 6.8882(5) Å from the values at a given ARS concentration, is shown in Figure 9 as a function of ARS concentration. It is seen that the lattice distortion along the a-axis increases linearly with ARS concentration to reach 0.128(14)% for the 5% ARS sample. The lattice distortion along the c-axis decreases linearly (within the precision of the data) up to −0.053(14)% for the 5% ARS sample. The overall effect on the unit cell volume is one of expansion by 0.20% (ΔV/V) for the 5% sample. Pokroy et al. found a lattice distortion for both aragonite and calcite mussel shell calcium carbonates that relaxed upon thermally annealing the samples.20 The present observation of a dose dependent lattice distortion induced by an organic additive is to the best of our knowledge the first time this effect has been demonstrated in synthetic systems. The linear dependence on ARS concentration strongly insinuates that ARS coordination is the chief agent behind the effect as proposed for the biogenic cases.20 More detailed studies of this phenomenon are underway.
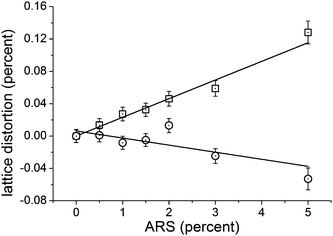 | ||
| Fig. 9 Relative lattice distortion (macro strain) as a function of added ARS content for the a- (squares) and c-axes (circles). | ||
To obtain insights into the influence of ARS on the kinetics of apatite formation in situ pH and synchrotron diffraction measurements were performed. The pH data are summarized on Figure 10 that compares pure apatite with 2% and 10% ARS. Values of pH provide excellent insight into apatite formation because the reaction consumes hydroxide and phosphate. In the pure system, there is a sharp initial drop corresponding to the formation of a gel-like intermediate that in situ diffraction data show is amorphous (vide infra). After 40 min in the pure apatite sample, there is a rapid drop in pH indicative of apatite formation. For the 2% sample, the first drop is equally rapid and very close to the same pH level, but the crystallization step occurs after 2 h as measured by the point with the largest slope corresponding to the largest rate of hydroxide consumption. For the 10% sample, the initial pH drop is larger reaching ¾ of a pH unit further down than in the other two cases. Thereafter the pH slowly decreases with no drop indicative of crystallization observed in 24 h. The downward slope, seen also in the two crystallizing cases, suggests that crystallization is not entirely hindered but rather that the crystallization time is increased. To test this hypothesis, a 7.5% sample was allowed to react for a week yielding the nanocrystalline 7.5%c sample.
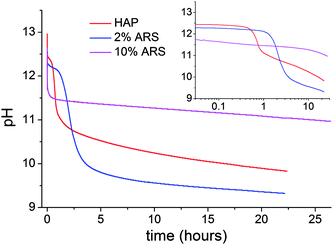 | ||
| Fig. 10 In situ pH measurements taken at room temperature for the pure apatite (red) and with 2% (blue) and 10% (purple) ARS added. The inset shows the data on a logarithmic time scale where the initial pH drop has been excluded. | ||
Additional information on the particle formation and crystallization behavior was obtained by in situ synchrotron XRD performed at 70 ± 2 °C to make the experiments feasible within the time available at synchrotron sources. Two liquid streams, as in the ex situ syntheses, were mixed and measurements commenced within a few seconds thereafter.14a Upon mixing, a solid gel-like substance formed immediately.The data could be fitted by Rietveld refinement with model including background, lattice parameters, scale factor and crystallite size in a two parameter anisotropic model with the c-axis being the anisotropic axis; this model is very similar to the one used for the ex situ data. Figure 11A shows water background subtracted data while Figure 11B shows selected individual diffractograms at various times. Note that the raw data are dominated by the very strong scattering from water,14a which however can be subtracted using the fitted background at long reaction times. The initial precipitate is clearly amorphous, Figure 11A and B, and displays peaks in the same location seen in the ex situ data. After a period, that we will refer to as the nucleation time, peaks corresponding to the apatite diffraction pattern appear, Figure 11A and B. No sign of OCP or another crystalline precursor phase was observed in agreement with early ex situ on similar but different basic synthesis results by Eanes and Posner21 thus providing model support for the notion that an ACP phase forms first, which is then transformed into nanocrystalline apatite.5 Refined scale factors are shown in Figure 11C. For all ARS concentrations, they start at 0 and only increase after the nucleation time. After nucleation, the scale factors grow but display large fluctations with time. Visual observation of the sample containing capillary during the experiment showed that upon crystallization, the amorphous precursor gel breaks down and flocks of particles move in the warm fluid. This leads to a time dependent change in the amount of sampled material. Therefore we refrain from a more detailed analysis of the Rietveld refinement data on the crystalline phase here. However, the nucleation time could be determined with great confidence as growth onset from the refined scale factors. It was found to increase exponentially with ARS content following tnucl(ARS) = t0% + Aexp(t/χARS) with t0% = 0.36(28) min, A = 0.16(8) and χARS = 1.77(23) %. This behavior agrees with the pH measurements where a later nucleation time also was observed for the sample with ARS. The particles were formed much quicker in the in situ XRD experiments because of the elevated temperature of 70 °C. The expontial increase in nucleation time demonstrates that ARS strongly stabilizes ACP.
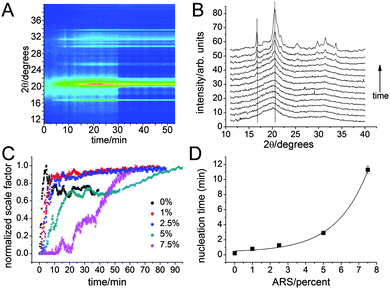 | ||
| Fig. 11 In situ diffraction data recorded at 80 °C for various ARS concentrations. (A) Contour plot of background corrected intensity for 5% ARS, obtained by subtracting the scaled Rietveld refined background at late times from the data, as a function of diffraction angle and time; note the amorphous precursor observed at short times. (B) Background corrected diffractograms for 5% ARS recorded at times 0.1667, 0.3, 0.6, 1.2, 1.9, 2.6, 3.3, 3.9, 4.6, 5.2, 6.2, 19.9667 min from bottom to top, respectively. Note how the maximum intensity of the amorphous precursor does not coincide with the maximum diffraction peaks that are indicated by the two vertical lines. (C) Refined scale factors as a function for varying ARS concentrations. Note the jumps in the scale factors that reflect that the crystalline sample moves in warm fluid upon breakdown of the amorphous precursor gel. (D) Nucleation time extracted from refined scale factors; when error bars are not visible the estimated standard uncertainty is smaller than the symbol size. The full line represents an expontial fit, see text for details. | ||
Discussion & conclusion
The addition of ARS to the crystallization mixture drastically changes the size of the formed apatite nanocrystals. This effect can originate from several factors including (1) non-specific changes in ion activity, (2) Ca2+-complexation leading to lower Ca2+ activity, (3) inhibition of nucleus formation and (4) blockage of growth sites on formed nuclei leading to growth inhibition. To address point (1) we make a rough estimate of the changed ion activity using Debye-Hückel limiting theory: logγ±∝I1/2where I = ½Σzi2mi is the ionic strength of the solution. The change in activity coefficient can thus, when ignoring complex formation, be estimated from the change in I1/2. logγARS±/logγ± = (IARS/I)1/2, where superscript ARS indicates solutions containing ARS. Approximating the molal concentrations by the molar concentrations yields estimates of the effect of ARS. For the 10% case, logγARS±/logγ±≈1.00733 showing that the change in activity induced by increased ionic strength is small.Ca2+ complexation in solution is likely to be an important player in that it results in reduction of the effective Ca2+ activity. The binding constant of ARS to Ca2+ has been determined by Wu and Forsling22 who found that at pH above 8, the dominant complex form is [CaA]−, where H2A− refers to ARS with protonated phenol oxygens and deprotonated sulphonic acid group, with a minor contribution from [CaA2]4−. The [CaA]− may also form on the surface of clusters that could become nuclei thus inhibiting nucleus formation. The in situ results clearly demonstrate that nucleation is strongly retarded upon addition of ARS to the point that amorphous samples were obtained. Both complex formation, forming discrete molecular species and thereby reducing available calcium, and nucleation inhibition are likely to contribute to this inhibition. Thus ARS provides control over nucleation kinetics. The ex situ XRD results show that after 24 h reaction, the crystallite size is reduced linearly with ARS concentration. Considering that the effect on nucleation time is exponential, this observation suggests that ARS also inhibits growth of formed nuclei. Further studies are underway to investigate this fact further.
To summarize, ARS was found to inhibit nucleation of apatite and to lead to smaller nanocrystals after a given reaction time. It stabilized the amorphous calcium phosphate precursor that contained more water than the crystalline counterparts. FTIR analysis suggested that the binding of ARS to the crystalline and amorphous phosphates were similar as the same ARS resonances were observed. The observed lattice strain suggests that the organic matrix may strongly influence the apatite lattice as seen in biogenic carbonates. Experiments are planned to test if this also occurs in biogenic apatites.
Experimental
Chemicals
Alizarin red S, Na3PO4 (≥ 96% purity) and NaH2PO4·H2O (≥99% purity) were obtained from Sigma-Aldrich, dry CaCl2 (≥ 98% purity) was obtained from Merck KGaA while NaOH was obtained from J. T. Baker. The chemicals were all used as received.Ex situ syntheses
The syntheses followed equation (1) with ARS added to the phosphate solution prior to addition of Ca2+. The ARS content is given as molar percentages of the Ca2+ concentration. Samples were made in the 0–10% ARS range. A reaction volume of 30 ml was used. 10 ml basic phosphate solution (0.36 M Na3PO4 + 0.12 M NaOH; Na3PO4 being synthesized from NaH2PO4 and NaOH) was mixed with 10 ml ARS solution made by dilution of ARS stock solution. For samples with more than 5% ARS, the solid dye was added to 20 ml 0.18 M Na3PO4 + 0.06 M NaOH due to solubility issues; the dye fully dissolved in the 20 ml solution. While stirring 10 ml 0.6 M CaCl2 solution was added resulting in formation of a gel. The samples were covered with parafilm and allowed to react under stirring for 24 hours at room temperature after which they were centrifuged and washed, filtered and finally dried at 70 °C.The reaction solutions for all ARS samples were deep purple. The supernatant after centrifugation had a slight orange-reddish color suggesting that most dye stuff was bound in the solid powder. The dried samples were all deep purple and when crushed pink/light purple, Figure 1, with darker color at higher ARS concentrations.
Ex situ XRD
Routine XRD was measured on a STOE IPDS (Stoe & Cie GmbH, Darmstadt, Germany) in transmission on powders mounted on tape. For Rietveld refinement, data were collected on a Bruker D8 advance diffractometer using Bragg-Brentano geometry, CuKa1 radiation and soller slits for improved resolution. Samples were deposited from an ethanol slurry on obliquely cut Si single crystal sample holders (Bruker AXS Gmbh, Karlsruhe, Germany) and data collected for 24 h in the 2θ-range 8–108° with a step size of 0.03° and a total measurement time of 24 h for the nanocrystalline samples and a step size of 0.02° with a measurement time of 12 h for samples after TGA. The instrument resolution function was determined using a Si standard powder (NIST SRM 640). Rietveld refinement was performed using FullProf.23 The profiles were described by the Thompson-Cox-Hastings pseudo-Voigt parameterization. The particles had anisotropic crystallite shapes, which were modeled using surface spherical harmonics23 with two terms. This effectively corresponds to needle shaped crystallites. In the final refinements of the nanocrystalline samples, refined parameters were background, zero point, scale factor, lattice parameters, over-all atomic displacement parameter, and size broadening. For post-TGA samples, the model included background, zero point, scale factors, over-all displacement parameter, lattice and profile parameters as well as Ca fractional coordinates.FTIR
All IR measurements were made on a Perkin Elmer Paragon 1000 (PerkinElmer, Massachusetts, USA) using KBr pellets. Spectra were averaged over 64 scans, with a spectral resolution of 1.0 cm−1 and interval of 0.5 cm−1.Thermal analysis
TGA/DSC was performed on a Netzsch STA 449 C (NETZSCH-Gerätebau GmbH, Selb, Germany). Approximately 10 mg of sample were heated to 1200 °C in an Al2O3 crucible using a heating rate of 10 K/min in an atmosphere generated by 30 ml/min He purge gas, 20 ml/min O2 purge gas and a 25 ml/min protective He gas flow.In situ pH measurements
pH measurements were made using a SevenMulti pH meter and electrode from Mettler Toledo AG (Greinfensee, Switzerland) that was interface to a computer for automatic pH reading using LabX direct pH software from the same company. The electrode was calibrated using a three-buffer system (pH 4, 7, 9). The readings were started upon CaCl2 addition, making measurements every 10 seconds for approximately 24 hours.In situ XRD
In situ XRD studies were performed on beamline I7–11 in MAXLAB, Lund, Sweden.24 Phosphate solutions (0.24 M Na3PO4 + 0.08 M NaOH) with Alizarin Red S (1%, 2.5%, 5% and 7.5%) as well as a 0.4 M CaCl2 solution were prepared on site. Full details of the experimental set up are published elsewhere.14a Briefly the solutions were pumped by a peristaltic pump and met in linear mixer before being injected into a single crystal sapphire capillary of 0.7 mm interior diameter. The sample temperature, 70 ± 2 °C, was controlled by a hot air blower and monitored using a thermocouple; the quoted standard uncertainty on the temperature has been derived from the observed variations in the temperature. The diffracted X-rays were detected using a MARCCD detector using exposure times of 4 or 15 s. The detector readout time is 2.5 s meaning the time resolution is at best 6.5 s. X-rays of a wavelength of 0.998286 Å (as obtained using an Si standard). Between experiments, the system was flushed with 0.4 M HCl and water. In-situ XRD frames were integrated using FIT2D.25 For each series a mask was applied before integration to remove capillary scattering and effects of the beam-stop. The series with variable exposure times were then intensity corrected to allow for serial refinement. Initial fits were done manually in GSAS26 using the last frame in each series, varying only unit cell parameters, scale, size and background. The crystallite size broadening was modeled by two parameter anisotropic broadening with the c-axis as the anisotropically broadened axis. The background was modeled by a Chebyshev polynomial expansion with 36 terms to allow modeling the large background scattering from water.14a Thereafter serial refinements were made using the refinement results from the last frame as starting point. Statistics were made on the refined parameters and data points with uncertainties larger than three times the median were discarded. Additional bad data points from pixel faults not caught by statistics were removed by hand after double checking frames. The refined cell parameter values are not absolute since minor changes in experimental setup that could happen during sample change could change the sample detector distance. The trends observed for each series are however perfectly comparable.Acknowledgements
We thank the Danish Council for Independent Research | Natural Sciences for funding and DanScatt for support of the synchrotron experiments. We thank MAXLAB for beam time and Yngve Cerenius for support. We thank PhD Martin Bremholm for discussions on measurement strategies. We thank M.Sc.'s Jonas Skovgaard, Bjørn Fridur Mikladal and Uffe B. Jensen, B.Sc. Hanna Leemreize and Ms. Veronica Gavrilov for assistance during synchrotron measurements and further thank M.Sc. Bjørn Fridur Mikladal for support during initial experiments.References
- (a) P. M. Dove; J. J. De Yoreo; S. Weiner., Biomineralization. The Mineralogical Society of America: Washington DC, USA, 2003; Vol. 54 Search PubMed; (b) H. A. Lowenstam; S. Weiner., On Biomineralization. Oxford University Press: New York, 1989 Search PubMed; (c) S. Mann., Biomineralization: principles and concepts in bioinorganic materials chemistry. Oxford University Press: Oxford, 2001; Vol. 5 Search PubMed.
- P. Fratzl and R. Weinkamer, Nature's hierarchical materials, Prog. Mater. Sci., 2007, 52(8), 1263–1334 CrossRef CAS.
- A. George and A. Veis, Phosphorylated Proteins and Control over Apatite Nucleation, Crystal Growth, and Inhibition, Chem. Rev., 2008, 108, 4670–4693 CrossRef CAS.
- (a) M. D. Grynpas and S. Omelon, Transient precursor strategy or very small biological apatite crystals?, Bone, 2007, 41, 162–164 CrossRef CAS; (b) S. Weiner, Transient precursor strategy in mineral formation of bone, Bone, 2006, 39, 431–433 CrossRef CAS; (c) N. J. Crane, V. Popescu, M. D. Morris, P. Steenhuis and M. A. Ignelzi Jr., Raman spectroscopic evidence for octacalcium phosphate and other transient mineral species deposited during intramembranous mineralization, Bone, 2006, 39, 434–442 CrossRef CAS.
- (a) J. Mahamid, A. Sharir, L. Addadi and S. Weiner, Amorphous calcium phosphate is a major component of the forming fin bones of zebrafish: Indications for an amorphous precursor phase, Proc. Natl. Acad. Sci. U. S. A., 2008, 105, 12748–12753 CrossRef CAS; (b) J. Mahamid, B. Aichmayer, E. Shimoni, R. Ziblat, C. Li, S. Siegel, O. Paris, P. Fratzl, S. Weiner and L. Addadi, Mapping amorphous calcium phosphate transformation into crystalline mineral from the cell to the bone in zebrafish fin rays, Proc. Natl. Acad. Sci. U. S. A., 2010, 107, 6316–6321 CrossRef CAS.
- H. Puchtler, S. N. Meloan and M. S. Terry, On the History and Mechanism of Alizarin and Alizarin Red S Stains for Calcium, J. Histochem. Cytochem., 1969, 17, 110–124 CAS.
- M. H. Bünger, H. Oxlund, T. K. Hansen, S. Sørensen, B. M. Bibby, J. S. Thomsen, B. L. Langdahl, F. Besenbacher, J. S. Pedersen and H. Birkedal, Strontium and Bone Nanostructure in Normal and Ovariectomized Rats Investigated by Scanning Small-Angle X-Ray Scattering, Calcif. Tissue Int., 2010, 86, 294–306 CrossRef.
- D. N. Misra, Reaction of Alizarin Red S with Hydroxyapatite: Stoichiometry and Surface Effect, Colloids Surf., 1992, 66, 181–187 CrossRef CAS.
- T. Moriguchi, K. Yano, S. Nakagawa and F. Kaji, Elucidation of Adsorption Mechanism of Bone-Staining Agent Alizarin Red S on Hydroxyapatite by FT-IR Microspectroscopy, J. Colloid Interface Sci., 2003, 260, 19–25 CrossRef CAS.
- T. Moriguchi, S. Nakagawa and F. Kaji, Adsorbability of Alizarin Red S on Fe(III)- and Pb(II)-Treated Hydroxyapatites in Water, Phosphorus Research Bulletin, 2010, 24, 62–72 Search PubMed.
- N. I. Ponomareva, T. D. Poprygina, M. V. Lesovoi and S. I. Karpov, Effect of Alizarin Red S on the Formation of Hydroxyapatite Crystals, Russ. J. Inorg. Chem., 2008, 78, 521–526 CAS.
- W. H. Harris, D. F. Travis, U. Friberg and E. Radin, The In Vivo Inhibition of Bone Formation by Alizarin Red S, J. Bone Joint Surg. Am., 1964, 46, 493–508 CAS.
- X. Zhou, P. Zhang, C. Zhang, B. An and Z. Zhu, Tetracyclines Inhibit Rat Osteoclast Formation and Activity In Vitro and Affect Bone Turnover in Young Rats In Vivo. Calc, Calcif. Tissue Int., 2010, 86, 163–171 CrossRef CAS.
- (a) C. J. S. Ibsen, H. Leemreize, B. F. Mikladal, J. Skovgaard, J. R. Eltzholtz, M. Bremholm, B. B. Iversen and H. Birkedal, In situ powder diffraction for the study of bioinspired nanoparticle syntheses in water, In Preparation, 2010 Search PubMed; (b) G. V. Jensen, M. Bremholm, T. R. Jensen, G. R. Deen, N. Lock, M. Niederberger, B. B. Iversen, J. S. Pedersen and H. Birkedal, Kinetics of TiO2 particle synthesis in a non-aqeuous solvent, Chem. Mater., 2010, accepted Search PubMed; (c) H. Jensen, M. Bremholm, R. P. Nielsen, K. D. Joensen, J. S. Pedersen, H. Birkedal, Y.-S. Chen, J. Almer, E. G. Søgaard, S. B. Iversen and B. B. Iversen, In-situ High Energy Synchrotron Radiation Study of Sol-Gel Nanoparticle Formation in Supercritical Fluids, Angew. Chem., Int. Ed., 2007, 46, 1113–1116 CrossRef CAS; (d) A. Michailovski, J.-D. Grunwaldt, A. Baiker, R. Kiebach, W. Bensch and G. R. Patzke, Studying the Solvothermal Formation of MoO3 Fibers by Complementary In Situ EXAFS/EDXRD Techniques, Angew. Chem., Int. Ed., 2005, 44, 5643–5647 CrossRef CAS; (e) P. Norby, In-situ XRD as a tool to understanding zeolite crystallization, Curr. Opin. Colloid Interface Sci., 2006, 11, 118–125 CrossRef CAS; (f) R. I. Walton, F. Millange, R. I. Smith, T. C. Hansen and D. O'Hare, Real Time Observation of the Hydrothermal Crystallization of Barium Titanate Using in Situ Neutron Powder Diffraction, J. Am. Chem. Soc., 2001, 123, 12547–12555 CrossRef CAS.
- P. N. Kumta, C. Sfeir, D.-H. Lee, D. Olton and D. Choi, Nanostructured calcium phosphates for biomedical applications: novel synthesis and characterization, Acta Biomater., 2005, 1, 65–83 CrossRef.
- (a) B. O. Fowler, Infrared Studies of Apatites. I. Vibrational assignments for calcium, strontium, and barium hydroxyapatites using isotopic substitution, Inorg. Chem., 1974, 13, 194–207 CrossRef CAS; (b) J. C. Elliott., Structure and Chemistry of the Apatite and Other Calcium Orthophosphates. Elsevier: Amsterdam, 1994 Search PubMed.
- K. Fujimori, The infrared spectra of Alkane-1-sulfonates, Bull. Chem. Soc. Jpn., 1959, 32, 850–852 CrossRef CAS.
- (a) M. J. Harrington, A. Masic, N. Holten-Andersen, J. H. Waite and P. Fratzl, Iron-Clad Fibers: A Metal-Based Biological Strategy for Hard Flexible Coatings, Science, 2010, 328, 216–220 CrossRef CAS; (b) I. Michaud-Soret, K. K. Andersson and J. L. Que, Resonance Raman Studies of Catecholate and Phenolate Complexes of Recombinant Human Tyrosine Hydroxylase, Biochemistry, 1995, 34, 5504–5510 CrossRef CAS; (c) L. Öhrström and I. Michaud-Soret, Quantum Chemical Approach to the Assignment of Iron-Catecholate Vibrations and Isotopic Substitution Shifts, J. Am. Chem. Soc., 1996, 118, 3283–3284 CrossRef.
- (a) Y. Politi, Y. Levi-Kalisman, S. Raz, F. Wilt, L. Addadi, S. Weiner and I. Sagi, Structural Characterization of the Transient Amorphous Calcium Carbonate Precursor Phase in Sea Urchin Embryos, Adv. Funct. Mater., 2006, 16, 1289–1298 CrossRef CAS; (b) B. Hasse, H. Ehrenberg, J. C. Marxen, W. Becker and M. Epple, Calcium Carbonate Modifications in the Mineralized Shell of the Freshwater Snail, Chem.–Eur. J., 2000, 6, 3679–3685 CrossRef CAS; (c) Y. Politi, R. A. Metzler, M. Albrecht, B. Gilbert, F. H. Wilt, I. Sagi, L. Addadi, S. Weiner and P. U. P. A. Gilbert, Transformation mechanism of amorphous calcium carbonate into calcite in the sea urchin larval spicule, Proc. Natl. Acad. Sci. U. S. A., 2008, 105, 17362–17366 CrossRef CAS.
- (a) B. Pokroy, J. P. Quintana, E. N. Caspi, A. Berner and E. Zolotoyabko, Anisotropic lattice distortions in biogenic aragonite, Nat. Mater., 2004, 3, 900–902 CrossRef CAS; (b) B. Pokroy, A. N. Fitch, F. Marin, M. Kapon, N. Adir and E. Zolotoyabko, Anisotropic lattice distortions in biogenic calcite induced by intra-crystalline organic moleucles, J. Struct. Biol., 2006, 155, 96–103 CrossRef CAS.
- E. D. Eanes and A. S. Posner, Intermediate Phases in the Basic Solution Preparation of Alkaline Earth Phosphates, Calcif. Tissue Res., 1968, 2, 38–48 Search PubMed.
- L. Wu and W. Forsling, Potentiometric and Spectrophotometric Study of Calcium and Alizarin Red S Complexation, Acta Chem. Scand., 1992, 46, 418–422 CrossRef CAS.
- (a) J. Rodriguez-Carvajal, Recent advances in magnetic structure determination by neutron powder diffraction, Phys. B, 1993, 192, 55–69 CrossRef CAS; (b) J. Rodriguez-Carvajal, Recent Developments of the Program FULLPROF, Commision on Powder Diffraction (IUCr) Newsleter, 2001, 26, 12–19 Search PubMed.
- Y. Cerenius, K. Ståhl, L. A. Svensson, T. Ursby, Å. Oskarsson, J. Albertsson and A. Liljas, The crystallography beamline I711 at MAX II., J. Synchrotron Radiat., 2000, 7, 203–208 CrossRef.
- (a) A. P. Hammersley, FIT2D: An introduction and overview, ESRF Internal Report, ESRF97HA02T, 1997 Search PubMed; (b) A. P. Hammersley, S. O. Svensson, M. Hanfland, A. N. Fitch and D. Häusermann, Two-Dimensional Detector Software: From Real Detector to Idealised Image or Two-Theta Scan, Int. J. High Pressure Res., 1996, 14, 235–248 Search PubMed.
- (a) A. C. Larson and R. B. Von Dreele, General Structure Analysis System (GSAS), Los Alamos National Laboratory Report LAUR 86-748, 2000 Search PubMed; (b) B. H. Toby, EXPGUI, a graphical user interface for GSAS, J. Appl. Crystallogr., 2001, 34, 210–221 CrossRef CAS.
Footnote |
| † The quoted estimated standard uncertainty is the estimated value for a single measurement; the rms variation around the mean is smaller at 4 °C. |
| This journal is © The Royal Society of Chemistry 2010 |
