Influence of surface plasmon resonance on the emission intermittency of photoluminescence from gold nano-sea-urchins†
Yen Hsun
Su
a,
Sheng-Lung
Tu
b,
Shih-Wen
Tseng
c,
Yun-Chorng
Chang
d,
Shih-Hui
Chang
e and
Wei-Min
Zhang
f
aResearch Center for Applied Sciences, Academia Sinica, Taipei, 115, Taiwan. E-mail: kistic@mail.mse.ncku.edu.tw; Fax: (+886) 62747995; Tel: (+886)912012204
bCenter for Micro/Nano Science and Technology, National Cheng Kung University, Tainan, 70101, Taiwan. E-mail: rich@mail.mina.ncku.edu.tw; Fax: (+886)62747995; Tel: (+886)62757575 ext. 65290
cCenter for Micro/Nano Science and Technology, National Cheng Kung University, Tainan, 70101, Taiwan. E-mail: shihwen@mail.mina.ncku.edu.tw; Fax: (+886)62747995; Tel: (+886)62757575 ext. 65290
dInstitute of Electro-Optical Science and Engineering, National Cheng Kung University, Tainan, 70101, Taiwan. E-mail: ychang6@mail.ncku.edu.tw; Fax: (+886) 62095040; Tel: (+886)62757575 ext. 65283
eInstitute of Electro-Optical Science and Engineering, National Cheng Kung University, Tainan, 70101, Taiwan. E-mail: gilbert@mail.ncku.edu.tw; Fax: (+886)62747995; Tel: (+886)62757575 ext. 65290
fDepartment of Physics, National Cheng Kung University, Tainan, 70101, Taiwan. E-mail: wzhang@mail.ncku.edu.tw; Fax: (+886) 62747995; Tel: (+886)62757575 ext. 65274
First published on 22nd October 2010
Abstract
The effect of surface plasmon resonance (SPR) on the blinking emission of photoluminescence from noble metal nanostructures still requires further investigation in quantum mechanics and limits their applications. We investigate one photon luminescent emission intermittency of noble metal nanostructures with differently sized sea-urchin-shaped nanoparticles, known as nano-sea-urchins (NSUs). The probability of the “on” process in one photon luminescent emission intermittency of NSUs increases due to the strong electric field of SPR. This mechanism is explained by the reaction potential threshold model we propose here. Furthermore, the ameliorated photoluminescence of NSUs is strong enough to excite waterweed bioluminescence and can act as an in vivo bio-light emitting device, which has potential applications in cytotoxicity, bio-imaging and bio-labeling.
1. Introduction
Gold nanoparticles (Au NPs) have attracted great research interest with regard to their use in biosensors, solar cells, catalysts, and nanophotonics1–7 due to their unusual chemical and physical properties. There have been a number of recent studies8–10 of photoluminescence in noble metal nanostructures. The mechanism of photoluminescence from gold consists of three steps,8,11 as shown in Fig. 1(a). First, electrons from occupied d bands are excited to unoccupied sp bands by either one-photon or two-photon absorption. Then, the electrons move close to the Fermi level by the intraband scattering process. Finally, the electron-hole pair recombines and a photon is emitted. The quantum yield η of Au NPs (η = 10−4 ∼10−5)12 is relatively low compared to the Au clusters with a few atoms (η = 10−1). Two-photon luminescent emission at 2.2 eV is commonly observed in gold, while one-photon luminescent emission at a shorter wavelength, 4.2 eV, is predicted due to the deep d band (the lower d band) excitation.11 Recently a weak and blinking13 signal was observed in the photoluminescence of quantum dots, nanorods, and nanowires. Several mechanisms were proposed to explain this.13 One is due to the transition of an electron between the exciton bound state and excited state. However, for the case of a metal nanostructure, the blinking signal does not result from the exciton bound state. Instead, it is due to the Auger process in which another electron on the sp band recombines with an electric hole on the d band before the excited electron has a chance to scatter close to the Fermi level and recombine with the electric hole, as shown in Fig. 1(b). The energy of electron-hole pair combination is released in the form of thermal energy, not photons, and this will lead to the “off” process in the emission intermittency. Therefore, for practical applications such as bio-sensing and bio-labeling, it is important to enhance the photoluminescence, and in the meantime to reduce the blinking of noble metal nanostructures.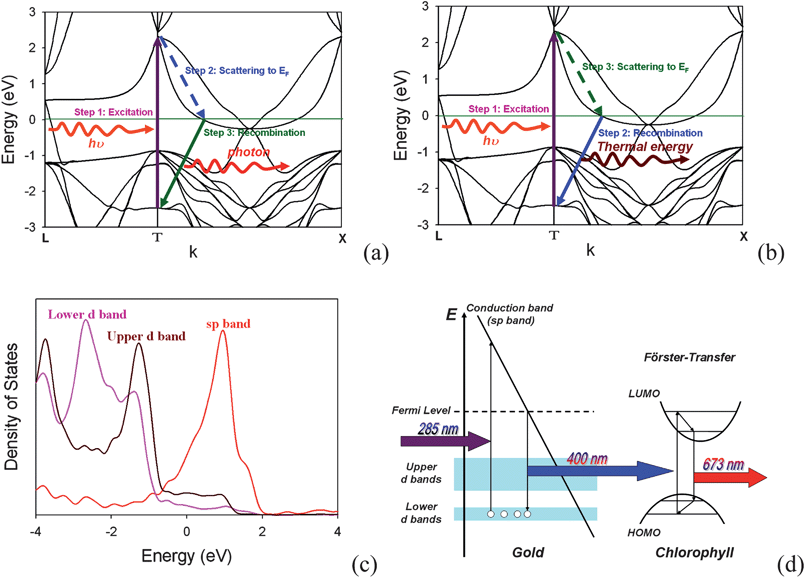 | ||
| Fig. 1 Energy-momentum diagram of (a) the “on” process and (b) the “off” process and (c) density of state for gold bulk. (d) Scheme of the mechanism for the photoluminescence of gold NSUs to the secondly-excited bioluminescence of water grass for the “on” process. The 285 nm radiation excites an electron from the lower d band to the upper d band. Then the “on” process occurs due to the interaction between an electron and an electric hole. After recombining, the system releases photons. On the other hand, the “off” process is an Auger process, as a result of the interaction among two electrons and an electric hole. After recombining, the system also releases thermal energy. The “off” process and the “on” process cause the blinking phenomenon. (Band structure and density of states are calculated by density function theory, OpenMX 3.4 code.31) | ||
Gold nanorods8,14,15 and nanoparticles16–18 can produce a strong electromagnetic field19–22 on the structure surface, essentially due to surface plasmon resonance (SPR), which localizes light on the nanometre scale.23 The electromagnetic field may improve the weak and blinking13 photoluminescence of noble metal nanostructures, but to date few reports discuss the relation between the blinking phenomena and the SPR in such nanostructures.
In this study, we synthesized gold sea-urchin-shaped nanoparticles by an environmentally-friendly method20 in order to produce nano-antenna-like spines on gold nanoparticles. Hereafter, we will simply refer the sea-urchin-shaped nanoparticles to ”nano-sea-urchins” (NSUs). Although the blinking emission phenomenon in such nanostructures is an open quantum mechanical question,13 we shall use the SPR of gold NSUs to better understand the blinking emission phenomenon of metal clusters in a series of experiments. The results can be explained by the kinetic reaction barrier mechanism. We found that SPR enhances the probability of the “on” process in emission intermittency. As the local strong electromagnetic field in nano-antenna-like spines increases, the threshold of emission intermittency in a postulated kinetic reaction also increases. This is because blinking emission intermittency is inhibited by SPR. In addition, the photoluminescence of gold NSUs is observed at 400 nm with only one-photon excitation.
An environmentally-friendly method for the development of advanced light emission device (LED) and solar cells is obviously desirable. Leaves are bio-degradable and contain chlorophyll, which is used in green solar cells24 and electronically coupled junctions as a photosensor.25,26 However, few studies have been reported for the use of chlorophyll in the in vivo bio-LED. In this study, the biologically-friendly gold NSUs are used in a live plant with the emission light used to excite the bioluminescence of chlorophyll in live Bacopa caroliniana leaves, as shown in Fig. 1(d). Consequently, we find that gold NSUs can emit blinking-inhibited blue light and act as blue-light phosphor powders. It can excite bioluminescence for Bacopa caroliniana, and thereby can be used as an in vivo bio- LED.
2. Experimental
Synthesis of different size gold NSUs
Gold NSUs were prepared with 1.5 mL of 0.5 mM HAuCl4(aq) and 0.15 mL of 0.34M trisodium-citrate(aq) solution at room temperature under vigorous stirring. Furthermore, 0 mL, 0.08, 0.16, and 0.24 mL of 5M NaCl(aq) solutions were added to gold colloid without irradiation to synthesize gold NSUs of different sizes. In our previous research,20 trisodium citrate acts as a surfactant and reduction27 to synthesize Au NPs. When NaCl(aq) is added, the micelle formed by trisodium citrate will be changed, and Au NPs then aggregate. The more NaCl(aq) is added, the faster Au NPs aggregate. After all of the Au NPs have been heterogeneously aggregated on the spines of Au sea-urchin-like nanoparticles, the growth reaction ends, and the size and morphology become stable. We then add DI-water to keep the same concentration, 78.16 mg L−1, for all of the solutions.Fabrication of gold NSUs on water grass
A 4 g sample of the water grass Bacopa carolinianais was immersed in 10 mL DI-water in tubes, and a series of gold colloids were added along with DI-water, filling up to 14 mL in the tubes. The Bacopa carolinianais samples were immersed in the liquid for five days, with eight hours of sunshine every day.Measurement
Au nanostructures were observed by transmission electron microscopy (TEM). The average size of Au NPs was measured using a zetasizer (Malvern, Trekintal Corporation, Taiwan). The fluorescent characteristics of the Au nanostructures were recorded at 285 nm excitation. The photoluminescence of Bacopa carolinianais was recorded at 285 and 395 nm excitations. The 395 nm excitation can produce photoluminescence of chlorophyll, while the 285 nm excitation cannot produce photoluminescence in visible light. The dark-field images of gold nanostructures on a Bacopa carolinianais leaf were recorded using a Cytovia OM and Olympus optical system with a 285 nm excitation (ultra-violet light) and a Xe-lamp visible light source.3. Results and discussion
3.1 Morphology, optical, and fluorescent properties of gold nanoparticles and NSUs
The TEM images show the morphology of Au nanostructures in Fig. 2. When adding NaCl(aq) solution, Au NPs are converted to a sea-urchin-like shape. The size of the NSUs increases as the amount of NaCl(aq) solution rises. We counted the size distribution via observation from TEM images, and although it was narrow, the number of Au NPs was not up to the thousands scale. To check this, we also used the zetasizer to measure the size distribution, and the results are shown in Fig. S2.† The average sizes of Au NPs and Au NSUs are 11, 25, 58, and 84 nm, respectively, which are in good agreement with the TEM observations in Fig. 2.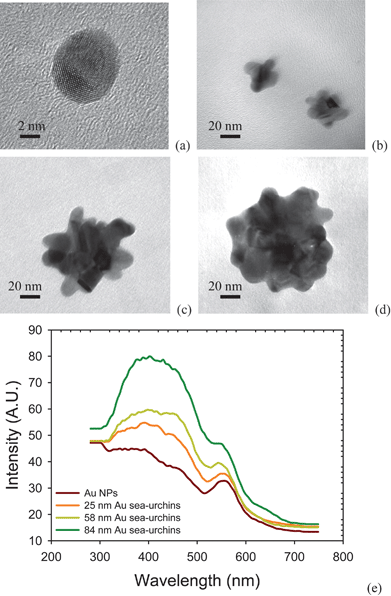 | ||
| Fig. 2 Morphology of (a) Au NPs, (b) 25 nm gold NSUs, (c) 58 nm gold NSU, (d) 84 nm gold NSU, and (e) photoluminescence of gold NPs and NSUs. As the size of NSU increases, so does the photoluminescent intensity. | ||
The absorption spectrum for Au NPs and Au NSUs is shown in Fig. S3.† The absorption peaks of the SPR for Au NPs and Au NSUs are around 540 nm in the visible light regime. As the size increases, the peaks of SPR will red-shift.20 The optical absorption of Au NPs and Au NSUs in the ultra-violet light regime is observed when the wavelength is less than 300 nm. This results is the transition from the deep d band to the sp band at the gamma point,11 as shown in Fig. 1.
The photoluminescence of gold NPs and NSUs is shown in Fig. 2(e). The gold nanostructures are radiated under a 285 nm ultraviolet light, and the photoluminescence ranges from 300 to 500 nm, with the peak at about 400 nm. This differs from the normal photoluminescence of gold NPs, which is usually at 750 nm.8 In our experiment, we keep the same concentration, 78.16 mg L−1, for all solutions, which produces the same total cross-sections for incident light. As the particle size increases, the SPR peak broadens, and the electric field of SPR then becomes weaker. In addition, as the size of NSUs increases, the SPR peak gets narrower and the electric field increases, as shown in Fig. S3(b).† Fig. S3(a) shows that the absorbance increases as the size of the Au NSUs rises. This indicates that the electronic transition rate from the deep d band to the sp band at the gamma point also increases, and thus photoluminescence intensity increases. Therefore, the bigger the NSUs, the stronger the photoluminescence intensities for NSUs at 400 nm. The photoluminescence tail which covers the 540 nm regime is also enhanced via SPR. The SPR of NSUs is stronger than that of Au NPs, and therefore we conclude that the photoluminescence of gold NPs is weak compared to that of the gold NSUs.
The fact that the intensity of the photoluminescence rises as the size of the NSU increases can be explained as follows. Photoluminescence is produced by the relaxation of electron-hole pairs,8 as shown in Fig. 1(c). There is another photoluminescence peak at 540 nm, which is the SPR peak according to both experimental19–21 and theoretical19,21 reports. In addition, SPR on the spines of the gold NSUs produces hot spots16–21 to enhance photoluminescence. Since the number of spines increases with the size of NSUs, the intensity of the photoluminescence also rises. Therefore, photoluminescence for gold NSUs of different sizes is emitted from the deep d band transition and is enhanced due to the SPR of the spines. The sizes of NSUs in our experiment are much larger than 3 nm. Zhu et al.28 reported that for gold, when the particle size is larger than 3 nm (thousands of gold atoms), the electronic structure is like a bulk electronic structure. Therefore, the optical properties of diameter-larger-than-3-nm gold NPs are close to these of bulk-like gold material. Similarly, the optical properties of NSUs are also close to those of bulk-like gold materials. The red shift increases with nanoparticle size due to the quantum size effect being weak. The peak of the PL for 25, 58, and 84 nm Au NSUs is 398.5, 400.1, and 400.4 nm, respectively. The quantum yield of the PL for bulk-like gold materials ranges from 10−4 to 10 − 5.12 The quantum yield of the PL of the gold NSUs is in the same order of magnitude.
The active efficiency (ratio between output power and input power) is measured by photoluminescence spectroscopy. The active efficiencies of the diameter-11-nm gold NPs, and the diameter-25 nm, diameter-58 nm, and diameter-84 nm Au NSUs at a temperature of 300 K with 285 nm light radiation are 0.476 × 10⁻⁴, 1.79 × 10⁻⁴, 2.69 × 10⁻⁴, and 4.56 × 10⁻⁴, respectively. This shows that the active efficiency increases as the intensity of SPR rises.
3.2 Emission intermittency of Au nanoparticles and Au NSUs
The emission trajectory from gold NPs and NSUs at a temperature of 300 K is shown in Fig. 3. The intensity of photoluminescence fluctuates with time. This indicates that blinking luminescence exists in the system of gold NPs and gold NSUs.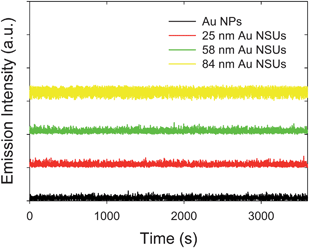 | ||
| Fig. 3 Time-dependent emission trajectory for the 11 nm Au NPs, 25 nm Au NSUs, 58 nm Au NSUs, and 84 nm Au NSUs, respectively. | ||
Observation of blinking for a single gold nanocluster on the substrate was reported in ref. 12, where the result was ascribed to the excited electron in the nanocluster being trapped by the environment. The single gold nanocluster is then charged, which results in the “off” state. Kawasaki et al.29 reported that they used dimethylformamide (DMF) as a surfactant to protect the gold nanocluster from oxidation, as this prevents the excited electron in the gold colloidal nanocluster from leaking to the environment, and helps the electron-hole recombination process to occur. They then observed non-blinking gold colloidal nanoclusters.
In our experiment, a single gold NSU in the solution is difficult to trap. We keep the same concentration, 78.16 mg L−1, for all solutions in order to control the same cross-section. Trisodium citrate acts not only as a surfactant, but also as a reduction agent,27 and can protect the gold nanocluster from oxidation. Therefore blinking-inhibited blue light is also observed, and this is in good agreement with the results by Kawasaki et al.29
The size of the micelles depends on the kind of the surfactant, solvent, and solute. Hence, the size distribution will not be very broad and it will be difficult to tune particle size under the same surfactant. If we replace the surfactant or solvent with materials in order to tune the size, the blinking condition will change, because it is very sensitive to the environment.13,32 Therefore we try to control a similar environment of Au NPs and tune the Au NSUs size. In addition, the SPR of NSUs is stronger than that of NPs due to “hot spots” on the spine, and these are used to investigate how SPR affects blinking phenomena.
The time-dependent probability densities of the “on” and “off” processes usually follow a universal exponential decay distribution.30 The electrons in Au NPs decay exponentially from the sp band to the deep d band, and lead to photon luminescence with the photon number N(t) = N0e−αt, where α is the decay constant. The probability density ρ(t) of photon luminescence is the photon number counted within the time period δt, and can be expressed as
 | (1) |
This can be referred to as a first-order reaction equation  , where
  is the reaction rate constant by the Arrhenius equation. Thus
  , where ΔEa is the activation threshold energy barrier, kB is the Boltzmann constant, T is the temperature and α0 = A. This shows that the α value is temperature-dependent. Therefore, we can measure the on-state and off-state time-dependent emission trajectories at different temperatures to obtain the temperature-dependent decay constant α.
The normalized the time-dependent probability distributions of the 11 nm Au NPs and the 25 nm, 58 nm, and 84 nm Au NSUs at 280 K, 290 K, 300 K, 310 K, and 315 K are shown in Fig. S4 and Fig. S5, respectively.† We plot ln αvia ln αN0 to confirm the first-order reaction model. The results are shown in the inserts of Fig. S4 and Fig. S5.† If the slope between ln α and ln αN0 is 1, the first-order reaction model is self-consistent. The slopes of the curve (ln αvs. ln αN0) for the 11 nm Au NPs and the 25 nm, 58 nm and 84 nm Au NSUs are 1.0525, 1.0881, 1.0817, and 1.050, respectively, for the on-state. On the other hand, the slopes for the off-state are 1.0799, 1.0777, 1.0045, and 1.0391, respectively. All the values of the slopes between the natural log slopes (lnα) and the intercept (lnαN0) are close to 1, which justifies the first-order reaction model. These results are also in good agreement with the universal exponential decay distribution for the blinking phenomenon.30
For the “on” or “off” processes, the reaction rates are related to the concentrations of electrons at EF, [e−EF], and holes at the deep d band, [hd+], before releasing photon or thermal energy. The total reaction constant is the sum of the reaction rate constants of the “on” and “off” processes due to the concurrent parallel reactions. The α value of the “on” and “off” processes from gold NPs and NSUs at 300 K is shown in Table. 1. In Table 1, we calculate the ratio of the “on” process reaction constant to the total process reaction constant,  . This ratio is larger than 50%. Furthermore, the ratio increases as the size of the Au NSUs rises.
 )a
)a
| k on | k off | k on + koff |
|
|
|
|---|---|---|---|---|---|
| a The total reaction rate constant is the sum of the “on” and “off” processes reaction constants due to the parallel reactions. The ratio of the “on” processes to the total reaction rate constant is above 0.5. The “on” process is the more preferred after applying SPR. | |||||
| 11 nm Au NPs | 1.090 | 1.032 | 2.122 | 0.514 | 0.486 |
| 25 nm Au NSUs | 1.135 | 1.058 | 2.193 | 0.518 | 0.482 |
| 58 nm Au NSUs | 1.152 | 1.068 | 2.220 | 0.519 | 0.481 |
| 84 nm Au NSUs | 1.193 | 1.081 | 2.274 | 0.525 | 0.475 |
In Table 2 we calculate the reaction energy barrier  . The absolute values of the activation energies can be obtained only by measuring the rate constants at different temperatures. We plot ln kvia the inverse temperature in Fig. S6,† and the slopes are the −ΔEa. The reaction energy barriers of the “on” and “off” processes from the gold NPs and NSUs are shown in Table. 2. The activation threshold energy barrier of the “off” process ranges from 20.5 up to 119.1 meV, while the activation threshold energy barrier of the “on” process is from 18.0 up to 102.0 meV. The energy barrier of ΔEaoff is thus higher than that of ΔEaon for both gold NPs and NSUs, as shown in Table 2. As the size of gold NSUs grows, the α value increases and the reaction energy barrier rises.
 ) (in meV)a
| “on” process | “off” process | |
|---|---|---|
| a As the size of Au NSUs increases, the reaction energy barriers of “on” and “off” processes also rise. The reaction energy barrier of the “off” process, an Auger process, is larger than that of the “on” process. | ||
| 11 nm Au NPs | 18.0 | 20.5 |
| 25 nm Au NSUs | 22.3 | 24.6 |
| 58 nm Au NSUs | 23.4 | 27.1 |
| 84 nm Au NSUs | 102.0 | 119.1 |
3.3 Influence of SPR on blinking intermittency—the reaction potential threshold model
The spines of the gold NSU produce hot spots due to SPR, and thus act as dipole nano-antennae.21 As the size of the gold NSU increases, the number of spines rises and provides a larger dipole field to enhance photoluminescence. The effect of the SPR strong electric field on the blinking intermittency can be understood by a simple reaction potential threshold model, as shown in Fig. 4. The electron energy potential at the EF and Γ points can be assumed to be a harmonic potential, and the high order term is considered as perturbation. For the “off” state, an electron at EF recombines with an electric hole in the deep d band. The energy difference between EF and the crossing point of these two harmonic potentials is the activation threshold energy barrier. The corresponding Hamiltonian at EF can be written as follows,where m is the electronic mass, K is the spring constant, p is the dipole moment, and E is the applied electric field. For metals, the dielectric constant is negative, as we can see from the Drude model, where ε(ω) = 1 − ω2p/ω2from which we have the susceptibility χ = ε − 1 = −ω2p/ω2 < 0. The direction of the induced dipole moment
 is opposite to that of the applied electric field in the quasi-static approximation. The energy potential,
  , is a positive value. Therefore, the energy potential increases as the applied electric field rises.
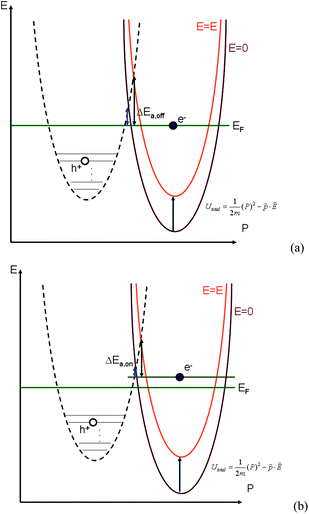 | ||
Fig. 4 Activation threshold energy barrier of an electron (a) at EF and (b) below EF after applying the electric field. The energy potential,  , is a positive value in the case of metal. , is a positive value in the case of metal. | ||
Since the SPR induces a strong electric field, the total energy potential will go up, as shown in Fig. 4(a). The activation threshold energy barrier of the electron-hole recombination will also rise. Furthermore, the larger the electric potential, the larger the activation barrier can be. As the size of the gold NSU increases, the activation threshold energy barrier increases as well, as shown in Table 2. The activation barrier for an electron in the “on” process is about 2∼7 meV, smaller than that in the “off” process, which is consistent with the reaction potential threshold model we proposed.
For the “on” process in Fig. 1(a), before recombination, the excited electron relaxes to an energy level above EF, as shown in Fig. 4(b), while for the “off” process in Fig. 1(b) the electron is still in the excited state, and the recombination process comes from the electron at EF, as shown in Fig. 4(a). Comparing Fig. 4(b) with Fig. 4(a), the activation barrier for an electron in the “on” process is smaller than that in the “off” process. This is also confirmed from our experimental data in Table 2. The activation barrier for an electron in the “on” process is ∼ 10 meV, smaller than that in the “off” process. In addition, as the applied electric field increases, the activation barrier will also increase, as indicated by the orange curve in Fig. 4. Therefore, for the “off” and the “on” step 2 processes in Fig. 1(a) and (b), both “on” and “off” processes are inhibited by SPR. However, the “on” process reaction is preferred for the total process. That is, the photon counts within a short time interval will decrease, while the photon counts within a longer time interval will increase. The blinking emission of gold NSUs is thus inhibited by SPR.
On the other hand, applying the reaction potential threshold model to the semiconductor quantum dot and molecular systems, the total energy potential and reaction potential threshold will go down after considering the strong SPR electric field due to the negative value of  as a result of the positive dielectric constant. When the reaction barrier decreases, the luminescence rate of the semiconductor quantum dot and molecular systems will increase. This explains why surface plasmon resonance can enhance the photoluminescence of semiconductor quantum dots and the fluorescence of the fluorophores.33,34
In the next section, we will show how gold NSUs colloids can be used to act as a blinking-inhibited blue light source for a secondly excited light device.
3.4 Photoluminescence of Bacopa caroliniana leaves
Bacopa caroliniana belongs to the Scrophulariaceae family, and is a bundle plant which is rich in chlorophyll. Chlorophyll absorbs most strongly in the violet-blue and red wavelength regime but poorly in the green, and hence the chlorophyll-containing tissues appear green, such as plant leaves. The absorption peaks of chlorophyll-a are at 665 and 430 nm. Fig. 5(a) presents the photoluminescence spectrum of Bacopa caroliniana leaves with 285 and 395 nm radiation. Fig. 5(a) shows that the photoluminescence intensity for Bacopa caroliniana leaves with 285 nm radiation cannot be observed in the visible regime. However, when the leaves are illuminated with 395 nm, a photoluminescence peak for chlorophyll at 670 nm is observed. When the excitation energy is larger than the band gap, electrons will transfer from an occupied molecular orbital state to an unoccupied one. Due to the near-field dipole–dipole interaction in the chlorophyll molecule, the bonds of the molecule will vibrate. Finally, the electron-hole pair recombines, and light is emitted. The energy-transfer process for excitation energy is called a Föster transfer process, which requires an excitation energy larger than the emission energy. On the other hand, when the excitation energy is much larger than the energy between the occupied and unoccupied molecular orbital states, the transition possibility of the electrons between these two states is low according to the Fermi golden rule. Therefore, it is difficult for 285 nm radiation to produce photoluminescence for chlorophyll in visible light. However, the photoluminescence of gold nanostructures appears at about 400 nm, as shown in Fig. 2(e). It is thus possible to use 285 nm UV radiation to first excite gold nanostructures and then excite the photoluminescence in chlorophyll.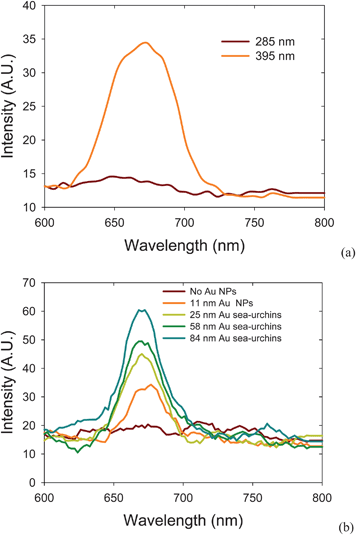 | ||
| Fig. 5 Photoluminescence of (a) Bacopa caroliniana leaf with 285 and 395 nm light and (b) Au NPs and NSUs on Bacopa caroliniana leaf with 285 nm light. When Bacopa caroliniana leaf radiates with 285 nm light, the leaf does not produce photoluminescence in the visible light regime. By radiating under ∼400 nm gold NSUs luminescence, the leaf can produce red light photoluminescence. | ||
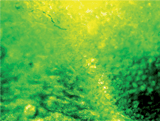
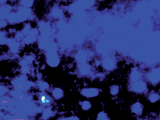
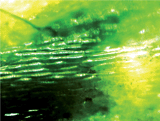
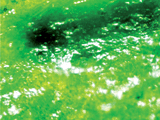
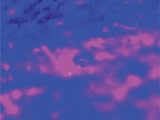
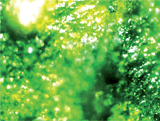
After immersing the Bacopa caroliniana leaves in gold colloid for five days, the images of Bacopa caroliniana leaves under white light and UV light (285 nm) captured with an Olympus optical system are shown in Table 3. The left-column images of Table 3 show that the gold nanostructures in Bacopa caroliniana leaves scatter strongly under white light radiation. The positions of gold nanostructures can be identified as the bright spots. The photoluminescence spectra of Bacopa caroliniana leaves with and without gold nanostructures under 285 nm radiation are shown in Fig. 5(b). When the Bacopa caroliniana leaves without gold spherical nanoparticles are illuminated using 285 nm ultraviolet light, bioluminescence of the plant is not observed. In addition, the chlorophyll fluorescence of the plant with gold spherical nanoparticles is weak. On the other hand, after immersing the leaves in Au NSU colloid, the bioluminescence of Bacopa caroliniana becomes observable. As the size of Au NSU increases, the intensity of bioluminescence gets stronger. In addition, the bioluminescence of Bacopa caroliniana appears near the positions of gold NSUs. The right-column images of Table 3 appear in blue and red color due to the photoluminescence of gold nanostructures and bioluminescence of Bacopa caroliniana, respectively.
| White light | UV light (285 nm) | |
|---|---|---|
| No Au NPs |

|

|
| 11 nm Au NPs |
|
|
| 25 nm Au NSUs |
|

|
| 58 nm Au NSUs |
|
|
| 84 nm Au NSUs |
|

|
The process for the photoluminescence of gold NSUs exciting the bioluminescence of Bacopa caroliniana is shown in Fig. 1(d). The active efficiency of gold NSUs is very low (10−4∼10−5). When gold NSUs are radiated under a higher frequency (wavelength ∼285 nm) multiphoton source, gold NSUs will emit lower frequency (wavelength ∼400 nm) blinking light with several single photons, and thus have a potential to act as a single-photon emitter in the fields of in vivo bio-LED and solar cells by optimizing the incident light intensity.
4. Conclusions
We found in the experiments that SPR on the spines of the gold NSUs produced hot spots to enhance photoluminescence and to inhibit blinking emission. The results are explained via the reaction potential threshold model. The emission of photon luminescnece is treated as a first order reaction model. The SPR intensity increases with the size of gold NSUs. This leads to an increase in the reaction potential barrier, and inhibits both the on and off processes. However, the on process has a smaller reaction barrier and thus leads to a higher probability density. Gold NSUs therefore emit blinking-inhibited blue light under ultraviolet radiation due to the transition between the deep d band and the sp band with one-photon excitation, such as with blue phospher powders. Gold NSU colloids can act as a blinking-inhibited blue light source to secondly excite a light device. Blinking-inhibited photoluminescence of the gold NSUs excites the fluorescence of chlorophyll in live Bacopa caroliniana when it contains gold NSU's, and thus functions as an in vivo bio-LED. The stronger the photoluminescence of the gold NSUs is, the stronger bioluminescence the Bacopa caroliniana can produce. The ameliorated emission intermittency of photoluminescence by surface plasmon resonances should have potential applications in the fields of bio-imaging, bio-LED, bio-labeling, nano-toxics, cytotoxicity and solar cells.References
- F. Hao, Y. Sonnefraud, P. Van Dorpe, S. A. Maier, N. J. Halas and P. Nordlander, Nano Lett., 2008, 8, 3983 CrossRef CAS.
- J. Maly, H. Lampova, A. Semeradtova, M. Stofik and L. Kovacik, Nanotechnology, 2009, 20, 385101 CrossRef CAS.
- J. P. Camden, J. A. Dieringer, Y. Wang, D. J. Masiello, L. D. Marks, G. C. Schatz and R. P. Van Duyne, J. Am. Chem. Soc., 2008, 130, 12616 CrossRef CAS.
- M. Zhu, C. M. Aikens, F. J. Hollander, G. C. Schatz and R. Jin, J. Am. Chem. Soc., 2008, 130, 5883 CrossRef CAS.
- H. B. Li, F. Y. Li, C. P. Han, Z. M. Cui, G. Y. Xie and A. Q. Zhang, Sens. Actuators, B, 2010, 145, 194 CrossRef.
- F. Z. Henari and A. A. Dakhel, J. Appl. Phys., 2008, 104, 033110 CrossRef.
- X. Y. Hu, Z. Y. Wang, T. C. Zhang, X. Y. Zeng, W. Xu, J. X. Zhang, J. Yan, J. P. Zhang and L. D. Zhang, Appl. Surf. Sci., 2008, 254, 3845 CrossRef CAS.
- A. Bouhelier, R. Bachelot, G. Lerondel, S. Kostcheev, P. Royer and G. P. Wiederrecht1, Phys. Rev. Lett., 2005, 95, 267405 CrossRef CAS.
- Y. Bao, C. Zhong, D. M. Vu, J. P. Temirov, R. B. Dyer and J. S. Martinez, J. Phys. Chem. C, 2007, 111, 12194 CrossRef CAS.
- J. Zheng, C. W. Zhang and R. M. Dickson, Phys. Rev. Lett., 2004, 93, 077402 CrossRef.
- D. J. Roaf, Philos. Trans. R. Soc. London, Ser. A, 1962, 255, 135 CrossRef CAS.
- C. T. Yuan, W. C. Chou, J. Tang, C. A. Lin, W. H. Chang, J. L. Shen and D. S. Chuu, Opt. Express, 2009, 17, 16111 CrossRef CAS.
- P. Frantsuzov, M. Kuno, B. Janko and R. A. Marcus, Nat. Phys., 2008, 4, 519 CrossRef.
- B. N. Khlebtsov, V. A. Khanadeev and N. G. Khlebtsov, J. Phys. Chem. C, 2008, 112, 12760 CrossRef CAS.
- H. L. Wu, C. H. Chen and M. H. Huang, Chem. Mater., 2009, 21, 110 CrossRef CAS.
- L. Wang, S. J. Guo, J. F. Zhai and S. J. Dong, J. Phys. Chem. C, 2008, 112, 13372 CrossRef CAS.
- S. J. Guo, L. Wang, S. J. Dong and E. K. Wang, J. Phys. Chem. C, 2008, 112, 13510 CrossRef CAS.
- P. Zhou, Z. H. Dai, M. Fang, X. H. Huang, J. C. Bao and J. F. Gong, J. Phys. Chem. C, 2007, 111, 12609 CrossRef CAS.
- K. F. Yu, K. L. Kelly, N. Sakai and T. Tatsuma, Langmuir, 2008, 24, 5849 CrossRef CAS.
- Y. H. Su, W. H. Lai, W. Y. Chen, M. H. Hon and S.-H. Chang, Appl. Phys. Lett., 2007, 90, 181905 CrossRef.
- O. M. Bakr, B. H. Wunsch and F. Stellacci, Chem. Mater., 2006, 18, 3297 CrossRef CAS.
- G. H. Jeong, Y. W. Lee, M. Kim and S. W. Han, J. Colloid Interface Sci., 2009, 329, 97 CrossRef CAS.
- C. L. Nehl and J. H. Hafner, J. Mater. Chem., 2008, 18, 2415 RSC.
- Y. H. Su, L. G. Teoh, S.-L. Tu, J.-H. Lee and M. H. Hon, J. Nanosci. Nanotechnol., 2009, 9, 196.
- L. Frolov, Y. Rosenwaks, S. Richter, C. Carmeli and I. Carmeli, J. Phys. Chem. C, 2008, 112, 13426 CrossRef CAS.
- C. Curutchet, A. Franceschetti, A. Zunger and G. D. Scholes, J. Phys. Chem. C, 2008, 112, 13336 CrossRef CAS.
- Y. H. Su, W. H. Lai, S.-H. Chang and M. H. Hon, J. Nanosci. Nanotechnol., 2007, 7, 3146 CrossRef CAS.
- M. Zhu, C. M. Aikens, F. J. Hollander, G. C. Schatz and R. Jin, J. Am. Chem. Soc., 2008, 130, 5883 CrossRef CAS.
- H. Kawasaki, H. Yamamoto, H. Fujimori, R. Arakawa, Y. Iwasaki and M. Inada, Langmuir, 2010 Search PubMed ASPS..
- M. Kuno, D. P. Fromm, H. F. Hamann, A. Gallagher and D. J. Nesbitt, J. Chem. Phys., 2000, 112, 3117 CrossRef CAS.
- T. Ozaki and H. Kino, Phys. Rev. B: Condens. Matter Mater. Phys., 2004, 69, 195113 CrossRef and http://www.openmx-square.org/..
- B. Mahler, P. Spinicelli, S. Buil, X. Quelin, J.-P. Hermier and B. Dubertret1, Nat. Mater., 2008, 7, 659 CrossRef CAS.
- T. Ming, L. Zhao, Z. Yang, H. J. Chen, L. D. Sun, J. F. Wang and C. H. Yan, Nano Lett., 2009, 9, 3896–3903 CrossRef CAS.
- Z. Yang, W. H. Ni, X. S. Kou, S. Z. Zhang, Z. H. Sun, L.-D. Sun, J. F. Wang and C.-H. Yan, J. Phys. Chem. C, 2008, 112, 18895–18903 CAS.
Footnote |
| † Electronic supplementary information (ESI) available: Time resolved photoluminescence of Au nanoparticles (Au NPs) and Au sea-urchin-shaped nanoparticles (Au NSUs); size distribution of Au nanoparticles (Au NPs) and Au sea-urchin-shaped nanoparticles (Au NSUs) obtained with a zetasizer; absorption spectrum for Au NPs and Au NSUs; normalized on-state probability distribution; rate constants of 11 nm Au NPs, 25 nm Au NSUs, 58 nm Au NSUs, and 84 nm Au NSUs at different temperatures. See DOI: 10.1039/c0nr00330a |
| This journal is © The Royal Society of Chemistry 2010 |


