Poly (acrylic acid)-capped lanthanide-doped BaFCl nanocrystals: synthesis and optical properties
Qiang
Ju
,
Wenqin
Luo
,
Yongsheng
Liu
,
Haomiao
Zhu
,
Renfu
Li
and
Xueyuan
Chen
*
Key Laboratory of Optoelectronic Materials Chemistry and Physics, Fujian Institute of Research on the Structure of Matter, Chinese Academy of Sciences, Fuzhou, Fujian 350002, China. E-mail: xchen@fjirsm.ac.cn; Fax: + 86 591 8764-2575; Tel: + 86 591 8764-2575
First published on 19th May 2010
Abstract
Water-soluble lanthanide-doped BaFCl nanophosphors with the surface functionalized by a layer of poly (acrylic acid) are synthesized via a facile one-step solvothermal method. Intense long-lived luminescence is realized from visible to near-infrared (NIR) by doping with different lanthanide ions. The emission and excitation spectra of Eu3+ indicate that the doped lanthanide ions occupy a site close to the surface of the nanoparticles. Strong NIR emissions of Nd3+ and green luminescence of Tb3+ using Ce3+ as sensitizers are also achieved in BaFCl nanoparticles. The synthesized nanoparticles featuring long-lived luminescence in either visible or NIR regions may have potential applications as luminescent labels for biological applications.
1. Introduction
The application of fluorescent labeling materials has greatly stimulated the study of complex biological interactions in the field of biology.1–5 The common fluorescent labeling materials such as organic dyes and quantum dots (QDs) have been applied in biological analyses.6,7 However, some limitations are inevitable for these kinds of materials. For example, most organic dyes exhibit weak photostability and broad emission bands, while various semiconducting QDs might suffer from potential toxicity, chemical instability, short luminescence lifetimes, or photoblinking. As an alternative to dyes and QDs, trivalent lanthanide (Ln3+) doped nanoparticles have been proposed as a new class of biological fluorescent labeling due to their attractive optical and chemical features.8–10 First, they inherit the advantages of a rigid crystal environment for the doped Ln3+ ions. Second, the interference from spontaneous background emission sources can be avoided by utilizing the inherent long-lived luminescence lifetimes (μs–ms range). Moreover, the spectroscopic selectivity of the nanoparticles can be extended beyond the range of interferences from biological systems by means of doping with different Ln3+ ions. All these optical merits enable the material to be used as an excellent candidate in the biological field.Generally, to achieve highly efficient radiative emissions of the Ln3+ ions, the competitive phonon-assisted non-radiative transitions should be inhibited to the utmost, which require a low phonon frequency host for the Ln3+ ions. BaFCl is such kind of material as a fluorescent host matrix owing to its low vibrational energies (294 cm−1).11 In addition, the stable physical and chemical properties of BaFCl, particularly in aqueous solution, facilitate its further application as biological labels. Recently, we have synthesized Eu3+-doped BaFCl powders that yielded strong red emissions of Eu3+.12 Nevertheless, the obtained particles are too large to be used as biological labels which require that the nanoparticles are small in size (<50 nm), possess hydrophilic properties and a modified surface to provide the anchoring sites for further linking with biomolecules.13 To date, various approaches have been applied to synthesize the monodispersed small size nanoparticles. However, most of them are non-hydrophilic and can not be directly applied in biological detection.14 Although the surface modification or lipid encapsulation can transfer the hydrophobic products from non-polar solvents to water and modify their surface with terminal groups (e.g., carboxylic, amino, thiol/maleimide),15–18 they still suffer from problems including tedious procedures, unavoidable adsorption and random immobilization, and complicated experimental conditions. Therefore, a facile one-step synthesis of the small-size, water-soluble, and surface-functionalized nanoparticles under common experimental conditions, have attracted considerable interest in recent years.19 Water-soluble and biocompatible LaF3:Eu3+, Fe3O4, and LaPO4:Ce3+/Tb3+ nanoparticles have been prepared through a one-step route.20–23 To our knowledge, there is no report on the synthesis of water-soluble and surface-functionalized Ln3+-doped BaFCl nanoparticles before this study.
Herein, we report on the synthesis of water-soluble and carboxylic acid functionalized BaFCl nanoparticles through a facile one-step solvothermal method with polyelectrolyte and poly (acrylic acid) (PAA) as a capping agent. By doping different Ln3+ ions, red (Eu3+), green (Ce3+/Tb3+), and near-infrared (Nd3+) emissions are obtained. These results reveal that Ln3+-doped BaFCl nanoparticles might have potential applications as efficient luminescent labels for biological imaging and immunoassays.
2. Experimental
2.1. Sample preparation
The water-soluble and PAA-coated Ln3+-doped BaFCl nanoparticles were synthesized by a solvothermal method. 0.9 g PAA (MW = 1800), 1 mmol BaCl2·2H2O and the required amount of LnCl3·6H2O (Ln = Eu, Ce, Tb, Nd) were dissolved in 30 mL ethylene glycol and stirred at room temperature (RT) for several minutes to afford a transparent solution. Another solution of 1 mmol NH4F in 10 mL ethylene glycol was then added dropwise to BaCl2 solution. The mixed transparent solution was stirred for another 10 min, then transferred into a 50 mL autoclave and solvothermally heated at 180 °C for 10 h. After cooling to RT, the resulting solution was acidified with dilute HCl solution, and centrifuged at 9000 r/min for 4 min to separate the solid powder products. The crude precipitate was continuously washed several times with distilled water and absolute ethanol in turn, and dried under vacuum at 50 °C for 4 h to yield the white final products.2.2. Characterization
The powder X-ray diffraction (XRD) pattern of the sample was measured using a PANalytical X'Pert PRO powder diffractometer with Cu-Kα1 radiation (λ = 0.154 nm). The morphology and chemical compositions of the sample were investigated by a JEOL-2010 transmission electron microscope (TEM) equipped with the energy dispersive X-ray spectrum (EDS). Fourier transform infrared (FT-IR) spectra were recorded on a Magna 750 FT-IR spectrophotometer in the range of 400–4000 cm−1. Thermal stability studies (30–1200 °C) were carried out on a NETSCHZ STA-449C thermoanalyzer under N2 atmosphere at a heating rate of 10 °C min−1. Emission and excitation spectra and transient decays were recorded on an Edinburgh Instruments FLS920 spectrofluorimeter equipped with both continuous (450 W) and pulsed xenon lamps. Laser spectroscopic measurements were carried out upon excitation by a mode-locked picosecond Ti:sapphire laser (700–1000 nm, pulse width ≤ 1.5 ps, Tsunami, Spectra-Physics) at RT. The near-infrared (NIR) decay was measured with a customized UV to mid-infrared steady-state and phosphorescence lifetime spectrometer (FSP920-C, Edinburgh) equipped with a digital oscilloscope (TDS3052B, Tektronix) and a tunable mid-band OPO pulse laser as the excitation source (410–2400 nm, 10 Hz, pulse width ≤ 5 ns, Vibrant 355II, OPOTEK). Photoluminescence (PL) photographs of the nanoparticles in aqueous solution were taken with Sony digital single lens reflex D100.3. Results and discussion
3.1. Synthesis and structure characterization
Fig. 1(a) shows the XRD pattern of the as-obtained BaFCl:Eu3+ nanoparticles, as well as the standard diffraction lines of tetragonal BaFCl crystals (JCPDS card No. 76-1368). The diffraction peaks of BaFCl:Eu3+ (2 at.%) nanoparticles (the upper line) can be well indexed to the pure tetragonal BaFCl phase as shown in the bottom line of Fig. 1(a), and no trace of characteristic peaks was observed for other impurity phases such as BaF2 or EuF3, showing that the one-step synthesis route is a feasible way for preparing pure phase BaFCl nanoparticles. The mean size of the nanoparticles was calculated to be ∼25 nm by the Debye–Scherrer formula. As shown in the inset of Fig. 1(a), the BaFCl nanoparticles can be readily dispersed in water as a result of the PAA modification, which keep stable at the pH range from 4 to 14, similar to the previous report on PAA-capped Fe3O4 nanoparticles.21 From the TEM image (Fig. 1(b)), it can be seen that the BaFCl:Eu3+ nanoparticles are roughly grain-like with the diameter ranging from 20–40 nm. Noticeably, there is a clear layer with a thickness of 5–15 nm capping on the nanoparticles, which is attributed to the PAA coating. There was little change in the surface layer even after it was washed ten times with absolute ethanol, showing strong combination of PAA onto the nanoparticles. The selected area electron diffraction (SAED) rings in Fig. 1(d) exhibit the polycrystalline nature of BaFCl:Eu3+ nanoparticles, and can be indexed to diffractions from the (002), (200), and (211) planes of the tetragonal matlockite structure in turn, in accordance with the above XRD analysis. It should be mentioned that the nanoparticles doped with different Ln3+ ions exhibit essentially the same crystal phase and morphology. The EDS measurement (Fig. 1(c)) verifies the existence of Ba, F, Cl and Eu in BaFCl:Eu3+ nanoparticles.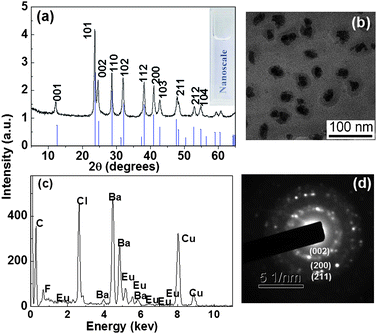 | ||
| Fig. 1 (a) XRD pattern of BaFCl:Eu3+ nanoparticles (the upper line) and standard data for tetragonal BaFCl crystals (JCPDS No. 76-1368, the bottom line); (b) TEM image, (c) EDS and (d) SAED patterns of BaFCl:Eu3+(2 at.%) nanoparticles. The inset of Fig. 1(a) is the photograph of BaFCl nanoparticles in aqueous solution. | ||
To further confirm the coating of PAA on the surface of nanoparticles, the FT-IR absorption spectra of both BaFCl nanoparticles and pure PAA were measured. As shown in Fig. 2(a), four peaks located at 2951, 1737, 1456 and 1407 cm−1 were observed in the pure PAA sample which can be assigned to characteristic absorption bands of PAA, corresponding to the stretching and bending modes of CH2, stretching modes of C![[double bond, length as m-dash]](https://www.rsc.org/images/entities/char_e001.gif) O and C–O in COOH group, respectively.21 For the BaFCl nanoparticles, these four peaks can also be observed, clearly indicating that a large amount of PAA was capped on the surfaces of the nanoparticles. Besides, a new distinguishable band at 1556 cm−1 was observed, which is attributed to the C–O stretching mode of carboxylic groups deriving from the COO− groups that coordinate to cations (i.e., Ba2+) on the surface of BaFCl nanoparticles. As schematically illustrated in Fig. 3, the carboxylic groups on the PAA chains strongly coordinate to Ba2+ on the nanoparticle surface to form a robust coating, while uncoordinated carboxylic groups extend into the aqueous solution, endowing the nanoparticles with high dispersibility in water. Meanwhile, a large number of uncoordinated carboxylic groups on the nanoparticle surfaces can be used for the further conjugation of biomolecules. To investigate the PAA coating efficiency, thermogravimetric analysis was conducted. As shown in Fig. 2(b), the weight loss of ∼4 wt.% in the initial step from 30 to 200 °C resulted from the evaporation of water and other solvent residuals, while the major weight loss of ∼16 wt.% ranging from 200 to 600 °C was induced by the decomposition of PAA, in agreement with previous reports.18,24 The mass losses confirm the surface functionalization of PAA on BaFCl nanoparticles.
O and C–O in COOH group, respectively.21 For the BaFCl nanoparticles, these four peaks can also be observed, clearly indicating that a large amount of PAA was capped on the surfaces of the nanoparticles. Besides, a new distinguishable band at 1556 cm−1 was observed, which is attributed to the C–O stretching mode of carboxylic groups deriving from the COO− groups that coordinate to cations (i.e., Ba2+) on the surface of BaFCl nanoparticles. As schematically illustrated in Fig. 3, the carboxylic groups on the PAA chains strongly coordinate to Ba2+ on the nanoparticle surface to form a robust coating, while uncoordinated carboxylic groups extend into the aqueous solution, endowing the nanoparticles with high dispersibility in water. Meanwhile, a large number of uncoordinated carboxylic groups on the nanoparticle surfaces can be used for the further conjugation of biomolecules. To investigate the PAA coating efficiency, thermogravimetric analysis was conducted. As shown in Fig. 2(b), the weight loss of ∼4 wt.% in the initial step from 30 to 200 °C resulted from the evaporation of water and other solvent residuals, while the major weight loss of ∼16 wt.% ranging from 200 to 600 °C was induced by the decomposition of PAA, in agreement with previous reports.18,24 The mass losses confirm the surface functionalization of PAA on BaFCl nanoparticles.
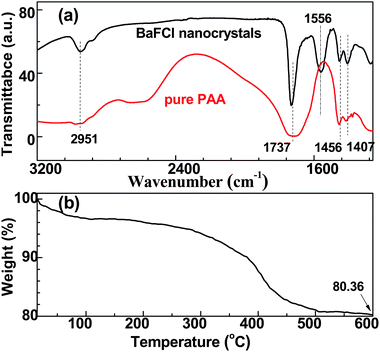 | ||
| Fig. 2 (a) FT-IR spectra of PAA-capped BaFCl nanoparticles (black) and pure PAA (red); (b) thermogravimetric curve of PAA-capped BaFCl nanoparticles. | ||
 | ||
| Fig. 3 Schematic illustration of PAA-coated BaFCl nanoparticles. Partial carboxylic groups bind to the nanoparticle surface and the others extend into the surrounding water, rendering the nanoparticles water-soluble. | ||
3.2. Optical properties
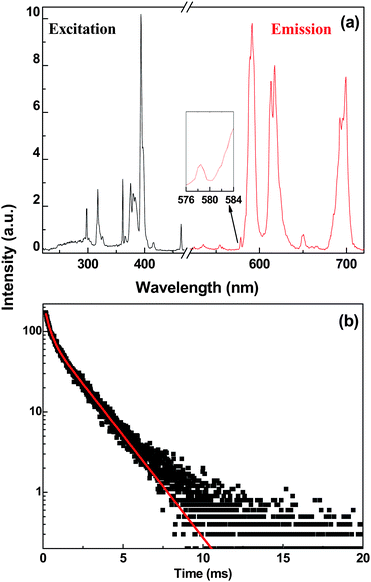 | ||
| Fig. 4 (a) The excitation (left, λem = 591 nm) and emission (right, λex = 394 nm) spectra and (b) decay curve of BaFCl:Eu3+ (2 at.%) nanoparticles in aqueous solution. The inset of Fig. 4(a) enlarges the spectral region of the 5D0 → 7F0 transition at 578.5 nm. | ||
Fig. 4(b) shows the luminescence decay of Eu3+ by monitoring the 5D0 → 7F1 transition at 591 nm under the direct excitation to the 5L6 state at 394 nm. The luminescence decay of 5D0 deviates significantly from a single exponential function, which is presumably due to the energy transfer process from Eu3+ to the neighboring surface defects, very different from the observation for larger nanocrystals previously reported.12 The decay curve was fitted with double exponential function, giving rise to a longer lifetime of 1.70 ms (78%) and a shorter one of 0.29 ms (22%). The longer lifetime is slightly larger than that of BaFCl:Eu3+ nanopowders (1.4 ms for Eu3+ at site A close to the surface in aqueous solution), which may be caused by the smaller effective index of refraction for smaller particles as often observed in Eu3+-doped nanoparticles.25
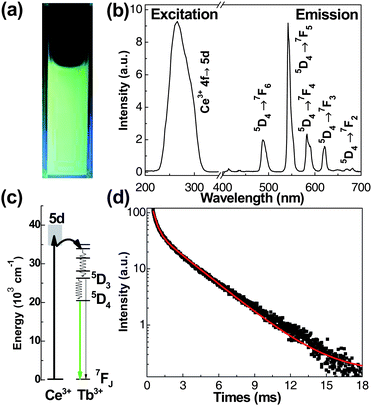 | ||
| Fig. 5 (a) PL photograph of BaFCl:Ce3+ (3 at.%), Tb3+(1 at.%) nanoparticles in aqueous solution under irradiation at 254 nm with a 4 W hand-held UV lamp; (b) the excitation (left, λem = 542 nm) and emission (right, λex = 265 nm) spectra of the sample; (c) energy level scheme of Ce3+ and Tb3+ ions and energy transfer process; (d) PL decay from 5D4 of Tb3+ ions under excitation at 265 nm. | ||
It is well known that for biological labeling, green emissions of Tb3+ under UV excitation would inevitably suffer from the interference of scattered lights and short-lived autofluorescence from cells and tissues, which result in a lower signal-to-noise ratio.28 To completely avoid such interferences and improve the detection sensitivity, the technique of time-resolved (TR) luminescence detection combined with the long-lived luminescence species has been employed.9 To prove the feasibility of BaFCl:Ce3+,Tb3+ nanoparticles in TR detection, the luminescence decay of the 542 nm emission was measured under the excitation at 265 nm (Fig. 5(d)). Similar to that of Eu3+ ions, the decay curve can also be fitted with a biexponential function, and the fitted lifetimes were 2.54 (60%) and 0.32 ms (40%), respectively. Likewise, the short component of PL lifetime may be induced by the non-radiative energy transfer from Tb3+ to the surface defects. The PL lifetime of Tb3+ is much longer than that of autofluorescence and scattering lights that last only several nanoseconds, thus the short-lived background luminescence can be effectively inhibited if a proper delay time is set in the TR detection.
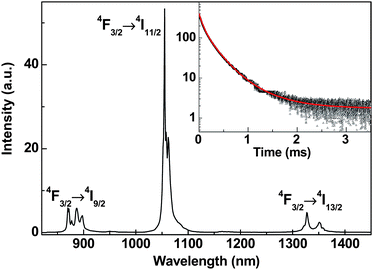 | ||
| Fig. 6 RT emission spectrum of BaFCl:Nd3+ (1 at.%) under laser excitation at 808 nm. The inset shows the PL decay from 4F3/2 of Nd3+ under the excitation at 808 nm. | ||
4. Conclusions
A simple one-step solvothermal method by employing PAA as a capping agent has been developed to synthesize water-soluble and surface-functionalized BaFCl:Ln3+ nanoparticles. The synthesized nanoparticles are well dispersed with a size of 20–40 nm, and their surfaces were effectively capped with the PAA layer having a thickness of 5–15 nm. Through doping different lanthanide ions, intense and long-lived red, green, and NIR emissions have been realized. By means of Eu3+ as a probe, we conclude that the doped Eu3+ ions occupy a distorted lattice site close to the surface. Intense green luminescence of Tb3+ sensitized by Ce3+ and NIR emissions of Nd3+ have been observed for the first time in BaFCl nanoparticles. The Ln3+-doped BaFCl nanoparticles featuring excellent water dispersibility, surface functionalization, intense and long-lived red, green and NIR luminescence, are highly promising for applications in fluorometric immunoassay, DNA hybridization, and bioimaging.Acknowledgements
This work is supported by the Hundreds of Talents and Knowledge Innovation Programs of the Chinese Academy of Sciences (CAS) for Key Topics (No. KJCX2-YW-358) and Young Scientists, Instrument Developing Project of CAS (No. YZ200712), the NSFC (Nos. 10804106 and 10974200), the 973 and 863 programs of MOST (Nos. 2007CB936703 and 2009AA03Z430), Fujian Provincial Science Fund for Distinguished Young Scholars (No. 2009J06030), and the Key Project of Science and Technology Foundation of Fujian Province (No. 2007I0024).Notes and references
- E. Schrock, S. duManoir, T. Veldman, B. Schoell, J. Wienberg, M. A. FergusonSmith, Y. Ning, D. H. Ledbetter, I. BarAm, D. Soenksen, Y. Garini and T. Ried, Science, 1996, 273, 494 CAS.
- P. R. Diamente and F. C. J. M. van Veggel, J. Fluoresc., 2005, 15, 543 CrossRef CAS.
- L. Y. Wang, R. X. Yan, Z. Y. Hao, L. Wang, J. H. Zeng, H. Bao, X. Wang, Q. Peng and Y. D. Li, Angew. Chem., Int. Ed., 2005, 44, 6054 CrossRef CAS.
- F. Wang, W. B. Tan, Y. Zhang, X. P. Fan and M. Q. Wang, Nanotechnology, 2006, 17, R1 CrossRef.
- P. S. Ghosh, C. K. Kim, G. Han, N. S. Forbes and V. M. Rotello, ACS Nano, 2008, 2, 2213 CrossRef CAS.
- L. Wang and W. H. Tan, Nano Lett., 2006, 6, 84 CrossRef CAS.
- J. Kim, Y. Piao and T. Hyeon, Chem. Soc. Rev., 2009, 38, 372 RSC.
- F. Wang, X. J. Xue and X. G. Liu, Angew. Chem., Int. Ed., 2008, 47, 906 CrossRef CAS.
- J. C. G. Bunzli and C. Piguet, Chem. Soc. Rev., 2005, 34, 1048 RSC.
- F. Wang and X. G. Liu, J. Am. Chem. Soc., 2008, 130, 5642 CrossRef CAS.
- X. Y. Chen, W. Zhao, R. E. Cook and G. K. Liu, Phys. Rev. B: Condens. Matter Mater. Phys., 2004, 70, 205122 CrossRef.
- Q. Ju, Y. S. Liu, R. F. Li, L. Q. Liu, W. Q. Luo and X. Y. Chen, J. Phys. Chem. C, 2009, 113, 2309 CrossRef CAS.
- M. N. Christof, Angew. Chem., Int. Ed., 2001, 40, 4128 CrossRef CAS.
- Z. Q. Li, Y. Zhang and S. Jiang, Adv. Mater., 2008, 20, 4765 CrossRef CAS.
- M. Wang, C. C. Mi, W. X. Wang, C. H. Liu, Y. F. Wu, Z. R. Xu, C. B. Mao and S. K. Xu, ACS Nano, 2009, 3, 1580 CrossRef CAS.
- D. Y. Kong, Z. L. Wang, C. K. Lin, Z. W. Quan, Y. Y. Li, C. X. Li and J. Lin, Nanotechnology, 2007, 18, 075601 CrossRef.
- Z. Tang, Y. Wang, P. Podsiadlo and N. A. Kotov, Adv. Mater., 2006, 18, 3203 CrossRef CAS.
- T. R. Zhang, J. P. Ge, Y. P. Hu and Y. D. Yin, Nano Lett., 2007, 7, 3203 CrossRef CAS.
- F. Wang, Y. Zhang, X. P. Fan and M. Q. Wang, Nanotechnology, 2006, 17, 1527 CrossRef CAS.
- P. R. Diamente, R. D. Burke and F. C. J. M. van Veggel, Langmuir, 2006, 22, 1782 CrossRef CAS.
- J. P. Ge, Y. X. Hu, M. Biasini, C. L. Dong, J. H. Guo, W. P. Beyermann and Y. D. Yin, Chem.–Eur. J., 2007, 13, 7153 CrossRef CAS.
- L. Y. Wang, J. Bao, L. Wang, F. Zhang and Y. D. Li, Chem.–Eur. J., 2006, 12, 6341 CrossRef CAS.
- J. Q. Gu, J. Shen, L. D. Sun and C. H. Yan, J. Phys. Chem. C, 2008, 112, 6589 CrossRef CAS.
- S. M. Chen, G. Z. Wu, Y. D. Liu and D. W. Long, Macromolecules, 2006, 39, 330 CrossRef CAS.
- J. W. Stouwdam and F. C. J. M. van Veggel, Nano Lett., 2002, 2, 733 CrossRef CAS.
- J. C. Boyer, J. Gagnon, L. A. Cuccia and J. A. Capobianco, Chem. Mater., 2007, 19, 3358 CrossRef CAS.
- F. Wang, Y. Zhang, X. P. Fan and M. Q. Wang, J. Mater. Chem., 2006, 16, 1031 RSC.
- J. C. G. Bunzli, Chem. Lett., 2009, 38, 104 CrossRef CAS.
| This journal is © The Royal Society of Chemistry 2010 |
