Lifespan-on-a-chip: microfluidic chambers for performing lifelong observation of C. elegans†
S. Elizabeth
Hulme
a,
Sergey S.
Shevkoplyas
ab,
Alison P.
McGuigan
a,
Javier
Apfeld
c,
Walter
Fontana
c and
George M.
Whitesides
*a
aDepartment of Chemistry and Chemical Biology, Harvard University, 12 Oxford St, Cambridge, MA 02138, USA. E-mail: gwhitesides@gmwgroup.harvard.edu
bDepartment of Biomedical Engineering, Tulane University, 624 Lindy Boggs Building, New Orleans, LA 70118, USA
cDepartment of Systems Biology, Harvard Medical School, 200 Longwood Ave., Boston, MA 02115, USA
First published on 18th December 2009
Abstract
This article describes the fabrication of a microfluidic device for the liquid culture of many individual nematode worms (Caenorhabditis elegans) in separate chambers. Each chamber houses a single worm from the fourth larval stage until death, and enables examination of a population of individual worms for their entire adult lifespans. Adjacent to the chambers, the device includes microfluidic worm clamps, which enable periodic, temporary immobilization of each worm. The device made it possible to track changes in body size and locomotion in individual worms throughout their lifespans. This ability to perform longitudinal measurements within the device enabled the identification of age-related phenotypic changes that correlate with lifespan in C. elegans.
Introduction
Certain experiments require that the identity of each animal be maintained for the duration of the experiment in order to study changes in a phenotype over time, and to determine the relationships among different phenotypes. This paper describes the development of a microfluidic device that enables such experiments in the nematode C. elegans. The device comprises (i) an array of chambers for confining individual worms, (ii) a network of microfluidic channels for delivering bacterial food (suspended Escherichia coli) to, and removing waste from, the chambers, and (iii) (optionally) wedge-shaped channels, or “worm clamps”1 (one per chamber) for reversibly immobilizing worms for imaging or laser-mediated microsurgery.2The device enables two modes of observation and thus facilitates long-term observation of a broad range of behavioral and physiological phenotypes. First, the chambers facilitate the observation of behavior because confinement within the chambers ensures that worms do not exit the field of view during examination, but does not prevent worms from performing normal swimming motions. Second, the adjoining worm clamps provide a non-invasive method for reversibly immobilizing C. elegans, and thus allow repeated examination of the worms at high magnification—at least 400×, including eyepiece magnification—throughout their lifetimes.
The device also enables the longitudinal study of individual animals. The ability to confine worms in separate chambers automatically preserves their identities over their entire lives. By enabling repeated measurements of the behavioral and physiological traits of an individual, the device facilitates the observation of changes in phenotype in individuals over time or in response to a stimulus, and thus makes possible the study of the natural variation in such changes in a population of animals. Longitudinal measurements are useful in the study of aging, which in C. elegans involves a number of phenotypic changes, including a loss of reproductive capacity, a reduction in overall body movement, and a decrease in the frequency of pharyngeal pumping.3 Animals of the same genotype may age at different rates;4 by examining in individual animals how different age-related phenotypes correlate with each other and with lifespan, it may be possible to establish predictive relationships between age-related changes in phenotype and lifespan.4 The existence of correlations between age-related phenotypes indicates that there are processes responsible for those dependencies; the identification of such dependencies may eventually help us to gain a better understanding of the process of aging.
In order to perform longitudinal studies, researchers typically maintain and observe individual worms on separate agar-filled Petri dishes.4–8 Each worm is transferred to a fresh Petri dish every day during the period of reproduction in order to distinguish the worm from its progeny. Lifelong longitudinal experiments involving more extensive manipulation of the worm—such as exposure to chemical stimuli, immobilization, or imaging at high magnification—are experimentally more challenging, and therefore rarer in the literature.9
A growing number of microfluidic tools are available for manipulating and observing worms. These tools include: microfluidic devices for immobilizing live worms to enable high-throughput, high-resolution imaging and laser-mediated microsurgery;1,10–14 an optofluidic microscope for high-resolution imaging of paralyzed worms;15 microfluidic methods of delivering chemical stimuli to partially restrained worms, in order to perform behavioral assays;16–18 a device patterned with “artificial soil” to facilitate the delivery of dissolved chemical stimuli of crawling worms;19 a microfabricated maze for examining behavior;20 a droplet-generator, which encapsulates worms within droplets for individual examination;21 and microfluidic devices for performing long-term culture of large populations of C. elegans for the study of C. elegans in space flight in Earth's orbit.22,23
To date, there has been no demonstration of a microfluidic method for performing lifelong observation of individual worms. In order to facilitate longitudinal experiments with many individual worms, we have developed a device for housing individual worms in separate microfabricated chambers. The device consists of 16 chambers—with adjacent worm clamps1 for temporary immobilization—which are individually addressable via microfluidic channels. We used the device to track age-related changes in body size and swimming behavior for individual worms over their entire adult lifespans. These longitudinal measurements enabled us to identify features of aging in C. elegans that correlate with lifespan.
Results and discussion
Design of an array of confinement chambers
Fig. 1a shows a schematic illustration of a single confinement chamber with an adjacent worm clamp. The circular chamber has a diameter of 1.5 mm; this size provides sufficient room for a worm to swim, but is small enough to confine a worm to an area that fits within the field of view of a microscope with moderate (5×) magnification. To enable temporary immobilization of the confined worms, we introduced a microfluidic worm clamp (the tapered channel located to the left of the chamber in Fig. 1a, upper panel) into the design. For experiments in which immobilization was not necessary, the clamp was omitted from the design of the device (Fig. 1a, lower panel). Fig. 1b shows the design of the microfluidic array of 16 chambers and clamps. The branching network of delivery channels makes it possible to introduce a fluid, such as a suspension of bacteria, into the device at a single point—the inlet of the device. The design contains two outlets: a “bypass outlet,” which connects to the inlet directly (via a ∼1 cm long microchannel) and helps to prevent clogging of the device (discussed in detail below), and a “network outlet,” which provides a point of exit from the device for fluid that has passed through the network of chambers and clamps.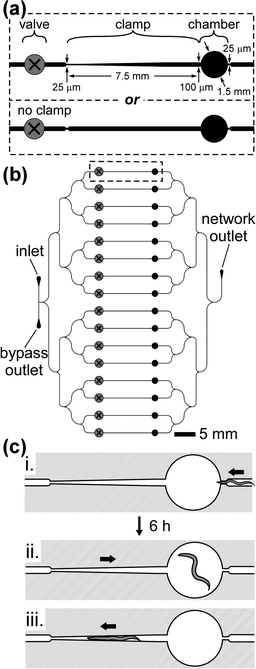 | ||
| Fig. 1 Design of the microfluidic array of chambers and clamps. (a) Design of a single circular chamber and adjoining clamp (upper panel). The diagram specifies the dimensions of the design. For experiments that did not require periodic immobilization, we used a design that did not include the tapered clamp (lower panel). (b) Design of an array of 16 chambers. The dashed rectangle indicates the location of the features described in (a). A network of branching distribution channels delivers a suspension of E. coli from the inlet, through the chambers, and to the outlet. The bypass outlet enables the removal of sedimented bacteria from the inlet. The presence of a screw valve in each branch of the network enables each chamber and clamp to be fluidically isolated. (c) (i) Loading the worm into the chamber. The width of the microchannel directly to the right of the chamber is just wide enough to allow the passage of a worm in the early stage of L4 into the chamber. The arrow indicates the direction of flow. (ii) After approximately 6 h at 24 °C, the worm becomes too large to fit within the microfluidic channels, and thus continuous flow of liquid through the chamber may commence. Continuous flow of a suspension of bacteria from left to right provides food to the worm and prevents the worm from entering the clamp. (iii) By reversing the direction of flow from right to left, we directed the worm into the clamp for temporary immobilization. | ||
As Fig. 1b shows, each branch of the array contains a prefabricated screw valve.24,25 Prefabricated valves are fabricated ahead of time in large quantities, and then embedded into microfluidic devices during the casting of the master.25 A screw valve consists of a small machine screw embedded in a device above a microfluidic channel. Clockwise rotation of the screw results in the compression—and closure—of the underlying channel. Counterclockwise rotation of the screw reopens the channel.24 The valves enable fluidic isolation of each chamber. For example, if valves 2–16 were closed, flow through chamber 1 would not disturb the positions of the other worms in the array.
Fabrication and assembly of the device
We fabricated the devices in poly(dimethylsiloxane) (PDMS) using soft lithography.26–29 PDMS is a useful material for the construction of devices that are compatible with living organisms because it is relatively mechanically compliant, permeable to oxygen and carbon dioxide, and non-toxic.28,30 In addition, because PDMS is optically transparent at wavelengths above 230 nm,29 it is compatible with bright-field and fluorescence imaging.When we did not include worm clamps (see Fig. 1a), we fabricated the devices with features that were uniformly 100 µm in height—sufficiently tall for the worms to move freely within the chambers. When we included the clamps, we fabricated the devices such that the clamps (and the network of delivery channels) were 50 µm in height. This height ensured that the movement of worms would be restricted in the vertical direction within the clamps.1 It was necessary, however, to increase the height of the chambers in these clamp-containing devices because a height of 50 µm would have hindered the ability of the worms to swim freely within the chamber. We modified the chambers to be dome-shaped, with a height of approximately 290 µm (see Experimental). To assemble the devices, we exposed them to an oxidizing plasma and sealed them to a PDMS-coated glass slide that had also been exposed to an oxidizing air plasma.
An essential element in the long-term culture of C. elegans in a microfluidic device is the maintenance of a continuous flow of suspended bacteria through the device. Adsorption of bacteria to the walls of the device can interfere with flow and also obscures the observation of the worms. Immediately after sealing each device to a PDMS-coated glass substrate, we coated the walls of the device with (2-[methoxy(polyethyleneoxy)6–9 propyl]) trimethoxysilane (mPEG-silane) to reduce bacterial adsorption31 (see Experimental for details).
Loading worms into the confinement chambers
We prepared synchronous populations of worms by transferring 10 gravid adults to a Petri dish containing NGM seeded with E. coli, and incubating the worms for 1 h at 24 °C. During this period, each worm laid approximately 5–10 eggs. We then removed the adults from the plate, leaving behind a population of eggs at approximately the same developmental stage.32 The day of egg laying was defined as day 0 of the experiment. We loaded worms into the confinement chambers on day 2 (40 h, at 24 °C, after egg laying), when the worms were at the beginning of the fourth larval stage (L4), and were approximately 25 µm in width.Fig. 1c illustrates the process of loading an L4 worm into the chamber. Directly to the right of the chamber, the width of the microfluidic channel narrows to 25 µm. This width provides a means for trapping worms within the chamber: the 25 µm orifice is just wide enough to allow passage of the body of a worm in early L4 when the worm is carried through by the flow of fluid, but is too narrow for the worm to swim through and escape in the absence of flow. We chose to load worms into the chambers as L4s, because the rate of growth is highest during this stage: at 24 °C, the body of the worm doubles in width, from 25 µm to 50 µm, within 12 h.33 6 h after loading the worm into the chamber, the worm becomes too large to fit through the orifice, even in the presence of fluid flow (Fig. 1c, ii).
Immediately before loading the chambers with worms, we filled the device with a suspension of E. coli (109 cells per mL, measured with a Petroff-Hausser counting chamber) in S medium.32 We loaded worms into the device one at a time. The ESI† for this paper includes a video of the loading process. With valves 1–16 in the open position, we placed a single worm into the network outlet of the device, connected a syringe—containing a suspension of bacteria in S medium—to the network outlet via polyethylene tubing, and manually depressed the plunger of the syringe. The resulting flow carried the worm from the network outlet into a chamber. We then closed the valve that corresponded to the newly loaded chamber. (Closure of the valve prevented additional worms from being carried by flow into the channel containing the closed valve, and thus ensured that subsequent worms were not loaded into an occupied chamber.) This procedure, which took approximately 1 min per worm, was repeated for the remaining 15 chambers. Approximately 6 h after loading the worms into the chambers, we opened each of the valves and introduced a continuous flow of suspended E. coli (109 cells per mL) through the device from the inlet.
Fig. 2a shows the experimental set-up for the device. In order to provide a constant supply of fresh bacteria to the worms, we used polyethylene tubing to connect the inlet of the device to a 25-mL reservoir that was filled with a suspension of E. coli, and to connect the bypass outlet and the network outlet of the device to waste reservoirs. For the inlet reservoir, we used a specialized fluid reservoir—an inner syringe with a hole bored in one side, nested inside of a larger outer syringe that lacks a plunger (part no. 64-0159, Warner Instruments, Hamden, CT)—designed to maintain a constant head pressure on the contents of the reservoir. We adjusted the inlet and waste reservoirs so that the difference in height between the liquid levels of the inlet and the bypass outlet reservoirs was 4 cm, and the difference in height between the liquid levels of the inlet and network outlet reservoirs was 16 cm. The pressure differences resulting from this configuration produced a total volumetric flow rate of 700 µL h−1 through the network channels and a volumetric flow rate of 300 µL h−1 through the bypass channel. Fig. 2b shows a close view of the microfluidic chip.
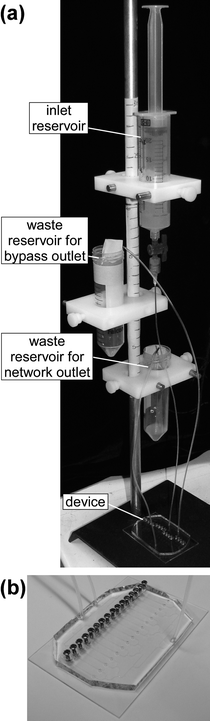 | ||
| Fig. 2 (a) A photograph of the experimental set-up for the array of chambers. (b) A close-up view of a microfluidic device. The device is mounted on a 50 × 75 mm glass slide. | ||
We added a fresh suspension of E. coli (25 mL, 109 cells per mL in S medium) to the inlet reservoir each day. To remove any aggregated bacteria or dust particles, we filtered the bacterial suspensions through a 5-µm Nuclepore® polycarbonate membrane just prior to adding the bacteria to the inlet reservoir (a single, non-aggregated cell of E. coli is approximately 1 µm in width and 2 µm in length).34
The purpose of the bypass channel was to avoid clog formation due to bacterial aggregation. Over time, bacteria from the inlet reservoir settled—because of gravity—at the point where the tubing from the inlet reservoir connected to the inlet of the device. If unchecked, the accumulation of bacteria would gradually lead to the formation of bacterial aggregates, which could clog the microfluidic channels and obstruct flow. The bypass outlet created an alternate path through the device and enabled us to flush sedimented bacteria and bacterial aggregates from the inlet of the device periodically (every 1–2 days). During normal operation of the device, we maintained a relatively low rate of flow into the bypass (compared to the rate of flow into the network of channels and clamps), because we found that constant flow through the bypass prevented adhesion of bacteria to the walls of the bypass channel.35
Loading worms into the clamps
We loaded worms individually into the clamps. For example, in order to load the worm in chamber 1 into the clamp, valves 2–16 were closed, and the network outlet reservoir was raised with respect to the inlet reservoir in order to reverse the direction of the flow of liquid through chamber 1. This flow carried the worm into the clamp (Fig. 1c, iii). It was possible to remove the worm from the clamp by returning the outlet reservoir to its original position. We periodically immobilized the worms within the clamps over the course of their lifespans.Survival of C. elegans
We incubated the worms within the device at 24 °C. Within the chambers, each worm produced hundreds of progeny, as would be expected from healthy adults.36 The progeny of each worm were carried out of the chambers by the continuous flow of liquid through the device. Frequently, clusters of two or more eggs formed within the chamber. These clusters remained within the chamber despite the flow of liquid. Once these eggs hatched, however, the newborn L1 worms (<10 µm in width) would be quickly flushed out of the chamber. In this manner, all progeny were eventually cleared from the chambers, either as eggs or as L1s. Within the chambers, the worms displayed movements that are typical of worms suspended in liquids: forward swimming, reverse swimming, and abrupt body bends.37,38Fig. 3a shows a representative series of images of a single worm within a microfluidic chamber on each day of its life, starting on day 2. Fig. 3b shows images of the worm from Fig. 3a immobilized within the worm clamp on day 3, day 5 and day 7 of the experiment. The lifespan of this worm was 9 days. In the image from day 3, a cluster of eggs is visible within the chamber.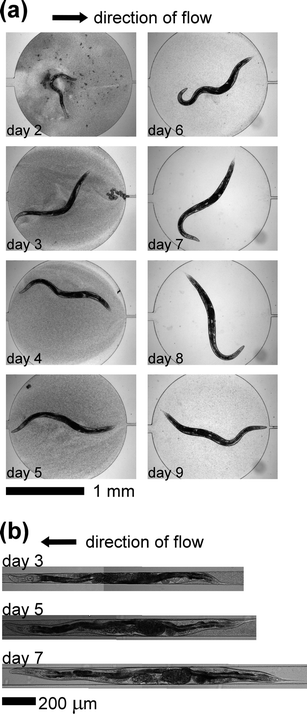 | ||
| Fig. 3 Images of C. elegans inside the device. (a) Images of a single wild-type worm (N2) within the microfluidic chamber. The worm hatched on day 0, and was loaded into the microfluidic device on day 2 (during the L4 larval stage). The lifespan of this worm was 9 days. (b) Composite images of the worm from panel (a) immobilized within the microfluidic worm clamp. We periodically loaded the worm from the chamber into the clamp to enable detailed observation of the body of the worm. | ||
A fraction (∼35%) of the worms we studied died from matricidal hatching—a lethal phenotype in which one or more developing embryos hatch within the parent39—during days 3–7 of the experiment. It is likely that this phenotype was a consequence of liquid culture. In populations of worms grown on NGM agar seeded with bacteria, matricidal hatching occurs at a frequency of 2–4%.40 Frequencies between 40 and 50%, however, have been reported for matricidal hatching in worms cultured in liquid axenic media.41,42 We were unable to find values in the literature for the frequency of matricidal hatching in worms cultured in liquid monoxenic media; in order to determine this value, we cultured worms individually, from the L4 stage until death, in the wells of 96 well plates. We added a 100-µL suspension of E. coli (109 cells per mL in S medium, the same concentration used in the microfluidic device) to each well, and maintained the culture at 24 °C. During the reproductive period, we transferred the worms (using a pipet) each day to new wells, containing fresh suspensions of bacteria (100 µL, 109 cells per mL), in order to distinguish the worms from their progeny. The frequency of matricidal hatching under these conditions was approximately 30%, similar to the frequency we observed in the microfluidic device. This observation suggests that our device does not contribute significantly to matricidal hatching. Fig. 4 compares the survival of worms cultured in the microfluidic device to worms cultured in a 96 well plate. For the microfluidic culture, the average lifespan (±s.d.) was 10 (±2) days (N = 20 animals). For the culture within the 96 well plate, the average lifespan was 12 (±3) days (N = 15 animals). (Deaths due to matricidal hatching were not included in Fig. 4 or in these averages.) The survival curves for the two populations are statistically different under the log-rank test (p-value = 0.001).43 For comparison, for worms cultured on NGM plates seeded with bacteria at 24 °C, the average lifespan is 9.9 (±0.8) days.36 The differences in average lifespan among the different environments—microfluidic chambers, 96 well plates, and NGM agar plates—are not unexpected; it is known that the lifespan of C. elegans is sensitive to environmental conditions.36 Thus, results obtained for animals raised in the microfluidic system are not necessarily directly comparable to results obtained using more conventional methods.
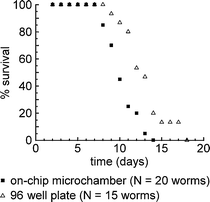 | ||
| Fig. 4 Survival of C. elegans. A comparison of the survival of worms (N2) cultured within the microfluidic chip (■) and worms (N2) cultured in the wells of a 96 well plate (△). Worms hatched from eggs on day 0, and were loaded into the microfluidic device or 96 well plate on day 2. All deaths due to matricidal hatching occurred prior to day 7 for both types of culture, and are not shown. For the worms that did not die from matricidal hatching, the average lifespan (±s.d.) of worms cultured within the microfluidic chip was 10 (±2) days (N = 20 animals), and the average lifespan of worms cultured within the 96 well plate was 12 (±3) days (N = 15 animals). | ||
Longitudinal observation of C. elegans
Longitudinal observation of worms within the device enabled us to examine how age-related changes in C. elegans correlated with lifespan. We monitored two phenotypes: body size and locomotion. We selected these two phenotypes because we could observe them non-invasively—they were thus suitable for longitudinal study—and evaluate them quantitatively. To preclude deaths due to matricidal hatching and thus maximize the number of useable animals in each experiment, we used self-sterile mutants (which produce defective sperm). Beginning on day 3, we made 1 min video recordings (at 30 frames per s) of each worm daily. Using the Image Processing Toolbox in MATLAB® (The MathWorks, Inc., Natick, MA), we constructed algorithms to measure both the volume and the swimming frequency of worms within the microfluidic chambers (see Experimental and Fig. S1†).Features of the growth phase correlate with lifespan
After hatching, C. elegans grows continuously through the four larval stages and into adulthood, reaching a plateau in growth during adulthood.6,33Fig. 5a shows a representative growth curve for a single worm from day 3 until death. Worms exhibited an approximately linear growth phase in the beginning of adulthood, followed by a plateau in growth. Some, but not all, worms exhibited a reduction in volume near the end of their lifespans.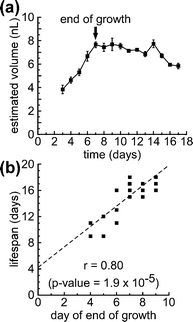 | ||
| Fig. 5 The end of growth in adult C. elegans correlates with lifespan. (a) A sample growth curve for a single worm for its entire lifespan. The black arrow indicates the end of the initial growth period (day 7 for this worm). The error bars for estimated volume were calculated by propagating the standard deviations measured for cross-sectional area and length through the calculation of volume. (b) A scatter plot comparing the day on which growth ended with lifespan for each animal in the population (N = 20 worms). The plot displays r, the Pearson correlation coefficient, and the corresponding p-value. The dashed line represents the estimated regression line, obtained using the method of least squares. The experiment was performed using temperature-sensitive sterile mutants (TJ1060). | ||
We explored whether any quantitative features of the growth phase at the beginning of adulthood correlated with lifespan. We defined the end of the growth phase to be the day on which the volume remained stable—changed less than 5%—on the two following days. We then calculated four interrelated parameters describing growth in adult C. elegans: (i) the day of end of growth (the day on which the growth phase ended), (ii) the change in volume, ΔV, from day 3 to the end of growth, (iii) the volume at the end of the growth phase, Vmax, and (iv) the growth rate during the growth phase. Table S1† summarizes the values for these four parameters, as well as the lifespan, for each worm in the experiment (N = 20 worms).
For each of the above parameters, we determined the correlation with lifespan by calculating, r, the Pearson correlation coefficient:43 a dimensionless quantity—between −1 and 1—which quantifies the linearity of a relationship between two variables. A correlation coefficient of |r| = 1 indicates strong correlation; a correlation coefficient of r = 0 indicates no correlation. The associated p-value represents the probability of obtaining the calculated correlation coefficient if the correlation coefficient was actually zero. We observed a strong, positive correlation (r = 0.80, p-value = 1.9 × 10⁻⁵) between the day of the end of growth and lifespan. Fig. 5b shows a scatter plot comparing the day of the end of growth and lifespan. These data suggest that worms that exhibit a longer period of body growth at the beginning of adulthood live longer than worms with shorter periods of growth. We observed a relatively weaker positive correlation between ΔV and lifespan (r = 0.51, p-value = 0.022) and between Vmax and lifespan (r = 0.55, p-value = 0.012), and did not observe any significant correlation between the growth rate and lifespan. Fig. S2† shows scatter plots comparing lifespan with ΔV, Vmax, and the growth rate.
Loss of swimming correlates with lifespan
As worms age, they display a progressive decline in locomotion—body motion slows, becomes increasingly uncoordinated, and eventually stops entirely.4,7,8,44 To measure swimming frequency, we defined a body angle, θ, as the angle formed by the head, center of mass, and tail of the worm (see Fig. S1†). As a worm swims in a liquid environment, θ oscillates around 180°; a single oscillation corresponds to a single stroke: the bending of the body of the worm in one direction followed by the bending of the body of the worm in the opposite direction. Fig. 6a shows the oscillation of θ for a young (day 3) worm. As the worms aged, swimming became slower, more irregular in frequency, and uncoordinated. Fig. 6b shows the oscillation of θ for the same worm on day 9. By counting the number of oscillations per unit time, we were able to determine the swimming frequencies (in strokes per min) for each animal for each day of its lifespan. Fig. S3† shows the age-related decline in swimming frequency for each worm (N = 20 worms). | ||
| Fig. 6 Age-related decline in swimming frequency correlates with lifespan. (a) A sample trajectory of body angle, θ, over a period of 20 s on day 3. (b) A sample trajectory of θ over a period of 20 s for the same worm on day 9. (c) A scatter plot comparing the swimming span (for a threshold of 10 strokes per min) with lifespan for each animal in the population (N = 20 worms). The plot displays r, the Pearson correlation coefficient, and the corresponding p-value. The dashed line represents the estimated regression line, obtained using the method of least squares. The experiment was performed using temperature-sensitive sterile mutants (TJ1060). | ||
Although there was an overall decrease in swimming frequency over the lifespan of each animal, we observed substantial day-to-day variation in the swimming frequency of individual worms (Fig. S3†). Previously, researchers have observed a (qualitatively) similar day-to-day variation in the rate of pharyngeal pumping in aging worms.9 In order to characterize the age-related decline in swimming, we defined a swimming span: the last day on which we observed a worm swimming, for at least 20 s, above a given threshold swimming frequency. (For example, if the threshold frequency was 60 strokes per min, the swimming span for an individual worm would be the last day on which we observed that worm swimming at or above 60 strokes per min.) We then calculated the correlation between swimming span and lifespan for thresholds ranging from 10 strokes per min to 100 strokes per min. For thresholds higher than 30 strokes per min, we did not observe any significant correlation of swimming span with lifespan. For thresholds of 30 strokes per min or less, we observed positive Pearson correlation coefficients, which increased in magnitude as the threshold swimming frequency decreased from 30 strokes per min (r = 0.51, p-value = 0.023), to 20 strokes per min (r = 0.58, p-value = 0.0079), to 10 strokes per min (r = 0.73, p-value = 0.00024). Fig. 6c shows a scatter plot comparing the swimming span—for a threshold swimming frequency of 10 strokes per min—and lifespan. Fig. S4† shows similar scatter plots for thresholds of 20 strokes per min and 30 strokes per min. From these data, it is apparent that the age-related decline in swimming frequency correlates with lifespan; the longer a worm swims at or above a moderate swimming frequency (10–30 strokes per min), the longer it is likely to live. This result is in agreement with previous reports that the time at which worms cease crawling on NGM agar in a continuous, coordinated manner can be used to predict lifespan.4,6,7
Conclusion
The array of confinement chambers described here makes it possible to track behavioral and physiological phenotypes in individual worms over extended periods of time. The ability to perform these longitudinal observations should be especially valuable in fields such as development, learning and memory, and aging, where changes over time in individual worms are of interest. In addition to providing a means for making longitudinal observations, the device enables researchers to study to what extent variation exists in a population of genetically identical worms.Although NGM plates seeded with bacteria are the traditional environments for C. elegans in the laboratory, the microfluidic chambers offer several useful features that would be difficult—or even impossible—to replicate with traditional methods. For example, because the microfluidic device provides a constant influx of fresh food, the concentration of food to which the worm is exposed is constant over time. This situation is in contrast to cultures on NGM plates, in which worms may (i) temporarily crawl off of the bacterial lawn, or (ii) significantly deplete the concentration of bacteria on the plate by consuming it. The device enables the continuous removal of waste and other excreted compounds—such as pheromones—from the chamber, and thus ensures that the environment of the worm does not change in time.
The microfluidic nature of the device makes it a powerful tool for exposing the worms to complex combinations of chemical stimuli. Researchers will be able to treat worms with temporal gradients or pulses of dissolved drugs. Because the device uses liquid, monoxenic media, it is possible to vary the concentration of E. coli that is delivered to the worms. In addition, the microfluidic design makes it possible to incorporate downstream analysis of any chemicals, such as pheromones, produced by the worms. We have focused on the age-related changes in size and locomotion as demonstrations of the utility of the device. The device we have presented, however, is compatible with the longitudinal observation of a very wide range of phenotypes. In addition, it should also be possible to incorporate additional microfabricated elements—such as microelectrodes or optical elements—which would further expand the set of observable phenotypes.
Experimental
Materials
All reagents were purchased from Sigma or VWR unless otherwise stated. Nematode growth media (NGM) and S medium were prepared as previously described.1,32Fabrication of PDMS devices
We fabricated our microfluidic devices using a number of standard soft lithographic techniques.26,28,29 The ESI† for this manuscript includes detailed descriptions of these previously described techniques. Using conventional photolithography, masters were patterned with the design shown in Fig. 1b with features that were either 50 µm (for devices with clamps) or 100 µm (for devices without clamps) in height.We then treated the masters with tridecafluoro(1,1,2,2 tetrahydrooctyl) trichlorosilane (Gelest, Inc., Philadelphia, PA) to prevent the adhesion of PDMS to the master during the molding process, and to alter the surface energy of the master to enable the creation of domed chambers on the master. To create the domed chambers, we added 1 µL drops of 1 : 1 SU-8 photoresist : propylene glycol monomethyl ether acetate (PGMEA) to the 16 circular regions of the master that would form the chambers of the device. (If masters were not silanized prior to this step, the contact angle of 1 : 1 SU-8 : PGMEA on the cross-linked SU-8 features of the master would be too low to enable the formation of domes.) We then baked the master at 55 °C for 3 h, and exposed the master to a source of UV light to cross-link the domed features.
We replica molded the master in PDMS (Dow Corning Sylgard 184, Corning, NY), and embedded prefabricated screw valves as has been previously described.25 Proper alignment of the prefabricated screw valves with the underlying channels was a crucial step in producing devices in which every chamber could be loaded successfully. To prevent drift in the positions of the prefabricated valves, it was important to place the PDMS-filled master on a level surface during the curing stage. Once the PDMS device had cured, we removed the device from the master and punched a 1-mm inlet hole and 1.5-mm outlet holes using circular biopsy punches (Shoney Scientific Inc., Waukesha, WI). We sealed the PDMS device to a glass slide (50 × 75 mm, 1.2 mm thick, VWR) that had been spin-coated with PDMS (1000 rpm for 45 s) and cured overnight at 60 °C. Immediately after sealing the device to the PDMS-coated slide, we filled the channels of the device with a 10% (v/v) solution of mPEG-silane in ethanol. After 8 h, we flushed the device with at least 1 mL of fresh ethanol, and dried the device with nitrogen. We repeated this cycle of rinsing with ethanol/drying with nitrogen three times, and subsequently placed the device under vacuum for 12 h. At this stage, the devices were ready to be filled with S medium and loaded with worms.
In the experimental set-up for the microfluidic device, Intramedic® polyethylene tubing (VWR) connected the inlet and waste reservoirs to the device. The inlet reservoir was a 20 mL specialized syringe (part no. 64-0159, Warner Instruments, LLC, Hamden, CT), designed to maintain a constant head pressure on the fluid in the inlet reservoir. This syringe prevented the rate of flow through the device from changing significantly as the volume of liquid in the inlet reservoir changed.
Preparing NGM plates seeded with bacteria
Saturated cultures of E. coli (OP50) were grown by inoculating 10 mL of LB medium (10 g L−1 tryptone, 5 g L−1 yeast extract, 5 g L−1 NaCl, 1 mL of 1 M NaOH) with E. coli and incubating the culture for 16 h at 37 °C. We seeded NGM plates with bacteria by adding 2–3 mL of saturated OP50 to each plate and leaving the plates at room temperature for 2–3 days.Preparing liquid monoxenic media
Saturated cultures of E. coli (HB101) were grown by inoculating 30 mL of LB medium with E. coli and incubating the culture for 16 h at 37 °C. Bacteria were centrifuged at 1000 × g for 10 min. The supernatant liquid was removed, and the cells were resuspended in S medium. This process of centrifugation and resuspension was repeated three times in total, and the suspension was diluted, with S medium, to a concentration of 109 cells per mL (as measured with a Petroff-Hausser counting chamber). Immediately before use, we filtered the bacterial suspensions through a 5-µm Nuclepore® polycarbonate membrane.Maintenance of C. elegans
Wild-type (N2) and temperature-sensitive sterile (TJ1060: spe-9(hc88)I; fer-15(b26)II) strains of C. elegans were obtained from the Caenorhabditis Genetics Center at the University of Minnesota (St Paul). Stocks of wild-type and sterile worms were maintained at 24 °C and 15 °C, respectively, on NGM agar that had been seeded with the OP50 strain of E. coli (food source). TJ1060 is sterile at 24 °C, but fertile at 15 °C; it is therefore necessary to maintain stocks of TJ1060 at 15 °C. Worms were transferred to fresh plates of NGM with E. coli every 7–10 days to maintain well-fed stocks of worms.Preparation of synchronous worms
We obtained a synchronous population of worms in the L4 stage of development using an established method.32 We transferred approximately 10 gravid worms to an E. coli-seeded NGM agar plate, and incubated the plate at 24 °C. After 1 h, each adult had laid approximately 5–10 eggs. We then removed the adults from the plate, leaving behind a population of eggs at approximately the same developmental stage. We defined the day of egg laying to be day 0. On day 2, after 40 h at 24 °C, the synchronized worms had reached the middle of the L4 larval stage, and were ready for loading into either the microfluidic device or the 96 well plate.Monitoring survival in C. elegans
We monitored the lifespans of the worms within the microfluidic device by observing each day whether or not the animals moved in response to either an increase in the rate of flow of liquid through the device or a manual tap on the upper surface of the PDMS device. We monitored the lifespans of the worms within the 96 well plate by observing whether or not the animals moved in response to a gentle tap with a thin platinum wire or pipet tip. Worms that did not move were scored as ‘dead.’ Lifespan was defined as the number of days between day 0 and the last day on which the worm was scored as alive. Worms were removed from the analysis of lifespans if matricidal hatching occurred or if the worm was accidentally flushed out of the chamber. The log-rank test was used to test the hypothesis that the survival functions among groups were equal.Analyzing size and swimming frequency in C. elegans
For all microscopy, we used an upright Nikon® Eclipse E400 microscope equipped with a Nikon® CFI E Plan 4× objective. Video recordings were made with a monochrome CCD camera (Marshall Electronics V1070) connected to the phototube of the microscope via a C-mount adapter. We connected the output of the CCD camera to a PC via an analog-to-digital convertor (Canon® Elura 80 camcorder in “analog-digital conversion” mode). Recordings were captured onto the PC using Adobe® Premiere®.In the presence of food, worms within the devices spontaneously switched back and forth between states in which they were swimming and states in which they made only small head movements without swimming. This behavior is similar to what is observed for C. elegans crawling on bacterial lawns on NGM agar.45 To induce swimming of worms within the chambers, we replaced the inlet reservoir of the device with a reservoir containing S medium only (bacteria-free). We waited 10 min to allow all bacteria to be flushed from the chambers, and then recorded each worm for 1 min.
Both volume and swimming frequency were calculated from the 1 min recordings using homemade algorithms constructed with the Image Processing Toolbox™ in MATLAB®. For each frame, we applied an algorithm for the removal of background objects, such as the walls of the chamber, from the frame. We then applied a thresholding function to convert each frame to a binary image, with the worm as an object made up of white pixels on a background of black pixels (Fig. S1†). From the binary images, we measured the sagittal cross-sectional area of the worm. We then employed a series of morphological operations—included in MATLAB®'s Image Processing Toolbox™—to reduce the body of the worm to a single line and to measure its length (Fig. S1†). We estimated the volume of the worm to be the volume of a cylinder with a height equal to the average length of the worm, and with a rectangular cross-sectional area—the cross-section that contains the central axis of the cylinder—equal to the average cross-sectional area of the worm. The reduction of the body of the worm to a single line enabled the identification of the head and tail ends of the worm. (For our purposes, it was not necessary for us to distinguish between the head and tail ends.) We defined a body angle, θ, as the angle formed by the head, center of mass, and tail of the worm (Fig. S1†). By counting the number of oscillations per unit time, we were able to determine the swimming frequencies (in strokes per min) for each animal for each day of its lifespan. For a swimming worm, θ oscillates around 180°. A single oscillation corresponds to the bending of the body of the worm in one direction (i.e., θ changes from θ = 180° to θ > 180°, and back to θ = 180°), followed by the bending of the body in the opposite direction (θ changes from θ = 180° to θ < 180°, and back to θ = 180°). Oscillations in θ with periods less than 0.33 s or greater than 10 s were not counted as strokes. In addition, oscillations in θ with a peak-to-peak amplitude less than 50° were not counted as strokes.
For statistical analyses of correlation, Pearson correlation coefficients and corresponding p-values were calculated using the Statistics Toolbox™ in MATLAB®.
Acknowledgements
This research was supported by an Environmental Health and Safety grant from the National Institutes of Health under award no. R01 ES016665, a grant from the MRSEC Program of the National Science Foundation (NSF) under award no. DMR-0213805, and a grant from Vertex Pharmaceuticals Incorporated to Harvard University. This work was performed in part at the Center for Nanoscale Systems (CNS), a member of the National Nanotechnology Infrastructure Network (NNIN), which is supported by the NSF under award no. ECS-0335765. S.E.H. gratefully acknowledges a National Defense Science and Engineering Graduate Fellowship from the American Society for Engineering Education.References
- S. E. Hulme, S. S. Shevkoplyas, J. Apfeld, W. Fontana and G. M. Whitesides, Lab Chip, 2007, 7, 1515–1523 RSC.
- P. B. Allen, A. E. Sgro, D. L. Chao, B. E. Doepker, J. Scott Edgar, K. Shen and D. T. Chiu, J. Neurosci. Meth., 2008, 173, 20–26 CrossRef.
- J. J. Collins, K. Evason and K. Kornfeld, Exp. Gerontol., 2006, 41, 1032–1039 CrossRef CAS.
- L. A. Herndon, P. J. Schmeissner, J. M. Dudaronek, P. A. Brown, K. M. Listner, Y. Sakano, M. C. Paupard, D. H. Hall and M. Driscoll, Nature, 2002, 419, 808–814 CrossRef.
- C. D. O. Beck and C. H. Rankin, Anim. Learn. Behav., 1997, 25, 446–457 Search PubMed.
- M. A. Bolanowski, R. L. Russell and L. A. Jacobson, Mech. Ageing Dev., 1981, 15, 279–295 CrossRef CAS.
- C. Huang, C. Xiong and K. Kornfeld, Proc. Natl. Acad. Sci. U. S. A., 2004, 101, 8084–8089 CrossRef CAS.
- A.-L. Hsu, Z. Feng, M.-Y. Hsieh and X. Z. S. Xu, Neurobiol. Aging, 2009, 30, 1498–1503 CrossRef.
- J. Johnston, W. B. Iser, D. K. Chow, I. G. Goldberg and C. A. Wolkow, PLoS One, 2008, 3, e2821 CrossRef.
- C. B. Rohde, F. Zeng, R. Gonzalez-Rubio, M. Angel and M. F. Yanik, Proc. Natl. Acad. Sci. U. S. A., 2007, 104, 13891–13895 CrossRef CAS.
- F. Zeng, C. B. Rohde and M. F. Yanik, Lab Chip, 2008, 8, 653–656 RSC.
- S. X. Guo, F. Bourgeois, T. Chokshi, N. J. Durr, M. A. Hilliard, N. Chronis and A. Ben-Yakar, Nat. Methods, 2008, 5, 531–533 CrossRef CAS.
- K. Chung, M. M. Crane and H. Lu, Nat. Methods, 2008, 5, 637–643 CrossRef CAS.
- T. V. Chokshi, A. Ben-Yakar and N. Chronis, Lab Chip, 2009, 9, 151–157 RSC.
- X. Heng, D. Erickson, L. R. Baugh, Z. Yaqoob, P. W. Sternberg, D. Psaltis and C. Yang, Lab Chip, 2006, 6, 1274–1276 RSC.
- N. Chronis, M. Zimmer and C. I. Bargmann, Nat. Methods, 2007, 4, 727–731 CrossRef CAS.
- D. B. Dusenbery, J. Comp. Physiol. A Neuroethol. Sens. Neural. Behav. Physiol., 1980, 136, 327–331 Search PubMed.
- S. Faumont, A. C. Miller and S. R. Lockery, J. Neurobiol., 2005, 65, 171–178 CrossRef.
- S. R. Lockery, K. J. Lawton, J. C. Doll, S. Faumont, S. M. Coulthard, T. R. Thiele, N. Chronis, K. E. McCormick, M. B. Goodman and B. L. Pruitt, J. Neurophysiol., 2008, 99, 3136–3143 CrossRef CAS.
- J. Qin and A. R. Wheeler, Lab Chip, 2007, 7, 186–192 RSC.
- W. Shi, J. Qin, N. Ye and B. Lin, Lab Chip, 2008, 8, 1432–1435 RSC.
- N. Kim, C. M. Dempsey, J. V. Zoval, J.-Y. Sze and M. J. Madou, Sens. Actuators, B, 2007, 122, 511–518 CrossRef.
- D. Lange, C. W. Storment, C. A. Conley and G. T. A. Kovacs, Sens. Actuators, B, 2005, 107, 904–914 CrossRef.
- D. B. Weibel, M. Kruithof, S. Potenta, S. K. Sia, A. Lee and G. M. Whitesides, Anal. Chem., 2005, 77, 4726–4733 CrossRef CAS.
- S. E. Hulme, S. S. Shevkoplyas and G. M. Whitesides, Lab Chip, 2009, 9, 79–86 RSC.
- D. B. Weibel, W. R. DiLuzio and G. M. Whitesides, Nat. Rev. Microbiol., 2007, 5, 209–218 Search PubMed.
- D. B. Weibel and G. M. Whitesides, Curr. Opin. Chem. Biol., 2006, 10, 584–591 CrossRef CAS.
- G. M. Whitesides, E. Ostuni, S. Takayama, X. Jiang and D. E. Ingber, Annu. Rev. Biomed. Eng., 2001, 3, 335–373 CrossRef CAS.
- Y. Xia and G. M. Whitesides, Angew. Chem., 1998, 37, 550–575.
- S. K. Sia and G. M. Whitesides, Electrophoresis, 2003, 24, 3563–3576 CrossRef CAS.
- Z. Zhang, P. Boccazzi, H.-G. Choi, G. Perozziello, A. J. Sinskey and K. F. Jensen, Lab Chip, 2006, 6, 906–913 RSC.
- T. Stiernagle, in WormBook, ed. The C. elegans Research Community, WormBook, February 11, 2006 Search PubMed.
- C. G. Knight, M. N. Patel, R. B. R. Azevedo and A. M. Leroi, Evol. Dev., 2002, 4, 16–27 CrossRef.
- H. C. Berg and R. A. Anderson, Nature, 1973, 245, 380–382 CrossRef CAS.
- H. J. Busscher and H. C. van der Mei, Clin. Microbiol. Rev., 2006, 19, 127–141 CrossRef.
- M. R. Klass, Mech. Ageing Dev., 1977, 6, 413–429 CrossRef CAS.
- N. A. Croll, J. Zool., 1975, 176, 159–176 Search PubMed.
- W. S. Ryu and A. D. T. Samuel, J. Neurosci., 2002, 22, 5727–5733 CAS.
- J. Chen and E. P. Caswell-Chen, Nematology, 2003, 5, 641 CrossRef.
- S. J. Lee, J. S. Yook, S. M. Han and H. S. Koo, Development (Cambridge, UK), 2004, 131, 2565–2575 CrossRef CAS.
- S. Gandhi, J. Santelli, D. H. Mitchell, J. W. Stiles and D. R. Sanadi, Mech. Ageing Dev., 1980, 12, 137–150 CrossRef CAS.
- D. R. Shook and T. E. Johnson, Genetics, 1999, 153, 1233–1243 CAS.
- B. Rosner, Fundamentals of Biostatistics, Duxbury Press, Pacific Grove, CA, 6th edn, 2006 Search PubMed.
- R. Hosono, Y. Sato, S. I. Aizawa and Y. Mitsui, Exp. Gerontol., 1980, 15, 285–289 CrossRef CAS.
- J. G. White, E. Southgate, J. N. Thomson and S. Brenner, Philos. Trans. R. Soc. London, Ser. B, 1986, 314, 1–340 CrossRef.
Footnote |
| † Electronic supplementary information (ESI) available: Supplementary experimental procedures, Table S1 and Movie 1. See DOI: 10.1039/b919265d |
| This journal is © The Royal Society of Chemistry 2010 |