Use of a nano-electrospray/inductively coupled plasma dual-source time-of-flight mass spectrometer for chromium speciation
Duane A.
Rogers
,
Steven J.
Ray
and
Gary M.
Hieftje
*
Department of Chemistry, Indiana University, 800 E Kirkwood, Bloomington, IN, USA 47403. E-mail: Hieftje@Indiana.edu; Fax: +1 812 855 0985; Tel: +1 812 855 2189
First published on 30th November 2009
Abstract
In the presented work, Cr(III) and Cr(VI) species are determined with a dual-source time-of-flight mass spectrometer, which uses an inductively coupled plasma and a nano-electrospray ionization source to provide simultaneous elemental, isotopic, molecular, and structural information within the same spectrometer. Indicative ESI species are identified for chromium(III) acetate, chromium chloride, chromium picolinate, and potassium dichromate in methanol and ethanol matrices. Analyte characterization from skimmer-nozzle collisionally-induced dissociation fragments is examined in detail. An online dilution apparatus is described for use with ESI for the determination of analytes that react with the solvent.
Introduction
While the mere determination of total elemental concentration was the norm in the last century,1–5 the information yielded by this approach is inherently too limited for the demanding scientific climate of the 21st century. The role of a given element in a biological or environmental system is significantly influenced by its chemical form and its environment. For example, Cr(VI) is putatively regarded as the carcinogenic form of chromium, while Cr(III) as a non-toxic and beneficial form.6 However, Cr(VI) alone is unreactive to DNA under physiological conditions. Within a living cell, redox-active enzymes and small molecules reduce Cr(VI) to reactive intermediates including chromium(VI) esters, Cr(V), Cr(IV), and Cr(III),7,8 all of which can affect critical cellular processes, including replication and transcription.9 The predominant form of Cr(VI), the tetrahedral anion CrO42−, can be actively transported across cellular membranes through the cell's natural anion transport system,10 while the octahedral complexes of Cr(III) cross the membrane 1000 times more slowly.11 Therefore, to properly determine the role of chromium, a comprehensive understanding of the species involved along with the concentration and distribution of those species is necessary.Modern laboratories use hyphenated elemental-detection techniques (e.g. HPLC-ICP-MS) to perform elemental speciation analysis; however, the molecular information obtained from such an approach is based on inference from the retention time of available standards.12–16 In the analysis of biological samples, the species of interest is often a novel metabolite or intermediate, for which suitable standards are not available. In such cases, it is necessary to correlate the elemental separation data with a second separation performed with a molecular detector (e.g. HPLC-ESI-MS).17–21 Uncertain chromatographic peaks from the first separation can then be identified from the molecular and structural information of the second separation. Horlick and co-workers demonstrated that elemental speciation analysis can be performed directly from ESI-MS data.22,23 However, the dynamic range of ESI-MS is typically limited to a few orders of magnitude and sensitivity for metals is significantly poorer than with ICP-MS.24 To facilitate rapid comprehensive speciation analysis, a dual-source time-of-flight mass spectrometer (ds-TOFMS) has been developed that utilizes an inductively couple plasma (ICP) source and an electrospray ionization (ESI) source in parallel to provide atomic, isotopic, quantitative, molecular, and structural information simultaneously.
The ds-TOFMS is designed to split the eluent from a chromatographic separation between the two ionization sources to provide simultaneous information from a chromatographic separation. Elimination of redundant separation steps can dramatically reduce sample requirements, expenditure of standards, preparation time, and analysis time. The design and principles of operation for the ds-TOFMS have been previously described.25–27 An illustration of the ds-TOFMS is given in Fig. 1.
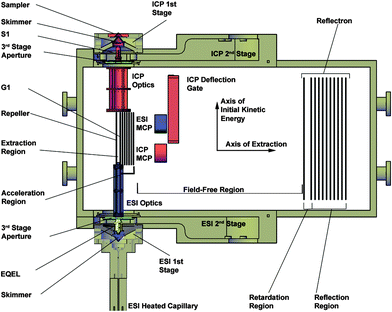 | ||
| Fig. 1 Schematic diagram of the dual-source time-of-flight mass spectrometer. A cutaway cross section is shown for the three differentially pumped vacuum stages to expose relevant components. An Electrostatic Quadrupole Extraction Lens (EQEL) is used in the ESI second vacuum stage to improve ion transmission, while a conventional extraction optic (S1) is used on the ICP channel. Each ion beam is independently focused into the extraction region by tailored ion optics. Ions are extracted from the continuous incoming ion beams between the repeller plate and first grid of the acceleration region (G1). Mass separation occurs in a shared field-free region and energy compensation is accomplished in a shared reflectron. Each channel has an independent microchannel plate detector (MCP). | ||
In the present study, the capabilities of the ds-TOFMS will be demonstrated for the speciation analysis of chromium. Quantitative capabilities of the ICP channel of information will be examined along with common spectral interferences for chromium. The ESI channel will be shown to provide molecular and structural information for the identification of chromium species. The interaction of chromium with the solvent will also be discussed. To demonstrate the capabilities of the ds-TOFMS, this work uses chemical standards for the Cr species studied.
Experimental
Instrumental details of the ds-TOFMS have been described previously.25–27 A schematic diagram of the ds-TOFMS is shown in Fig. 1. Specific ionization source and instrument operating conditions for the present study are given in Table 1. Data workup was performed with software written in house in LabVIEW® (Ver. 7.1, National Instruments Corp., Austin, TX, USA) and Origin Pro (Version 7.5, Northampton, MA USA).| TOFMS Operating Conditions | |
|---|---|
| Third-stage pressure | <3.5 µTorr |
| Repeller Bias | 0.5 V |
| Extraction Field | 301 V cm−1 |
| Extraction Pulse Width | 8.3 µs |
| G1 Potential | 1.3 V |
| Acceleration Field | −34.4 V cm−1 |
| Reflectron Retardation Field | 438 V cm−1 |
| Reflection Field | 111 V cm−1 |
| ICP Operating Conditions | |
|---|---|
| Sample introduction | Cetac U-6000AT+ |
| Ultrasonic nebulizer with membrane desolvation | |
| Sample uptake rate | 1 ml min−1 |
| Plasma power | 1.25 kW |
| Plasma frequency | 40.68 MHz |
| Central gas flow | 0.85 l min−1 |
| Intermediate gas flow | 0.9 l min−1 |
| Outer gas flow | 15 l min−1 |
| Membrane desolvator gas flow | 6.0 l min−1 |
| Sampling position | 7 mm above load coil |
| Sampler-orifice diameter | 1 mm |
| Skimmer-orifice diameter | 0.5 mm |
| Sampler material | Nickel |
| Skimmer material | Nickel |
| ICP First-stage pressure | 1–2 Torr |
| ICP Second-stage pressure | 2.2 mTorr |
| ICP Ion Optic Potentials | |
|---|---|
| S1 Optic | −2.0 kV |
| Third-stage aperture plate | −1.2 kV |
| Ring optic 1 | −431 V |
| Quadrupole X1 | −269 V |
| Quadrupole Y1 | −201 V |
| Ring optic 2 | −20 V |
| Quadrupole X2 | −293 V |
| Quadrupole Y2 | −181 V |
| Slit optic 1 | −356 V |
| Slit optic 2 | −20 V |
| Energy Discrimination | 70 V |
| MCP Post Acceleration | −2195 V |
| ESI Operating Conditions | |
|---|---|
| Interface temperature | 170 °C |
| Sample solution flow rate | 150–350 nl min−1 |
| Heated-capillary length | 14.6 cm |
| Heated-capillary inner diameter | 380 µm |
| Heated-capillary material | 304 stainless steel |
| Heated capillary potential | 50–350 V |
| Skimmer material | 304 stainless steel |
| ESI First-stage pressure | 1 Torr |
| ESI Second-stage pressure | <0.4 mTorr |
| ESI Ion Optic Potentials | |
|---|---|
| Skimmer | 10–25 V |
| EQEL outer optic | −250 V |
| EQEL inner optic | 0 V |
| Third-stage aperture plate | −175 V |
| Einzel lens 1 | −307 V |
| Einzel lens 2 | −296 V |
| Einzel lens 3 | −1 V |
| Quadrupole X1 | −1220 V |
| Quadrupole Y1 | −1205 V |
| Ring optic 1 | −304 V |
| Quadrupole X2 | −405 V |
| Quadrupole Y2 | −400 V |
| Ring optic 2 | −455 V |
| Ring optic 3 | −72 V |
| Slit optic | −20 V |
| MCP Post Acceleration | −7250 V |
Sample preparation
All ICP samples were prepared in 0.1 M HNO3 derived from reagent-grade nitric acid (70%, Mallinckrodt Baker, Inc., Phillipsburg, NJ USA) and doubly distilled water. The reagent-grade nitric acid was first purified by sub-boiling distillation in a Teflon still (SBS-108, Savillex, Minnetonka, MN USA).To study molecular species formed in different matrices, ESI samples were prepared in either 99% methanol (MX0485-8, Lot 46289, EMD Chemicals Inc., Gibbstown, NJ USA), 99% ethanol (200 proof, Cat. No 111ACS200, Lot MF0125, PHARMCO- AAPER and Commercial Alcohols, Brookfield, CT USA), or 50![[thin space (1/6-em)]](https://www.rsc.org/images/entities/char_2009.gif) :50 water:methanol with 1% acetic acid (acetic acid: glacial, AX0073-9, Lot 45236, EMD Chemicals Inc.) added. Samples were allowed to fully dissolve in double-distilled water before dilution. Chromium Picolinate (CrPic) was acquired from Spectrum® (C1254, Lot YO0086, Spectrum Chemicals and Laboratory Products, New Brunswick, NJ USA) and was allowed to dissolve directly in the organic solvent due to its low water solubility. Potassium dichromate was provided by J.T. Baker Chemical Co. (K2Cr2O7; No. 3090, Lot 43098, Phillipsburg, NJ USA). Chromium(III) acetate (Cr(C2H3O2)3·xH2O; purified powder, CB959 CX1585) and chromium(III) chloride (CrCl3·6H2O; CB299 CX1590) were acquired from Matheson Colman & Bell (Norwood, OH USA).
:50 water:methanol with 1% acetic acid (acetic acid: glacial, AX0073-9, Lot 45236, EMD Chemicals Inc.) added. Samples were allowed to fully dissolve in double-distilled water before dilution. Chromium Picolinate (CrPic) was acquired from Spectrum® (C1254, Lot YO0086, Spectrum Chemicals and Laboratory Products, New Brunswick, NJ USA) and was allowed to dissolve directly in the organic solvent due to its low water solubility. Potassium dichromate was provided by J.T. Baker Chemical Co. (K2Cr2O7; No. 3090, Lot 43098, Phillipsburg, NJ USA). Chromium(III) acetate (Cr(C2H3O2)3·xH2O; purified powder, CB959 CX1585) and chromium(III) chloride (CrCl3·6H2O; CB299 CX1590) were acquired from Matheson Colman & Bell (Norwood, OH USA).
Nano-electrospray tip fabrication
To improve ESI sensitivity for metal species, nano-electrospray was employed in the current study. Nano-spray tips were produced in house by drawing out 50 µm i.d. fused-silica capillary tubing (185 µm o.d., Polymicro Technologies L.L.C., Phoenix, AZ USA). To pull the fused silica tubing, one end was clamped in a laboratory vice and held vertically with a bolt and nut fastened around the bottom end of the capillary for weight. The capillary was heated with a butane micro torch (model MT-770, Roburn Company Limited, Sinjhuang, Taiwan) ca. 1 cm above the bolt until the weight of the bolt pulled the capillary out to a very fine tip. The end of the capillary, which was closed off in the pulling process, was then etched with a ceramic scribe and broken off. The tip was inspected under 45x magnification (SZ Series Triocular Microscope, Howard Electronic Instruments, Inc., El Dorado, KS USA) to confirm that a clean break was made. The end of the nano-tips ranged from 5 to 20 µm i.d. The fused silica tubing was cut 46 cm long to serve as transfer tubing from the syringe to the nano-tip. The nano-tips were then coated with 20-nm thick 80:20 Ag:Pd with an electron-microscope vapor deposition unit (model E5100, Polaron Equipment Limited, Hertfordshire, England). The coated nano-spray tips were passed through a 28 Ga stainless steel needle held in a 3.18 mm stainless steel Swagelok® union (Swagelok, Solon, OH USA) to which an electrical connection was made to the electrospray power supply (model PS/EL30R01.5, 30 kV max, 1.5 mA max, Glassman High Voltage Inc., High Bridge, NJ USA); the spray current was monitored with an in-line current-to-voltage converter and a Fluke digital multimeter (model 175, Fluke®,Everett, WA USA). The nano-spray tip extended approximately 3 cm beyond the end of the 28 Ga needle and the Ag:Pd coating provided a continuous electrical connection from the Swagelok® union to the solution exiting the nano-tip. With these nano-spray tips it was possible to maintain a stable cone-jet spray mode with flow rates from 150 nl min−1 to 1.3 µl min−1.
When a 10 µm i.d. capillary was used for the full length of the transfer capillary, the high pressure in the syringe and capillary produced leaks around the syringe needle. However, when the transfer capillary had a 50 µm i.d. from the syringe to the tip, the greatest pressure drop was over only a small distance (ca. 1 cm) and the pressure was not significantly higher than was obtained with a 50 µm blunt-end tip. Future work is planned to reduce the tip i.d. to <5 µm.
Online ESI dilution
Chromium VI species are known to be strong oxidizing agents. Accordingly, the storage of Cr(VI) in methanol for extended periods can lead to the reduction of Cr from its native oxidation state and the oxidation of methanol to formaldehyde. However, Cr(VI) is very stable if stored in water. Therefore, it is desirable to minimize the interaction time of Cr(VI) and methanol before beginning an experiment. A simple online dilution apparatus was constructed to introduce aqueous Cr(VI) into a continuous stream of methanol just ahead of the ESI needle.A 1.25 ml gastight Hamilton syringe (Hamilton Co., Reno, NV USA) was filled with methanol and the Cr species of interest was loaded into a 25 µl Hamilton gastight syringe. Both syringes were loaded onto a PHD 2000 syringe pump (Harvard Apparatus, Holliston, MA USA). The pump was programmed for a syringe diameter of 5.869 mm to account for both the 1.25 ml (5.14 mm i.d.) and 25 µL (0.729 mm i.d.) syringes. The pump's flow-rate setting therefore corresponded to the combined flow from both syringes. The effluent from the Cr(VI) syringe was connected to the end of the methanol syringe needle with a low-dead-volume PEEK™ tee (P-713, IDEX Health and Science, Oak Harbor, WA USA) and a 7 cm length of 50 µm i.d. fused silica capillary.
To ensure that the Cr(VI) solution was introduced into a continuous stream of methanol, the solvent syringe was filled to 1.25 ml while the Cr(VI) syringe was filled only to 24.5 µl (98% of capacity). This difference allowed the ESI transfer capillary to flush with methanol for 2.5 minutes at a flow rate of 10 µl min−1 before the Cr(VI) was injected; afterward, the flow rate was reduced for stable ESI operation. As the syringe pump forced solution from both syringes, the aqueous Cr(VI) solution was diluted to a 1:50 ratio with the methanol within the tee. For a flow rate of 350 nl min−1, the mixed solution took ca. 155 seconds to move from the mixing tee to the ESI needle. Of course, the interaction time of Cr(VI) with the solvent is governed by the length of the capillary from the tee to the ESI needle and by the flow rate. For example, the time is reduced to 42 second at a flow rate of 1.3 µl min−1. If particularly short mixing times are necessary, the position of the tee could be moved to directly before the ESI needle rather than after the syringe pump. This modification would reduce the interaction time to 2 seconds at a flow rate of 350 nl min−1.
In the current arrangement, both syringes are driven by a single syringe pump. Consequently, the dilution is governed by the ratio of syringe volumes. If separate syringe pumps are employed, the flow rate of the analyte solution could be reduced while the solvent flow is increased, to maintain a constant total flow rate while increasing the dilution ratio.
Results and discussion
Chromium(III) chloride
Chromium(III) chloride is the most common form of chromium currently used in dietary supplements. Its determination is therefore relevant in biological Cr studies. Fig. 2 shows representative dual mass spectra for CrCl3 generated on the ds-TOFMS. Gentle ESI conditions26 were used (i.e. nozzle = 80 V) to generate the ESI spectrum. From the ICP channel one finds the characteristic isotopic distribution for Cr+, adjacent to ArO+. Because ArCl+ is a well known isobaric interference in As speciation, its presence was considered for the characterization of CrCl3. However, even at 500 µM CrCl3 (i.e. 30 ppm Cr), no ArCl+ is visible in the ICP mass spectrum.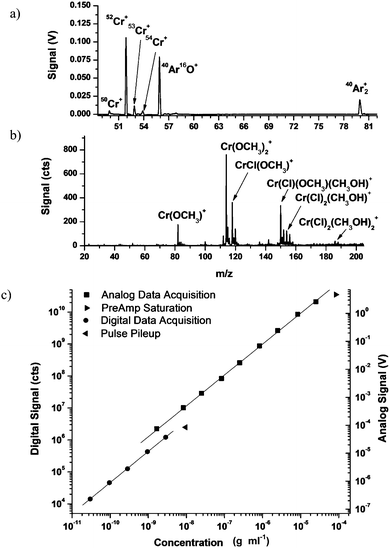 | ||
| Fig. 2 Performance of dual ICP/ESI mass spectrometer in analysis of CrCl3. (a) The ICP channel clearly shows the four isotopes of Cr adjacent to ArO+. (b) The ESI spectrum, collected under gentle conditions (nozzle = 80 V) shows adduct formation with methanol and the substitution of CH3O− for Cl−. (c) Calibration curve of 52Cr+ from the ICP channel. Roll off is encountered at 10 ppb for digital data due to pulse pileup and at 100 ppm for analog data due to preamp saturation. Error bars, smaller than each symbol, represent 1 standard deviation. | ||
A calibration curve produced for 52Cr+ from the ICP channel demonstrates a linear dynamic range of at least six orders of magnitude (cf.Fig. 2c). From the detection limit of 30 pptr to 3 ppb, the digital ion-counting mode is used and data are found to fit Equation 1 with R2 = 0.9992, where x is concentration in gm ml−1 (e.g. 10−9 = 1 ppb) and y is signal in counts. At a concentration of 10 ppb, roll off occurs due to pulse pileup in the constant-fraction discriminator. From 1 ppb to 30 ppm, analog signal processing is used and data are found to fit Equation 2 with R2 = 0.9998, where x is concentration in gm ml−1 and y is signal in V. At a concentration of 100 ppm, roll off is again encountered but now because of preamplifier saturation. Incidentally, preamp saturation can be abated and the dynamic range extended if the MCP-detector voltage is lowered. Sufficient overlap of digital and analog data occurs to effectively cover the entire concentration range from 30 pptr to 30 ppm. To a good approximation, the signal response of the ICP channel is independent of the chemical species in which an element is found. Therefore, this calibration curve holds for all Cr species discussed here.
| log10(y) = 5.53 + 1.10 log10(x) | (1) |
| log10(y) = 14.41 + 0.975 log10(x) | (2) |
From ESI-MS data, Stewart and Horlick23 noted that when CrCl3·6H2O was stored in water, Cl− ligands would exchange for OH−. Similarly, they found that when a mature aqueous stock solution of CrCl3 was diluted with methanol, CH3O− ligands coordinated with Cr and displaced OH− over the duration of their experiment (<30 minutes).23 Nevertheless, the presence of OH− and CH3O− did not change the oxidation state of the chromium atom.
In the current study, these complications were avoided by using online ESI dilution to introduce a freshly made (<1 hr), aqueous CrCl3 solution into a continuous flow of methanol before ionization by ESI. In this arrangement, the interaction time of CrCl3 with methanol was minimal and constant. In this process CrCl3 was diluted to 380 µM (i.e. 20 ppm Cr).
In the ESI section of the ds-TOFMS, speciation information is obtained in part from spectra obtained after skimmer-nozzle collisionally induced dissociation (CID). If this information is to be valid, it is essential to verify that the CID does not itself alter speciation. In the present situation, this means that Cr must retain its native oxidation state; accordingly, the effect of CID conditions was studied. In the ds-TOFMS, skimmer-nozzle CID is used to produce fragmentation in the first vacuum stage of the instrument. Prior work with proteins and peptides showed only desolvation and no appreciable fragmentation when the nozzle potential was below 100 V. However, the stability of gas-phase metal ions is significantly different from that of proteins and peptides. As can be seen in Fig. 3, when the nozzle potential is 100 V no solvent-cluster adducts are observed and sufficiently energetic CID has occurred to reduce the oxidation state of Cr. The presence of Cr+ and Cr(OCH2)+ in the mass spectra represents a change in oxidation state from Cr(III) to Cr(I) and Cr(II), respectively. When the nozzle potential is raised to >125 V (spectra not shown), Cr+ becomes the dominant spectral feature.
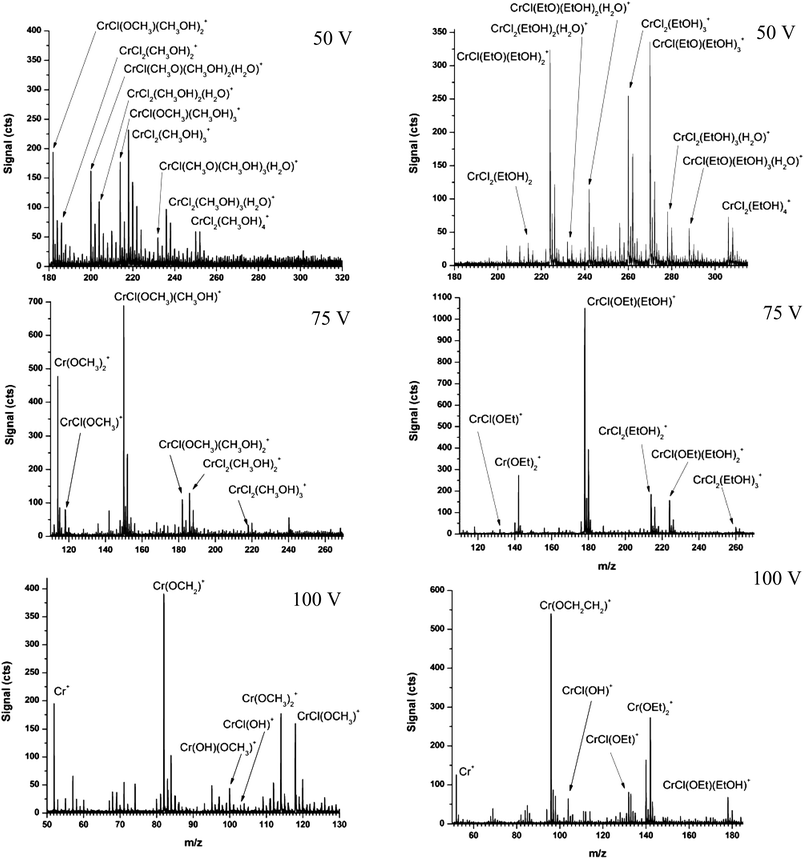 | ||
| Fig. 3 Representative ESI mass spectra of CrCl3 in methanol (left) and ethanol (right; Et = CH2CH3) when the CID nozzle potential is 50, 75, and 100 V. Note that all methanolic species on the left are present on the right as ethanolic species. | ||
When the nozzle potential is lowered to 75 V, a spectrum similar to that reported by Stewart and Horlick23 is produced. Principally, mono- and di-chlorinated species are present in the spectra. In the mono-chlorinated species, one Cl− has been replaced by OCH3−; however, the Cr center is maintained as Cr(III). Moreover, all Cr species in the spectra are present as Cr(III).
When even gentler CID conditions are employed (i.e. nozzle potential = 50 V), large solvent clusters dominate the mass spectrum. The combination of Cr and Cl isotopes with solvent adducts makes the mass spectrum too complicated to interpret directly. To alleviate the complexity introduced by large solvent clusters, the experiment was repeated with ethanol as the solvent (Fig. 3, right spectra). Because the pKa of methanol and ethanol are the same (i.e. 15.5),28 both would be expected to form similar adducts in solution. Interestingly, these sets of spectra are an aid to interpretation.
Spectra on the right of Fig. 3 were collected under the same CID conditions as on the left, but with ethanol as the solvent. One can see that overlapping species in methanol are shifted to higher masses in ethanol. Each mass shift of 14 Da indicates the addition of one CH2 group (i.e. CH3CH2O− or CH3CH2OH) in the ethanol spectrum compared to the presence of CH3O− or CH3OH in the methanol spectrum. Consequently, the relative size of the original methanol cluster can easily be determined by comparing the two sets of spectra. In particular, a mass shift of 14 Da indicates that only a single methanol moiety was attached whereas a shift of 28 Da reveals that there were two. Moreover, because ethanolic species are spread over a wider mass range, isobaric interferences are abated and the presence of Cr and Cl can be determined based on their natural isotopic abundances. Species listed in Fig. 3 are reported only if the isotopic pattern of Cr could be confirmed in the ethanol spectra and if the measured mass accuracy was better than 100 ppm in both methanol and ethanol. Importantly, each ethanolic species correlates with a methanolic species regardless of CID conditions.
It is noteworthy that only a limited set of CID conditions exist that minimize the solvent sphere around Cr(III) before the valence is reduced. Under no set of conditions were Cr(OCH3)2+ and CrCl(OCH3)+ more abundant than solvated species. Nor were suitable conditions found to produce CrCl2+ without solvent adducts. This trend demonstrates the importance of a solvent sphere to maintain the charge on gas-phase metal ions produced by ESI.
Chromium picolinate
Chromium picolinate, CrPic, represents a class of synthetic nutritional supplements29,30 intended to provide greater bioavailability. The efficacy31,32 and safety33–35 of CrPic are still widely debated. The safety debate has focused on nontoxic and effective dosage and on whether in vitro exposure to CrPic is representative of in vivo Cr species.Common ICP isobaric interferences in chromium speciation include 40Ar12C+ on 52Cr+ and 40Ar14N+ on 54Cr+. Minor interference is also possible for 53Cr+ from 39Ar14N+ and 40Ar13C+. In a matrix of 0.1 M HNO3, background 40Ar12C+ is equivalent to ca. 10 pptr 52Cr+ and ArN+ is equivalent to ca. 5 ppb 54Cr+. When organic solvents are used, additional desolvation measures must be taken to mediate the formation of ArC+. In the case of CrPic, Cr(C6H4NO2)3, the analyte itself is a potential source of interference. In CrPic, the molar ratio of C:Cr is 18:1 and N:Cr is 3:1.
To assess interferences of ArC+ and ArN+ on Cr isotopes, 1.5 × 10⁶ ICP spectra were integrated at a spectral-generation rate of 20 kHz and isotope ratios were determined for 576 nM CrCl3 and CrPic (i.e. 30 ppb Cr). This low concentration was chosen to avoid carbon deposition on the sampler cone from CrPic. The measured isotope ratios are compared to the natural abundances28 in Table 2. In both CrCl3 and CrPic, a large apparent elevation of 54Cr:50Cr is observed due to the formation of ArN+ from the matrix. This interference is in spite of the use of membrane desolvation as part of the sample introduction system. In both cases, good agreement is found between the theoretical and measured 53Cr:50Cr ratio.
| Natural Abundance28 | CrCl3 | CrPic | |
|---|---|---|---|
|
52Cr:50Cr |
19.2 | 19.4 ± 2.0 | 24.5 ± 2.6 |
|
53Cr:50Cr |
2.18 | 2.16 ± 0.23 | 2.26 ± 0.25 |
|
54Cr:50Cr |
0.54 | 2.42 ± 0.28 | 2.45 ± 0.25 |
The measured 52Cr:50Cr isotope ratio is 19.4 ± 2.0 for CrCl3, which is in good agreement with the natural ratio (i.e. 19.2). The error associated with this measurement (1σ) is attributed to appreciable disparity in relative abundance of 52Cr to 50Cr, and the low analyte concentration used for the measurement. It is noteworthy that the precision of these measurements was not affected by the addition of C and N from CrPic. In the case of CrPic, the 52Cr:50Cr ratio was determined to be 24.5 ± 2.6, which shows a significant increase over CrCl3. This inaccuracy is attributed to the formation of ArC+ within the plasma due to C from CrPic. However, the errors in both 52Cr:50Cr and 54Cr:50Cr are small considering the excess of C and N introduced from CrPic.
Interferences imposed by ArC+ and ArN+ limit isotope ratio accuracy and must therefore be taken into consideration when non-matrix matched quantification is employed. However, Cr can still be identified, in spite of these interferences. Diagnostically, the indication of Cr from the ICP channel can be used to interpret corresponding ESI spectra that are complicated by overlapping isotopic envelopes. The interference from ArC+ for CrPic underscores the care that must be taken when organic solvents are used in Cr determination.
CrPic spectra from the ESI channel show no significant solvent adducts even under gentle CID conditions in 100% methanol solvent (cf.Fig. 4a). Rather, singly charged analyte clusters form from protonation, sodiation, and potassiation of the molecular ion up to [4M + Na]+. A signal at 714.01 Da indicates the ion Cr2(Pic)5+, where Pic is the picolinate group, (C6H4NO2). The presence of this ion under very gentle CID conditions (nozzle < 20 V) indicates it is a contaminant in the original sample and not a result of instrument conditions.
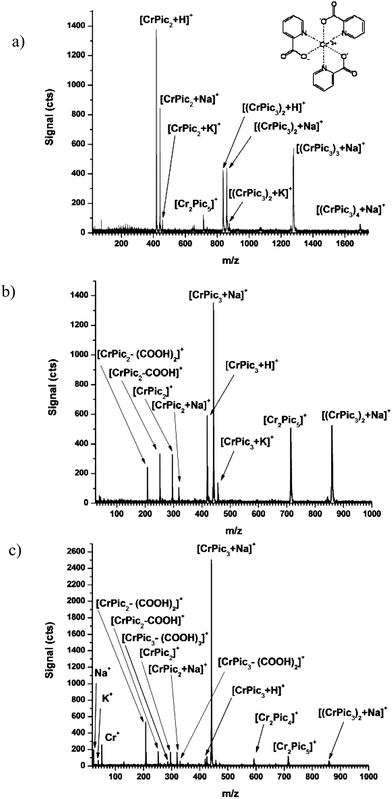 | ||
| Fig. 4 Electrospray mass spectra of CrPic collected under gentle to moderately harsh CID conditions when nozzle potential is (a) 50, (b) 100, (c) 150 V. Note the different x-axis scale for Part a. Inset of Part a shows the structure of CrPic. | ||
When the nozzle potential is raised to 100 V (cf.Fig. 4b), clusters larger than [Cr2Pic6 + Na]+ are eliminated from the mass spectrum and sodiated ions become the predominant intact molecular species. Under these conditions, characteristic fragments of CrPic begin to be generated. These fragments, identified in Fig. 4b, show either the loss of a carboxylic acid group on the picolinate ligand or of the entire picolinate ligand. The fragment ion [CrPic2 + Na]+ shows a valence reduction from Cr(III) to Cr(II).
Under moderate CID conditions (i.e. nozzle = 150 V; cf.Fig. 4c), the signal for [(CrPic3)2 + Na]+ is significantly weaker, which indicates its fragmentation. This fragmentation results in the appearance of [Cr2Pic4]+ and an enhancement in signal for [CrPic3 + Na]+. Additional fragments also arise from the loss of two carboxylic acid groups from the CrPic3 ion. It is interesting that the ions [CrPic3 + Na]+, Cr2(Pic)5+, and, when methanol is used, [(CrPic3)2 + Na]+ are detectable even under the harshest CID conditions (nozzle = 370 V; spectra not displayed), which will ordinarily eliminate intact molecular species completely.
From Fig. 4 one can see that the fragments produced by CID of CrPic are very predictable; more so than for large biomolecules. Identification based on these characteristic CID fragments illustrates the potential of the ds-TOFMS in the study of Cr metabolites. The combined quantitative and qualitative capabilities of the ds-TOFMS make it particularly well suited for the study of CrPic metabolites.
Chromium(III) acetate
Chromium(III) acetate has long been used as a mordant for tanning and dye fixation in textile fabrication36 and more recently to produce cross-linked aqueous gels for flow control in oil fields.37,38 It represents a noteworthy Cr(III) species which has also exhibited toxicological effects in biological studies.39,40 Chromium(III) acetate has been extensively characterized by FT-IR, 2H NMR, FAB-MS,41 and X-ray crystallography.42,43 The X-ray structure is shown in Fig. 5a. Unlike other Cr(III) salts, chromium(III) acetate is a trinuclear, oxo-centered, carboxylate complex that does not readily dissociate in solution. The isotopic distribution measured with ESI under gentle CID conditions (nozzle = 100 V) is found to agree well with the theoretical for the dehydrated intact molecule (cf.Fig. 5b and 5c). | ||
| Fig. 5 (a) X-ray structure of solid chromium(III) acetate reported by Figgis and Robertso.42 (b) Electrospray mass spectrum of chromium(III) acetate (nozzle = 100 V) and (c) theoretical isotopic distribution for Cr3O(CH3CO2)6+ shown as a bar plot. | ||
In the current study, chromium(III) acetate was analyzed by ESI in 99% methanol, at a concentration of 70 µM after online dilution. Fig. 6a shows an ESI mass spectrum obtained under gentle CID conditions (i.e. nozzle = 50 V). The molecular form of chromium(III) acetate is observed with up to three methanol adducts. Because online ESI dilution was used to introduce a stock aqueous solution of chromium(III) acetate into a continuous flow of methanol, a water adduct was also observed. When the stock solution was diluted with methanol and allowed to sit for several minutes, no water adducts were apparent. The use of fresh stock solution also prevented the formation of hydroxyl-substituted chromium acetate, as Tackett found to arise after the solution sat for several weeks.41 As with CrCl3, these ESI experiments were repeated with ethanol to confirm the number of methanol adducts assigned in Fig. 6.
 | ||
| Fig. 6 Representative ESI mass spectra of chromium(III) acetate when the CID nozzle potential is (a) 50, (b) 100, and (c) 150 V. Inset in frame (b) uses expanded scale to reveal low-energy CID products that appear at nozzle voltage of 100 V. Formulae for 50 V are provided within the figure, (A = CH3CO2). Formulae and mass accuracies for Parts b and c are provided in Tables 3 and 4, respectively. | ||
Careful inspection of Fig. 6a also reveals the presence of Cr3(CH2CO2)6(CH2O2)(CH3OH)2+ (unlabeled at 555.944 Da), which displays a mass shift of 28 Da in ethanol. Because the ligand CH2O22− is present in solvated clusters under very gentle sampling conditions, it is thought to be a synthesis byproduct or contamination in the original sample, rather than being due to CID. It is widely acknowledged that commercially available chromium(III) acetate has appreciable contamination from thermal degradation and synthetic byproducts.44 Tackett41 also reports the presence of chromium(III) oxalate infrared bands in many commercially produced chromium(III) acetate samples. Although chromium oxalate was not found in any of our spectra, the CH2O22− ligand may represent the reduction of the oxalate ligand.
When the nozzle potential is raised to 100 V (cf.Fig. 6b), water and methanol adducts are eliminated from the mass spectrum. All peaks maintain all three metal centers as Cr(III). The mass-to-charge ratio of the dominant feature (i.e. 525.913 Da) agrees with the reported X-ray structure42,43 in the absence of water adducts. When internal mass calibration is employed, mass accuracy for the molecular species is 6 ppm, and the isotopic distribution is found to agree well with the theoretical (cf.Fig. 5b and 5c). Lower abundance peaks are also apparent on either side of the molecular peak (cf.Fig. 6b). The mass and formula of each ion are given in Table 3. These features do not show a mass shift when ethanol is used as a solvent, which again indicates that the ligand CH2O22− is not the result of methanol adduct formation. The signal attributed to Cr3O2(CH3CO2)6 is thought to be a low-energy CID product of Cr3(CH3CO2)6(CH2O2).
| ESI Species | Calculated Mass (Da) | Measured Mass (Da) | Mass Accuracy (ppm) |
|---|---|---|---|
| Cr3A6(CH2O2)+ | 555.923 | 555.944 | 37 |
| Cr3O2A6+ | 541.908 | 541.926 | 33 |
| Cr3OA6+ | 525.913 | 525.910 | 6 |
| Cr3OA5(CHO2) + | 511.897 | 511.919 | 43 |
| Cr3OA5(CHO2)2+ | 497.882 | 497.947 | 131 |
| Cr3OA5(CHO2)3+ | 483.850 | 483.941 | 188 |
| Cr3OA5(CHO2)4+ | 469.850 | 469.871 | 45 |
| Cr3OA5(CHO2)5+ | 455.835 | 455.908 | 160 |
| Cr3O(CHO2)6+ | 441.879 | 441.939 | 136 |
The inset of Fig. 6b shows what are thought to be low-energy CID products that appear when the nozzle = 100 V, which is considered to be the upper end of the gentle CID regime. These products represent the partial fragmentation of acetate groups with the general formula Cr3O(CH3CO2)6−N(CHO2)N, where N = 1 to 6. None of these products is found as a solvated ion when the nozzle = 50 V. Signals for species with N = 2 through 6 produce significantly fewer counts, which results in slightly poorer mass accuracy. However, the isotopic ratio confirms the presence of three Cr atoms and the iterative loss of 14 Da up to six times from Cr3O(CH3CO2)6 strongly supports a low-energy fragmentation hypothesis.
Under moderate CID conditions (i.e. nozzle = 150 V; Fig. 6c), the signal for Cr3O(CH3O3)6+ is significantly reduced and extensive fragmentation is observed. A list of measured masses and assigned formulae is given in Table 4. When internal mass calibration is used, measured mass accuracies are ≤86 ppm.
| ESI Species | Calculated Mass (Da) | IMC Measured Mass (Da) | IMC Accuracy (ppm) | Cr Oxidation State |
|---|---|---|---|---|
| Cr3OA6+ | 525.913 | 525.929 | 30 | III |
| Cr3OA5+ | 466.900 | 466.892 | 17 | III,III,II |
| Cr3O2A4+ | 423.881 | 423.878 | 7 | III |
| Cr3OA4+ | 407.886 | 407.891 | 12 | III,II,II |
| Cr3O2A3OH+ | 381.871 | 381.860 | 29 | III |
| Cr3O2A3+ | 364.868 | 364.882 | 38 | III,III,II |
| Cr2OA4+ | 355.940 | 355.947 | 20 | IV,III |
| Cr3OA3+ | 348.873 | 348.886 | 37 | II |
| Cr2A4+ | 339.945 | 339.940 | 15 | III,II |
| Cr3O3A2+ | 321.849 | 321.842 | 22 | III |
| Cr2OA3OH+ | 313.930 | 313.903 | 86 | IV,III |
| Cr2OA3+ | 296.927 | 296.923 | 13 | III |
| Cr2A3+ | 280.932 | 280.921 | 39 | II |
| Cr2OA2OH+ | 254.916 | 254.910 | 24 | III |
| Cr2O2A2+ | 253.909 | 253.908 | 4 | IV,III |
| Cr2OA2+ | 237.914 | 237.924 | 42 | III,II |
| Cr2OA(OH)2+ | 212.906 | 212.904 | 9 | III |
| Cr2O2A+ | 194.895 | 194.894 | 5 | III |
| Cr2OA+ | 178.900 | 178.885 | 84 | II |
| CrA2+ | 169.973 | 169.968 | 29 | III |
| CrAOH+ | 127.962 | 127.953 | 70 | III |
| CrA+ | 110.959 | 110.963 | 36 | II |
Unlike for gentle CID conditions, ion fragments observed under moderate CID conditions do not necessarily preserve the native oxidative state of the parent ion. Many fragment ions indicate reduction of Cr(III) to Cr(II) for at least one metal site, while in the same spectrum, other fragments (e.g. Cr2O2(CH3CO2)+) have undergone considerable fragmentation yet maintained Cr in the trivalent oxidation state. Interestingly, some fragments (e.g. Cr3O(CH3CO2)4+) have Cr centers in mixed valence states.
Oxidation states for three fragments could be only tentatively assigned as IV and III: Cr2O(CH3CO2)4+, Cr2O(CH3CO2)3OH+, and Cr2O2(CH3CO2)2+. The peaks attributed to these formulae agree very well with the theoretical mass and isotope distribution. Furthermore, Cr2O2(CH3CO2)2+ was identified also by Tackett with FAB-MS.41 These three formulae would seem to indicate the oxidation of one metal site from Cr(III) to Cr(IV). However, it is thought that the valences of the individual metal atoms of trinuclear, oxo-centered, carboxylate complexes are not necessarily localized.45,46 Changes in the solvated molecules have been shown to dramatically affect symmetry and electron transfer in these mixed-valence complexes.47 In addition, relatively small changes in temperature (e.g. 100-150 °C) have been shown to affect bond length and electron transfer dramatically.47,48 The CID process consists of a rapid drop in temperature and pressure from the heated capillary of the ESI interface (i.e 170 °C) to the first vacuum stage, where energetic collisions strip away solvent adducts and produce fragments. It is suspected that the presence of Cr(IV) fragments is due to a multi-step CID process with desolvated, asymmetric intermediate ions.
Under harsh CID conditions (i.e. nozzle = 370 V; spectra not shown) Cr+ is the dominant signal and the only ions in Table 4 that remain have mass-to-charge ratios below 200, albeit at significantly lower count rates.
Potassium dichromate
Potassium dichromate is a widely discussed Cr(VI) species because of its environmental impact and its presence in industrial waste.49–51 Potassium dichromate is well known to be a strong oxidizing agent, which results in carcinogenic, mutagenic, and teratogenic behavior in biological systems. Most commonly, negative ESI is used to study CrO42− systems due to its native anionic state; however, as this work will show, a wealth of information can also be obtained with positive-ion ESI.The anion CrO3(OCH3)−, observed by Stewart and Horlick with negative ESI-MS,23 arises as an intermediate in the oxidation of methanol to formaldehyde by chromate. In our own work, CrO42− has been found to be stable in aqueous solutions over periods of several months. To limit the reaction time of Cr2O72− with the organic solvent, online ESI dilution was used to inject an aqueous solution of K2Cr2O7 into a continuous flow of organic solvent immediately prior to ionization with ESI. Consequently, a variety of instrument and spray conditions can be studied with a set sample-reaction time.
When 300 µM K2Cr2O7 is analyzed by ESI, a variety of multiply potassiated CrO42− ions are observed. The abundance of K+ in solution promotes multiple potassiation of the CrO42− anion to produce positive ESI ions. The presence of these potassiated chromate ions indicates limited interaction with the solvent, as will be discussed in the next section of this paper. When 99% methanol is used as the solvent, the methanol oxidation intermediate is detected as the dominant ion K2CrO3(OCH3)+ (cf.Fig. 7a). Clusters of this intermediate reaction product are found in the form Kn + 1CrnO3n(OR)n+, where R is the alkyl chain of the alcohol solvent (i.e. CH3 for methanol), for n = 1 to 3. Similarly, when absolute ethanol is used as a solvent (cf.Fig. 7b), the intermediate K2CrO3(OCH2CH3)+ is observed in the mass spectrum (cf.Fig. 7b). Additional ethanolic clusters are observed for up to n = 3.
 | ||
| Fig. 7 Electrospray mass spectra of K2Cr2O7 in (a) methanol and (b) ethanol. The oxidation intermediates of methanol and ethanol are observable in positive ESI due to the potassiation of the negative ion. When ethanol is used as an alternative solvent, a mass shift of 14 Da is observed for each ethoxide intermediate present in the cluster. Harsh CID conditions (i.e. nozzle = 200 V) were used in this work. | ||
Harsh CID conditions (i.e. nozzle = 200 V) were used in this work to eliminate solvent clusters that riddled the mass spectrum under gentle and moderate conditions. However, the intermediate reaction product and the potassiated salts showed little fragmentation even under harsh CID conditions. Also, clusters of the form Kn + 1CrnO3n(OR)n+ do not exhibit reduction of Cr from the VI state.
Potassium dichromate in acetic acid
Sahureka and co-workers52 recently reported a number of Cr2O42− species detected by positive ESI with a matrix of 50:50:1 water:methanol:acetic acid. The most abundant species reported for K2Cr2O7 was K2HCrO4+. Other species were typically multiply potassiated and protonated ions (e.g. K4H3Cr3O12+, K3H2Cr2O8+). Their work used discrete 10 µl injections and an ESI flow rate of 10 µl min−1, in order to limit the reaction of CrO42− with the solvent. This effort appeared to have been successful. As has already been discussed, CrO42− is known to oxidize methanol, but the use of acetic acid introduces additional oxidation products to be considered.
To study the interaction of K2Cr2O7 with this common matrix, a stock solution of K2Cr2O7 (aq) was diluted to 70 µM in 50:50:1 water:methanol:acetic acid and immediately analyzed by ESI. The first spectrum was collected four minutes after dilution; 631580 spectra were integrated and recorded every 60 sec thereafter. To fully desolvate ions and produce characteristic fragment ions, moderate CID conditions were used (i.e. nozzle = 125 V); some fragmentation is expected. In this arrangement, the sample in the ESI syringe continues to react with the matrix over the duration of the experiment, so each integrated spectrum represents a snapshot of the species present in solution.
Representative ESI mass spectra collected 5, 10, 30, and 60 minutes after dilution are shown in Fig. 8. After 5 minutes, primarily potassiated chromate species are observed, similar to those reported by Sahureka and co-workers.52 As was observed with online ESI dilution, the oxidation intermediate, K2CrO3(OCH3)+, is also observed. Signals for large potassiated ions (i.e. K3Cr2O7+ and K5Cr3O11+) quickly decrease over the first 30 minutes and are quickly dwarfed by an abundance of chromium acetate signals. The signal for K3CrO4+ shows little change for the first 30 minutes but declines steadily thereafter. Even though moderately harsh CID conditions were employed, most potassiated chromium species remain as Cr(VI), and chromium species that are protonated and potassiated show reduction to Cr(V).
 | ||
| Fig. 8 Representative ESI mass spectra, obtained under moderate CID conditions (i.e. nozzle = 125 V), of K2Cr2O7 in 50:50 water:methanol mixture with 1% acetic acid after 5, 10, 30, and 60 minutes of solution aging. Each displayed mass spectrum consists of 631580 integrated spectra. (A = CH3CO2). | ||
While potassiated chromate signals quickly drop, the signal for K2HCrO4+ climbs 10-fold over the first hour and then changes by less than 10% during the remainder of the experiment. Chromium acetate complexes are observable after 10 minutes and become the dominant species in solution after 30 minutes. These species indicate reduction of Cr(VI) to Cr(III). It should be noted that ions shown in Fig. 8 for 30 minutes closely match those in Table 4. At the end of 1 hour, Cr4O3(CH3CO2)5+ is detectable and after 2 hours (spectrum not shown), a small amount of Cr3O(CH3CO2)6+ can be measured.
The formation of chromium(III) acetate complexes underscores the importance of careful solvent selection and timely analysis of reactive species such as Cr(VI). When a 200 µM solution of K2Cr2O7 in 50:50:1 water:methanol:acetic acid is allowed to stand for 12 hours, the characteristic orange color diminishes and no Cr(VI) species are detectable by ESI. After two days, a precipitate becomes evident and the solution is colorless. Although the synthesis of Cr3O(CH3CO2)6+ was not the intention of this work, the identification of this complex from characteristic CID fragments illustrates the utility of a parallel molecular channel of information to elemental speciation analysis.
Conclusions
The dual-source time-of-flight mass spectrometer has been shown to combine the element-specific, quantitative characteristics of ICP-MS with the molecular speciation attributes of ESI-MS in a single instrument to provide improved capabilities for the speciation analysis of chromium. The ICP channel offered detection limits of 30 pptr for Cr and a dynamic range of at least 6 orders of magnitude. Modification of the ion optics is expected to improve these figures by another order of magnitude. In the case of CrCl3, the isotope ratio 52Cr:50Cr was found to agree well with the theoretical while CrPic showed a significant elevation in this ratio. The erroneously high ratio is attributed to the formation of ArC+ due to C present in the analyte. Also, significant interference was observed for ArN+ on 54Cr+ in both analytes. These interferences must be considered when ICP-MS data are interpreted. However, the qualitative identification of Cr in the ICP channel can aid in the unraveling of ESI spectra, which is often complicated by the presence of multiple charge states, solvent adducts, and overlapping isotopic envelopes.
From the ESI channel of information, adduct formation and anion exchange was observed for CrCl3. When ethanol was used as an alternative solvent, the size of the solvent sphere was readily apparent and could be used to ascertain the oxidation state of the Cr center. The interaction of Cr with the solvent suggests it is best to minimize the complexity of the solvent for straightforward identification. In many cases, the solvent can be selected to provide additional chemical information and to remove spectral interferences. Most importantly, the native oxidation state of chromium is maintained throughout the ESI process and identification of molecular species lessens the need for analyte standards.
The molecular channel of information has been shown to be invaluable in the determination of sample-solvent interactions. The formation of chromium(III) acetate in a common ESI matrix underscores how careful use of skimmer-nozzle CID can provide invaluable information for the determination of reaction products and intermediates. These data underscore the utility of a parallel molecular channel of information for the identification of unresolved chromatographic bands. The simple and predictable CID fragmentation observed for Cr species, in conjunction with isotopic and quantitative ICP information, makes the ds-TOFMS a very promising platform for the study of metal-containing metabolites.
In the presented work, mass accuracies on the ESI channel were typically below 200 ppm and in many cases below 10 ppm. In TOFMS, mass accuracy is poorer for low abundance ions and in the presented work the best mass accuracy was found for the most abundant signals. Therefore, further improvements in sensitivity are expected to lead to greater mass accuracy. Future studies will focus on the use of chemical separations with the ds-TOFMS for online elemental speciation. The future use of HPLC with the ds-TOFMS will facilitate elemental speciation of Cr in complex biological matrices.
Acknowledgements
The authors acknowledge the contribution of Alexander Graham to background work that contributed to present study. The authors thank Barry Stein of the Indiana University Microscopy Facility for use of the electron microscope vapor deposition unit. The authors would like to thank Spex CertiPrep (Metuchen, NJ USA) for the generous contribution of ICP standard solutions for this work and both LECO Corp. (St. Joseph, MI USA) and Cetac (Omaha, NE USA) for the loan of scientific equipment used in this studyThis work was supported by the National Science Foundation through grant number CHE-0520777 and by the U.S. Department of Energy through grant DE-FG02-98ER14890.
Notes and references
- E. Rupp and K. Kropat, Apoth. Ztg., 1912, 27, 377–378 Search PubMed.
- S. Hirata, K. Honda, O. Shikino, N. Maekawa and M. Aihara, Spectrochim. Acta, Part B, 2000, 55, 1089–1099 CrossRef.
- R. J. Noga, Anal. Chem., 1975, 47, 332–333 CrossRef CAS.
- G. Narsimhan and S. A. Saletore, Journal of the Indian Chemical Society, Industrial and News Edition, 1950, 13, 138–146 Search PubMed.
- W. O. Robinson, Soil Science, 1945, 59, 93–95 CAS.
- S. Langard, One hundred years of chromium and cancer: a review of epidemiological evidence and selected case reports, Department of Occupational Medicine, Telemark Central Hospital, Porsgrunn, Norway, United States, 1990 Search PubMed.
- M. J. Tsapakos and K. E. Wetterhahn, Chem.-Biol. Interact., 1983, 46, 265–277 CrossRef CAS.
- J. Aiyar, K. M. Borges, R. A. Floyd and K. E. Wetterhahn, Toxicol. Environ. Chem., 1989, 22, 135–148 CAS.
- K. E. Wetterhahn and J. W. Hamilton, Sci. Total Environ., 1989, 86, 113–129 CrossRef CAS.
- K. W. Jennette, Environ. Health Perspect., 1981, 40, 233–252.
- A. Kortenkamp and D. Beyersmann, Toxicol. Environ. Chem., 1987, 14, 23–32 CrossRef CAS.
- T. Narukawa, K. Inagaki, T. Kuroiwa and K. Chiba, Talanta, 2008, 77, 427–432 CrossRef CAS.
- P. Cuderman, I. Kreft, M. Germ, M. Kovacevic and V. Stibilj, J. Agric. Food Chem., 2008, 56, 9114–9120 CrossRef CAS.
- K. Bierla, J. Szpunar and R. Lobinski, Anal. Chim. Acta, 2008, 624, 195–202 CrossRef CAS.
- Y. Higashikawa, Y. Kazui, S. Suzuki and O. Ohtsuru, Journal of Analytical Toxicology, 2008, 32, 344–348 Search PubMed.
- F. Seby, S. Charles, M. Gagean, H. Garraud and O. F. X. Donard, J. Anal. At. Spectrom., 2003, 18, 1386–1390 RSC.
- V. Nischwitz and S. A. Pergantis, Rapid Commun. Mass Spectrom., 2006, 20, 3579–3585 CrossRef CAS.
- V. Nischwitz and S. A. Pergantis, Environ. Chem., 2007, 4, 187–196 CrossRef CAS.
- B. K. Mandal, K. T. Suzuki, K. Anzai, K. Yamaguchi and Y. Sei, J. Chromatogr., B: Anal. Technol. Biomed. Life Sci., 2008, 874, 64–76 CrossRef CAS.
- M. Dernovics, P. Giusti and R. Lobinski, J. Anal. At. Spectrom., 2007, 22, 41–50 RSC.
- R. G. Wuilloud, J. C. Altamirano, P. N. Smichowski and D. T. Heitkemper, J. Anal. At. Spectrom., 2006, 21, 1214–1223 RSC.
- G. R. Agnes, I. I. Stewart and G. Horlick, Appl. Spectrosc., 1994, 48, 1347–1359 CAS.
- I. I. Stewart and G. Horlick, J. Anal. At. Spectrom., 1996, 11, 1203–1214 RSC.
- D. A. Barnett and G. Horlick, J. Anal. At. Spectrom., 1997, 12, 497–501 RSC.
- D. A. Rogers, S. J. Ray and G. M. Hieftje, Metallomics, 2009, 1, 67–77 RSC.
- D. A. Rogers, S. J. Ray and G. M. Hieftje, Metallomics, 2009 Search PubMed Submitted.
- D. A. Rogers, S. J. Ray and G. M. Hieftje, Metallomics, 2009 Search PubMed Submitted.
- CRC Handbook of Chemistry and Physics, 89th Edition (Internet Version 2009) CRC Press/Taylor and Francis Boca Raton, FL. 2009 Search PubMed.
- Application: US, 80-176234; 176234, 1981.
- Application: US, 98-144026; 5948772, 1999.
- D. L. Hasten, E. P. Rome, B. D. Franks and M. Hegsted, International journal of sport nutrition, 1992, 2, 343–350 Search PubMed.
- B. Bahadori, S. Wallner, H. Schneider, T. C. Wascher and H. Toplak, Acta medica Austriaca, 1997, 24, 185–187 CAS.
- D. M. Stearns, J. P. WiseSr., S. R. Patierno and K. E. Wetterhahn, FASEB Journal, 1995, 9, 1643–1649 CAS.
- M. M. Bailey, J. G. Boohaker, R. D. Sawyer, J. E. Behling, J. F. Rasco, J. J. Jernigan, R. D. Hood and J. B. Vincent, Birth Defects Res., Part B, 2006, 77, 244–249 Search PubMed.
- J. R. Komorowski, D. Greenberg and V. Juturu, Toxicol. in Vitro, 2008, 22, 819–826 CrossRef CAS.
- G. v. Georgievics, The Chemical Technology of Textile Fibres: Their Origin, Structure, Preparation, Washing, Bleaching, Dyeing, Printing, and Dressing, Scott, Greenwood & Co., London. 1902 Search PubMed.
- Application: GB, GB, 86-25445, 2183692, 1987.
- B. Zou, C. S. McCool, D. W. Green, G. P. Willhite and M. J. Michnick, Year.
- E. Rudolf and M. Cervinka, Toxicol. Lett., 2009, 188, 236–242 CrossRef CAS.
- S. Chaudhary, J. Pinkston, M. M. Rabile and J. D. Van Horn, J. Inorg. Biochem., 2005, 99, 787–794 CrossRef CAS.
- J. E. Tackett, Appl. Spectrosc., 1989, 43, 490–499 CAS.
- B. N. Figgis and G.b Robertso, Nature, 1965, 205, 694 CAS.
- S.-C. Chang and G. A. Jeffrey, Acta Crystallogr., Sect. B: Struct. Crystallogr. Cryst. Chem., 1970, 26, 673–683 CrossRef CAS.
- M. Eshel and A. Bino, Inorg. Chim. Acta, 2001, 320, 127–132 CrossRef CAS.
- M. B. Robin and P. Day, Adv. Inorg. Chem., 1967, 10, 247–422 CAS.
- M. K. Johnson, D. B. Powell and R. D. Cannon, Spectrochimica Acta, Part A: Molecular and Biomolecular Spectroscopy, 1981, 37A, 995–1006 Search PubMed.
- S. M. Oh, D. N. Henderickson, K. L. Hassett and R. E. Davis, J. Am. Chem. Soc., 1985, 107, 8009–8018 CrossRef CAS.
- K. J. Schenk and H. U. Guedel, Inorg. Chem., 1982, 21, 2253–2256 CrossRef CAS.
- A. K. Patlolla, C. Barnes, D. Hackett and P. B. Tchounwou, Int. J. Environ. Res. Public Health, 2009, 6, 643–653 Search PubMed.
- A. K. Mishra and B. Mohanty, Sci. Total Environ., 2009, 407, 5031–5038 CrossRef CAS.
- F. C. Bauer, Jr., E. F. Hirsch, L. Carbonaro and G. C. Johnson, A.M.A. archives of pathology, 1953, 56, 135–141 Search PubMed.
- F. Sahureka, R. C. Burns and E. I. von Nagy-Felsobuki, Inorg. Chim. Acta, 2002, 332, 7–17 CrossRef CAS.
| This journal is © The Royal Society of Chemistry 2010 |