Chemical looping combustion of coke oven gas by using Fe2O3/CuO with MgAl2O4 as oxygen carrier
Received
11th December 2009
, Accepted 20th May 2010
First published on
5th August 2010
Abstract
Chemical looping combustion (CLC) is a new combustion technology that is clean and highly efficienct. The reactivity of four potential oxygen carrier particles composed of Fe2O3/CuO and MgAl2O4 have been investigated using thermogravimetric analysis (TGA) and a laboratory pressurized circulating fluidized bed system. According to the research, the following findings can be made: first, oxygen carrier particles consisting of 45% Fe2O3 and 15% CuO supported on 40% MgAl2O4 (F45C15M40) were found to be the best oxygen carrier for CLC of coke oven gas (COG). Secondly, results of multicycle reduction–oxidation tests in TGA showed that the reactivity of F45C15M40 oxygen carrier remained high and stable after 15 reduction–oxidation reaction cycles. Thirdly, the reaction temperature and cycle number showed a great effect on the reactivity of the oxygen carrier and this was attributed to the high chemical reaction rate of oxygen carrier and morphological change in CuO at high temperature. The pressurized CLC unit was in continuous operation with fuel for a duration of 15 h. The pressurized circulating fluidized bed system for CLC was found to work well with F45C15M40 oxygen carriers. It showed high reactivity in a fluidized bed reactor and gave a high conversion of the fuel, as well as reasonable crushing strength and resistance toward agglomeration and fragmentation. The maximum fuel conversion reached 92.33%.
Broader context
The utilization of COG is limited and still at a very low level in China. Unless it is effectively and economically utilized, it not only causes the pollution of the environment but is also a large waste resources. In addition, combustion of fossil fuels releases a massive amount of carbon as carbon dioxide into the atmosphere. To address these issues, we present here a new method for the combustion of COG based on Fe2O3/CuO and MgAl2O4 as the oxygen carrier for chemical looping combustion (CLC). In CLC, the products CO2 and H2O are not diluted with N2 from the combustion atmosphere, and pure CO2 can be obtained without expending any extra energy needed for separation. Considering this unique characteristic, CLC appears to have the potential for delivering a very efficient and low cost technology, especially for increasing thermal efficiency in power generation stations and for CO2 capture with minimum energy losses.
|
1. Introduction
The coking process generates a large amount of coke oven gas (COG), which is mainly made up of hydrogen and methane. China is a vast country abundant in COG resources. But in fact, the utilization of COG is limited and still at a very low level.1 If not being used efficiently and economically, COG would cause serious pollution to the environment. Meanwhile, it is also a large waste of natural resources. In this paper, a new method for the combustion of COG based on the chemical looping concept is proposed by the authors to solve the above problems. Chemical looping combustion (CLC) has been suggested as an energetically efficient method for capture of CO2 from the combustion of fuel.2 The CLC process is accomplished by using two reactors and a circulating metal oxide, see Fig. 1. The oxygen carrier constantly circulates between the fuel reactor and air reactor. In the fuel reactor, it is reduced by the fuel, and is oxidized to CO2 and H2O through reaction (1). In the air reactor, it is oxidized to its initial state with O2 through (2). Due to the fact that the fuel and air are separated in CLC, the combustion products of CO2 and H2O are not diluted with nitrogen, which means that by condensing the H2O, it is possible to obtain almost pure CO2 without expending any extra energy needed for separation. The combustion mode changes from the traditional gas–gas reaction to a gas–solid reaction through the use of COG in CLC. In this method of combustion the gas and solid have strong and complete contact with each other, therefore it is suitable for dealing with the low calorific value and complicated composition of COG.| | | (2n + m)MxOy + CnH2m → (2n + m)MxOy−1 + mH2O + nCO2 | (1) |
Oxygen carriers can carry oxygen and heat in CLC system, so it is a crucial element that has great importance in the whole process. Oxygen carriers are usually consist of active components and inert carriers. The oxygen carrier particles must be resistant to mechanical and chemical degradation by attrition, agglomeration, fragmentation, composition changes, etc. To date, results of numerous researches show that several metal/metal oxides have been investigated for potential use as oxygen carriers in CLC, e.g. Ni/NiO, Fe2O3/Fe3O, Cu/Cu2O and MnO/Mn3O4.3–6 To increase the performance of these active materials, they should be supported by an inert material which provides a larger surface area for reaction and may act as a binder to increase their mechanical strength and hence their attrition resistance.3 These inert materials include SiO2, Al2O3, ZrO2, TiO2, MgO, YSZ, NiAl2O4, MgAl2O4 and CoAl2O4.7–10 Iron oxide has large natural reserves and is relatively inexpensive, both of which are very important in CLC for commercial applications in the future. In addition, iron oxide does not agglomerate, retains activity and remains durable through multiple oxidation–reduction cycles. However, the ability of carrying oxygen is poor and it has a low reaction speed compared with nickel and copper oxides, so the quantity needed is larger than for the other two oxygen carriers.11 Copper oxide has higher reactivity and it is easier to make the fuel react completely to generate CO2 and H2O. Copper oxide is exothermic in oxidation–reduction, so it is not necessary to provide extra energy in the reduction reaction. However, its defect is that its high temperature resistant performance is not strong.12,13 Spinel MgAl2O4 offers a desirable combination of properties such as high melting point, high resistance to chemical attack and high strength at elevated temperatures.14 Mattisson et al. developed iron oxides on six different inert materials and of different mass active oxide/inert support ratios. Of these, 60% Fe2O3 on 40% MgAl2O4 showed the highest reactivity in a fluidized bed reactor, as well as reasonable crushing strength and resistance toward agglomeration and fragmentation.11 Johansson et al. examined and optimized different ratios of Fe2O3 to MgAl2O4 as well as different sintering temperatures for chemical looping combustion. They found 60% Fe2O3 on 40% MgAl2O4 sintered at 1100 °C was the most suitable oxygen carrier. The particle had a high reactivity and showed no tendency to agglomerate or break apart during the cyclic tests.15
Here, we propose a new oxygen carrier based on Fe2O3/CuO supported on MgAl2O4, the purpose of this work is to asses its feasibility as an oxygen carrier for CLC. Particles were prepared with different ratios of Fe2O3 to CuO. Multicycle redox tests were investigated using thermogravimetric analysis (TGA) and a hot laboratory-sized pressurized circulating fluidized bed, respectively. Additionally, the structural and mechanical properties of these samples were investigated by means of powder XRD, BET surface area measurements, scanning electron microscopy and energy dispersive X-ray spectrometry.
2. Experiments
2.1 Oxygen carrier preparation
Four different types of oxygen carriers were prepared by mechanical mixing. In this process, Al2O3 and MgO powder were mixed according to desired mass ratio and stirred uniformly. The mixture was then put into a muffle furnace to sinter at 1300 °C for 6 h using a heating rate of 10 °C min−1 to get MgAl2O4. Then Fe2O3/CuO and MgAl2O4 powder were mixed with a mass ratio of 3![[thin space (1/6-em)]](https://www.rsc.org/images/entities/char_2009.gif) :2, they were stirred uniformly and mixed with distilled water to obtain a paste. The paste was then extrusion moulded in a tablet machine and dried at 110 °C for 24 h in an oven and sintered at 900 °C for 3 h in muffle furnace. The oxygen carriers were then sieved to a size range of 100–200 μm. In this paper, each oxygen carrier sample will be presented in the form F45C15M40, which signifies in order of appearance, Fe2O3 (F), 45% of Fe2O3 (45); CuO (C), 15% of CuO (15); MgAl2O4, 40% of MgAl2O4 (40). Similarly, the four oxygen carriers are marked as F60M40, F45C15M40, F30C30M40 and C60M40, respectively.
:2, they were stirred uniformly and mixed with distilled water to obtain a paste. The paste was then extrusion moulded in a tablet machine and dried at 110 °C for 24 h in an oven and sintered at 900 °C for 3 h in muffle furnace. The oxygen carriers were then sieved to a size range of 100–200 μm. In this paper, each oxygen carrier sample will be presented in the form F45C15M40, which signifies in order of appearance, Fe2O3 (F), 45% of Fe2O3 (45); CuO (C), 15% of CuO (15); MgAl2O4, 40% of MgAl2O4 (40). Similarly, the four oxygen carriers are marked as F60M40, F45C15M40, F30C30M40 and C60M40, respectively.
The major components of COG in the experiment are shown in Table 1.
Table 1 Composition of COG/%(v)
| Component |
H2 |
CH4 |
CO |
CO2 |
N2 |
| Volume content (%) |
59 |
28 |
7 |
3 |
3 |
2.2 Experimental set-up and procedure
The experimental study was carried out by thermogravimetric analyzer (TGA) and laboratory-sized pressurized circulating fluidized bed system respectively. TGA experiments were conducted in WCT-2C, which was produced by Beijing Optics Instrument factory.
The CLC system was designed for a fuel power range of 3–10 kWth for either syngas or natural gas as the fuel. Fig.2 shows the schematic diagram of this laboratory unit. The system consists of an air reactor (1) where the metal oxides are oxidized and led to a cyclone by a riser (4) where gas and solid particles are separated, exhaust gas is discharged from the cyclone exit, oxygen carriers particles fall into the solid reservoir (5) and then fall into the fuel reactor (2) via a solids valve (6). The air reactor was 0.5 m in length and 70 mm in diameter, the fuel reactor was 0.5 m in length and 102 mm in diameter. Two porous quartz plates, on which the oxygen carrier sample is applied, are located above the bottom of the fuel reactor and air reactor. During operation, the sample is fluidized by adding gas to the bottom of the two reactors, and the porous plate acts as gas distributor. In order to reach a suitable temperature, the two reactors are placed inside an electrical heater. Reactors temperatures are measured using thermocouples enclosed in quartz shells. The exhaust gas from the fuel reactor is led to a cooler, in which the water is removed. The pressure difference is measured along the two reactors using pressure transducers. The system maximum heat resistance temperature is 950 °C and maintains the pressure at 0.3 MPa during the whole experiment process.
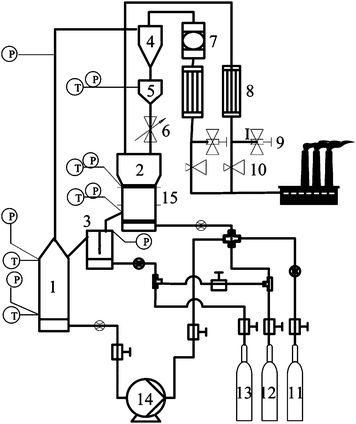 |
| | Fig. 2 Schematic description of the CLC facility. 1 – air reactor; 2 – fuel reactor; 3 – loop seal; 4 – cyclone; 5 – solid reservoir; 6 – solids valve; 7 – filter; 8 – condensing equipment; 9 – sample point; 10 – back pressure valve; 11 – air; 12 – methane; 13 – nitrogen; 14 – air compressor; 15 – electrical heater | |
Before the system was filled with fuel, 2.3 kg and 2.4 kg oxygen carrier was added to the air reactor and fuel reactor, respectively. In the very beginning, N2 was introduced for 100 s to avoid air and COG mixing during the shift between the reducing and oxidizing phase. After the remaining air was purged completely, we began to pump in the COG and air. The inlet superficial gas velocity into the reactor was 0.09–0.22 m s−1 in the reduction phase and 0.55–1.25 m s−1 in the oxidation phase. In this way, a continuous circulation of chemical looping combustion was obtained. After all conditions were continuous and steady for 30 min, we extracted the first gas sample from the sample point and kept doing the same every 5 min 9 subsequent times. The gas samples were examined by gas chromatography (HP6890), which is indispensable for measuring the concentration of CO2, CO, CH4 and H2. At the end of the experiment, oxygen carrier samples which we got from the fuel and air reactor were characterized by SEM and compared with those before the experiment.
3. Results and analysis
To evaluate the reaction performance and stability of the four different types of oxygen carriers, numerous reduction and oxidation cycles were conducted by TGA within the temperature range of 750–900 °C. The weight of oxygen carrier samples were 15 mg and the particle size range was 0.1–0.2 mm. Samples were heated in a quartz bowl to the reaction temperature with a nitrogen purge. COG was used for the reduction segment, and dry air was utilized for the oxidation segment. Reaction gas flow rates were set at 60 mL min−1, reduction reaction time was 10 min and oxidation reaction time was 60 min for all experiments. To avoid the addition of air into the reduction gas, the system was flushed with nitrogen for 5 min before and after each reaction phase.
In order to characterize the redox properties of oxygen carrier, the fractional conversions (X) were calculated utilizing the TGA data. The fractional conversion (X) is defined as shown below.
| |  | (3) |
| | 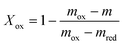 | (4) |
Where Xred is the fractional reduction, Xox is the fractional oxidation, mox is the weight of the fully oxidized sample, m is the instantaneous weight of the metal oxide, and mred is the weight of the fully reduced sample.
3.1.1 Effect of active components.
The oxygen carrier studied in this paper used two metal oxides as its active components. Owing to the reason that different metal oxides possess different reaction characteristics, therefore, as oxide carriers, they will produce different results. Based on this fact, it is easy to conclude that metal oxides have great effect on the reaction characteristic. Fig. 3 shows the effect of the active components on the reduction properties of oxygen carrier at 900 °C. As shown in the Figure, with reducing of Fe2O3 content and increasing of CuO content, the Xred displayed a sharp increase but the conversion time was significantly reduced.
 |
| | Fig. 3 Effect of active components on properties of oxygen carriers. | |
The results of the XRD composition analysis of Fe2O3/MgAl2O4, Fe2O3–CuO/MgAl2O4, CuO/MgAl2O4 after reduction are shown in Table 2. It can be seen from the composition analysis results that Fe3O4 was not reduced to Fe completely at 900 °C but to the mixture containing a Fe3O4 phase, FeO phase and Fe phase. While after reduction, CuO was reduced to Cu and CuAl2O4, this is why pure CuO oxygen carrier conversion is not 1.
| Sample |
T/°C |
Composition of fresh sample |
Composition of reduced sample |
|
Indicates trace amount.
|
| Fe2O3/MgAl2O4 |
900 |
Fe2O3, Fe3O4, MgAl2O4 |
Fe3O4, FeO, Fe, MgAl2O4 |
| Fe2O3–CuO/MgAl2O4 |
900 |
Fe2O3, Fe3O4, CuO, Cu2O, CuAl2O4a, MgAl2O4 |
Fe3O4, FeO, Fe, Cu, CuAl2O4a, MgAl2O4 |
| CuO/MgAl2O4 |
800 |
CuO, Cu2O, CuAl2O4, MgAl2O4 |
Cu, CuAl2O4a, MgAl2O4 |
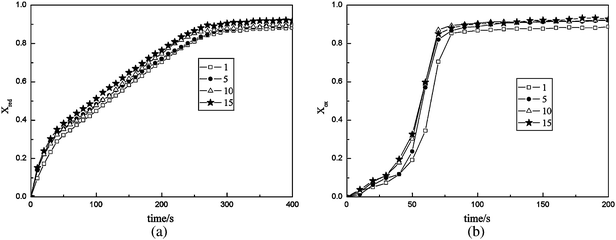
3.1.2 Effect of cycle number.
In this study, 15 cycles of TGA experimental data for the F45C15M40 oxygen carrier were utilized to analyze the effect of cycle numbers on redox reaction properties at a reaction temperature of 900 °C. Panels (a) and (b) in Fig. 4, show F45C15M40 oxygen carrier in the 1st, 5th, 10th and 15th cycles of reduction reaction and oxidation reaction, respectively. Fig. 4 (a) shows that with the increase of cycle number, the reduction properties increase monotonically. Fig. 4 (b) shows that the fractional conversion of oxygen carrier in the 1st cycle was lower than that in the 5th, and the fractional conversion of oxygen carrier increased only a little bit from the 5th to 15th cycles. This is explained by the fact that oxygen carrier particles produced granular cracks in multiple cycles, the pore volume and specific surface area increased, which increased the reaction properties of the oxygen carrier particles . In order to prove these results directly, specific surface area measurement techniques were used to characterize the oxygen carrier. The results are shown in Table 3. As can be seen in Table 3, with the increase of cycle number, specific surface area and pore volume were enlarged, but on a small scale and tended to slow down. These data coincide well with the phenomenon in Fig. 3.
| Oxygen carrier |
Specific surface area/m2 g−1 |
Pore volume/cm3 g−1 |
| Fresh OC |
2.157 |
0.0037 |
| 5th |
2.302 |
0.0043 |
| 15th |
2.38 |
0.0045 |
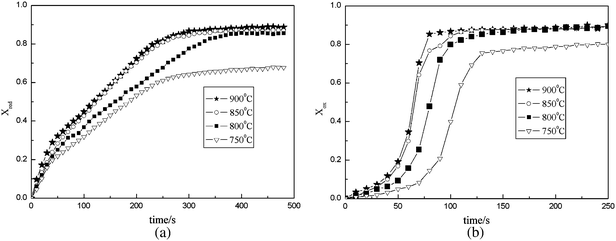
3.1.3 Effect of temperature.
The reaction properties of F45C15M40 at various temperature (T = 750 °C, 800 °C, 850 °C, 900 °C) are shown in Fig. 5. The reaction data indicates that the reaction properties of F45C15M40 were improved both in the reduction and oxidation reaction with the increasing reaction temperature. This is due to the reason that chemical reaction rate increases with the increasing temperature.
3.1.4 Microanalysis.
The scanning electron microscope (SEM) images of fresh F45C15M40 and F45C15M40 sample after 15 oxidation–reduction cycles in TGA at 900 °C are shown in Fig. 6. When the two images were compared, we found small but significant differences between them. The images of the fresh oxygen carrier samples have dense surfaces and the grains are irregular, the local environment has burn marks after the sintering process. After repeated oxidation–reduction cycles, samples had many morphological changes. Surface grains become loose and regular, pore volume increased. The increase in pore volume in the particles was consistent with the result of a slight increase in the oxidation–reduction rates, with the cyclic reactions, because the bigger pore was favourable for diffusion and penetration of COG and oxygen into the oxygen carrier particles. These also confirm the result that the oxygen carrier properties were enhanced after several cycles.
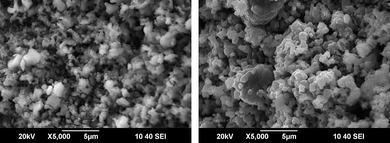 |
| | Fig. 6 SEM images of F45C15M40 oxygen carrier before and after 15 cycles of reaction. | |
3.1.5 Analysis of carbon deposition.
Under certain conditions solid carbon deposition on the oxygen carrier particles may occur if a carbon-containing fuel is used. This could have an adverse effect on the CLC process. The carbon formed can be transported back to the air reactor causing CO2 formation, resulting in lower separation efficiency of CO2.16 In addition, carbon formation may have further blocked the reaction between the oxygen in the inner core of the particles and the gases.17 Jin et al.18 thought that solid carbon may form on the particles under certain conditions through methane decomposition:
Or through the Boudouard reaction:
Fig. 7 shows the TG curves of F45C15M40 oxygen carrier in COG flow and air flow at 900 °C. It is found that weight curve didn't show weight gain during the reduction completing stage or show weight lose during the initial stages of oxidation. The results indicate that there is no carbon deposition formed in the reduction and oxidation process. In addition, the used oxygen carrier was examined by us based on energy spectrum analysis, see Table 4. Table 4 shows that carbon didn't appear in the oxygen carrier, which suggests that the reaction between COG and the oxygen carrier have not formed a carbon deposition. There are two possible reasons: reaction (5) was restricted by H2 in the COG; methanation reaction (7) produced water vapour which can restrict carbon deposition.
| Element |
O |
Mg |
Al |
Fe |
Cu |
| (keV) |
0.525 |
1.253 |
1.486 |
6.398 |
8.040 |
| Mass (%) |
28.43 |
7.45 |
16.21 |
34.56 |
13.35 |
| Error (%) |
0.17 |
0.32 |
0.26 |
0.45 |
0.99 |
 |
| | Fig. 7 TG curves of F45C15M40 oxygen carrier in COG flow (a) and air flow (b) at 900 °C. | |
3.2 Hot laboratory CLC combustion system
A hot laboratory-sized pressurized circulating fluidized bed system was designed, built and operated for chemical looping combustion of COG. The pressurized CLC unit was in continuous operation with fuel for 15 h. In the CLC system, although the conversion to CO2 was always high, combustion of COG was not complete. The combustion tests showed the presence of CO, H2 and CH4 in the exit gas stream from the fuel reactor. The conversion of combustible carbon and hydrogen is presented below as the fraction of total carbon or hydrogen leaving the fuel reactor. In addition, the relating H2:C is 3.026:1 in the COG and combustible carbon accounted for 92.11% of total carbon, we defined some important items as follows:
(1) combustible carbon conversion ωC:
| |  | (8) |
(2) combustible hydrogen conversion ωH2:
| |  | (9) |
(3) conversion of COG ωcoke:
| |  | (10) |
Where fi is the volume fraction of i in dry exit gas from the fuel reactor.
3.2.1 Effect of fuel gas velocity.
Fig. 8 shows the average value of the gas components in combustion products under different gas velocities at 850 °C. As shown in the Figure, an increase in the fuel gas velocity gives an increase in the concentrations of CH4, H2 and CO, and a sharp decrease in the concentration of CO2. This is expected, which can be explained by the following reasons. Firstly, because the amount of oxygen carrier in the fuel reactor and the oxygen supply into the fuel reactor were constant, but the flow of fuel increased. The circulation of the particles, and thereby oxygen supply, is mainly determined by the velocity in the air reactor, which was constant. Secondly, there is less efficient contact and shorter contact time between the oxygen carrier particles and the gas at higher velocities. As a result, the fuel gas did not complete the reaction before the gas flow was discharged from the reactor outlet.
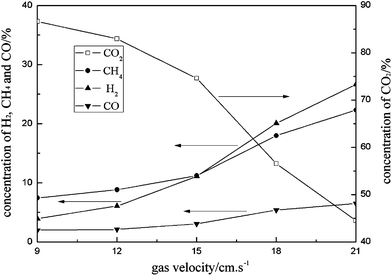 |
| | Fig. 8 Effect of fuel gas velocity on gas composition of fuel reactor. | |
In order to describe the burning degree of fuel gas directly, we rearranged the data on the basis of relevant definition parameter. The effect of fuel gas velocity on conversion of COG is shown in Fig. 9. Clearly, the ωC, ωH2 and ωcoke decreased with increasing fuel gas velocity. The conversion of COG is about 91.43% at 9 cm s−1, but this fell to 62.62% at 21 cm s−1.
 |
| | Fig. 9 Effect of fuel gas velocity on the conversion of COG. | |
3.2.2 Effect of the temperature.
Fig. 10 shows the effect of fuel reactor temperature on the concentration of CH4, H2 and CO at the fuel reactor outlet, gas velocity is 12 cm s−1. An increase in the fuel reactor temperature produces an increase in the concentration of CO2. This effect was due to higher oxygen carrier reactivity as a consequence of the dependence of the kinetic constant with the temperature. Obviously, higher combustion efficiencies were obtained at higher temperatures as a consequence of the higher oxygen carrier reactivity. In addition, the study carried out about reactivity showed the different behavior obtained with the three fuel gases.19 The highest reaction rate for the fuel gas was always obtained with H2. The reaction rate followed the order H2>CO> CH4. Therefore, the concentration of CH4 is higher than H2 and CO.
 |
| | Fig. 10 Effect of fuel reactor temperature on the gas composition. | |
Fig. 11 shows the effect of the temperature on the conversion of COG. In the temperature range 750–900 °C, ωc, ωH2 and ωcoke increase gradually and the conversion of COG increases from 69.8% at 750 °C to 92.33% at 900 °C. COG is not fully converted into CO2 and H2O. Firstly, on any operating condition, unreacted combustible fuel gas is more or less taken by high speed air flow out of the reaction system, which will lead to fuel gas loss. Secondly, for the Cu and Fe based oxygen carriers, the reduction reaction with CH4, CO and H2 is controlled by chemical reaction resistance.19,20
 |
| | Fig. 11 Effect of fuel temperature on the conversion of COG. | |
3.2.3 Oxygen carrier particles.
During the experiment, the oxygen carrier particles have been fluidized by recirculation in hot conditions for approximately 15 h. The used particles were collected and particle size analysis was carried out. Table 5 shows the particle size distribution both before and after the reaction. It is obvious that after a long circulation flow time and continuous reaction, the distribution of oxygen carrier particles went through some changes. The used particles have more small particles compared with the new ones. This can be very detrimental to the process of CLC. Small particles are more difficult to separate by cyclone and more likely to be taken out of the reactor by fluidized air, particularly under the conditions of high fluidization velocities in a full-scale fluidized bed chemical looping combustor.
Table 5 The particle size distribution both before and after the reaction
| Particle size distribution (μm) |
Percentage distribution before the reaction (%) |
Percentage distribution after the reaction (%) |
| 0–70 |
0 |
6.4 |
| 70–100 |
0 |
10.2 |
| 100–150 |
67.3 |
71.8 |
| 150–200 |
33.7 |
11.6 |
Throughout the experiment, the gas composition had no significant changes according to the analysis of the gas from the fuel reactor outlet, which suggests that the particle has high durability and reactivity. Scanning electron microscope (SEM) images of the fresh and used particles are shown in Fig. 12. It can be seen that minor changes occurred on the particle surface. The used particles surface is rougher and particle size has decreased. The results of the specific surface area determination are shown in Table 6. The specific surface area and pore volume of the used particles has increased.
Table 6 Specific surface area determination
| Oxygen carrier |
Specific surface area/m2 g−1 |
Pore volume/cm3 g−1 |
| Fresh |
2.157 |
0.0037 |
| Used |
3.214 |
0.0054 |
 |
| | Fig. 12 SEM images of F45C15M40 oxygen carriers. (a) Fresh, and (b) used. | |
4. Agglomeration
Agglomeration of particles in fluidized beds is a potential risk for difficulties in operation and in the worst cases could cause process failure.21 It is easy to see agglomeration at high temperature in the copper oxide based oxygen carrier . But the F45C15M40 oxygen carrier didn't show any tendency of agglomeration at 900 °C after reduction-oxidation for 1.5 h, which was attributed to the high melting point of Fe2O3 and MgAl2O4. It can be seen that agglomeration does not seem to be a problem for these particles at the temperature used.
5. Conclusions
The properties of COG chemical looping combustion over four different oxygen carriers produced by mechanical mixing with Fe2O3/CuO and MgAl2O4 as the active materials had been investigated using thermogravimetric analysis (TGA) and a laboratory pressurized circulating fluidized bed system. The F45C15M40 oxygen carrier was found to be the best oxygen carrier for CLC of COG. Results of multicycle reduction–oxidation tests in TGA show that the activity of the F45C15M40 oxygen carrier remained high and stable during 15 oxidation–reduction reaction cycles. The reaction temperature and cycle number showed a great effect on the reaction properties of the oxygen carrier and this was attributed to the high chemical reaction rate of oxygen carrier and morphological change in CuO at high temperatures. The pressurized CLC unit was in continuous operation with fuel for 15 h. The pressurized circulating fluidized bed system for CLC was found to work well with F45C15M40 oxygen carriers. It showed high reactivity in a fluidized bed reactor and provided a high conversion of the fuel, as well as reasonable crushing strength and resistance toward agglomeration and fragmentation. The maximum fuel conversion it can reach is 92.33%. It must be noted that the fluidization velocities and experimental time are not comparable with that expected in a full-scale fluidized bed chemical looping combustion.
Acknowledgements
This work was supported by National Science and Technology Supporting Program of China (2006BAKA02B03) and the Program for New Century Excellent Talents in University of Chinese Education Ministry (NCET -07-0678).
References
-
W. Z. Shi, L. S. An, H. P. Chen, X. L. Zhang, 23rd Annual International Pittsburgh Coal Conference. Pittsburgh, PA, United states, 2006 Search PubMed.
- T. Mattisson, A. Lyngfelt and P. Cho, Fuel, 2001, 80, 1953–1962 CrossRef CAS.
- J. Adánez, L. F. de Diego, F. Garcia-Labiano, P. Gayán and A. Abad, Energy Fuels, 2004, 18, 371–377 CrossRef CAS.
- P. Cho, T. Mattisson and A. Lyngfelt, Fuel, 2004, 83, 1215–1225 CrossRef CAS.
- A. Abad, T. Mattisson, A. Lyngfelt and M. Rydén, Fuel, 2006, 85, 1174–1185 CrossRef CAS.
- P. Cho, T. Mattisson and A. Lyngfelt, Ind. Eng. Chem. Res., 2006, 45, 968–977 CrossRef CAS.
- Q. Zafar, T. Mattisson and B. Gevert, Energy Fuels, 2006, 20, 34–44 CrossRef CAS.
- H. G. Jin and M. Ishida, Fuel, 2004, 83, 2411–2417 CrossRef CAS.
- T. Mattisson, A. Järdnäs and A. Lyngfelt, Energy Fuels, 2003, 17, 643–651 CrossRef CAS.
-
A. Abad, J. Adánez, F. García-Labiano, L. F. de Diego, P. Gayán and J. Celaya, Chemical Engineering Science, DOI:10.1016/j.ces.2006.09.019.
- T. Mattisson, M. Johansson and A. Lyngfelt, Energy Fuels, 2004, 18, 628–637 CrossRef CAS.
- S. Y. Chuang, J. S. Dennis, A. N. Hayhurst and S. A. Scott, Combust. Flame, 2008, 154, 109–121 CrossRef CAS.
- J. Adánez, P. Gayán and J. Celaya, Ind. Eng. Chem. Res., 2006, 45, 6075–6080 CrossRef CAS.
- V. K. Singh and R. K. Sinha, Mater. Lett., 1997, 31, 281–285 CrossRef CAS.
- M. Johansson, T. Mattisson and A. Lyngfelt, Ind. Eng. Chem. Res., 2004, 43, 6978–6987 CrossRef CAS.
- P. Cho, T. Mattisson and A. Lyngfelt, Ind. Eng. Chem. Res., 2005, 44, 668–676 CrossRef CAS.
- M. K. Chandel, A. Hoteit and A. Delebarre, Fuel, 2009, 88, 898–908 CrossRef CAS.
- H. G. Jin and M. Ishida, Ind. Eng. Chem. Res., 2002, 41, 4004–4007 CrossRef CAS.
- F. Garcia-Labiano, L. F. de Diego, J. Adánez, A. Abad and P. Gayán, Ind. Eng. Chem. Res., 2004, 43, 8168–8177 CrossRef CAS.
- A. Abad, F. García-Labiano, L. F. de Diego, P. Gayan and J. Adánez, Energy Fuels, 2007, 21(4), 1843–1853 CrossRef CAS.
- N. Berguerand and A. Lyngfelt, Fuel, 2008, 87, 2713–2726 CrossRef CAS.
|
| This journal is © The Royal Society of Chemistry 2010 |
Click here to see how this site uses Cookies. View our privacy policy here.