Near-term mega-scale CO2 capture and storage demonstration opportunities in China
Zhong
Zheng
ab,
Eric D.
Larson
bc,
Zheng
Li
*a,
Guangjian
Liu
bd and
Robert H.
Williams
b
aState Key Lab of Power Systems, Thermal Eng. Dept, Tsinghua University, Beijing, China. E-mail: lz-dte@tsinghua.edu.cn; Fax: +86-10-62795736; Tel: +86-10-62795735
bPrinceton Environmental Institute, Princeton University, Guyot Hall, Princeton, NJ, USA
cClimate Central, Inc., Princeton, NJ, USA
dSchool of Energy & Power Engineering, North China Electric Power University, Beijing, China
First published on 11th August 2010
Abstract
China is unique in the large number (nearly 400) of existing and planned projects for making ammonia, methanol, and other fuels and chemicals from coal. A natural by-product of these processes is a nearly pure CO2 stream. Collectively, these facilities will emit (once all are operating) some 270 million tonnes of CO2 per year. Taking advantage of the relatively low cost of capturing these CO2 streams (as compared with capturing CO2 from power plant flue gases), some of the 20 large-scale CO2 capture and storage (CCS) demonstration projects called for by the leaders from the G8 to be deployed during the next decade might be expeditiously located in China. Our analysis identifies 18 coal-chemicals/fuels facilities, each emitting one million tonnes/year or more of CO2, that are within 10 km of prospective deep saline aquifer CO2 storage sites and an additional 8 facilities within 100 km. The potential CO2 storage basins are identified based on work by others. We adapted two published cost models for CO2 compression and transport to develop preliminary estimates of prospective costs for potential CCS projects in China. Our “Nth plant” cost estimates for the 18 projects where the CO2 source is within 10 km of a sink, are between $9 and $13/tonne of CO2. (The highest cost estimate among all evaluated projects was less than $21/tonne of CO2.) The 10-year net-present value cost for projects ranged from $89 million to $1.15 billion, with more than 75% of the projects having net present value costs of $200 million or less. These relatively modest CCS costs suggest that there would be mutual value in international cooperation to support CCS demonstrations in China.
Broader contextAlthough theoretical studies and pilot projects have shown the promise of CO2 capture and storage (CCS), commercial-scale demonstration projects are needed to address technical issues of scale and to provide an empirical basis for judgments on CCS viability as a major carbon mitigation option. G8 leaders have called for 20 large-scale CCS demonstrations during this decade. We analyze opportunities for near-term projects that would exploit a unique demonstration opportunity in China: hundreds of existing or planned facilities that make chemicals or fuels from coal, each naturally producing a nearly pure CO2 stream. We identify 18 facilities, each emitting at least one million tonnes/yr of CO2, that are within 10 km of prospective deep saline aquifer CO2 storage sites and an additional 8 facilities within 100 km—although local geological investigations are needed to ascertain the suitability of these prospective sites for secure storage. For these CO2 source–sink pairs, we estimate that the costs to capture and store the CO2 would be far less than costs for CO2 captured from power-plant flue gases. With such low costs, several large-scale demonstration projects might be expeditiously located in China, and there would be mutual value in international cooperation to support these projects. |
1. Introduction
Scientists of the Intergovernmental Panel on Climate Change (IPCC) have reached favorable judgments about the prospects for CO2 capture and storage (CCS) as a major carbon mitigation option (Box 1). It is now widely recognized that the most significant obstacle to the routine pursuit of CCS is successful demonstration of CO2 storage at the ‘mega-scale’ in geological formations—with emphasis on deep saline formations, which account for most of the geological storage opportunities. (To characterize the size of needed demonstrations, the term “mega-scale” is often used—a word that refers to the geological storage of at least one million tonnes of CO2 per year per project.) Such projects are needed not only to address scientific questions that can only be answered in projects that inject and store CO2 at rates comparable to those for commercial projects but also to demonstrate to the satisfaction of a wide range of stakeholder groups that CCS is a viable major option to be included in the portfolio of carbon mitigation options. Such projects are also needed to provide the experience base needed for formulating practicable regulations governing CO2 storage. Having CCS as a major carbon mitigation option is especially important to coal-intensive energy economies such as those of China and the United States.
Box 1: the IPCC and carbon dioxide storageThe IPCC Special Report on Carbon Capture and Storage1 includes a detailed review of the state of scientific understanding (as of the first half of this decade) relating to the prospects for carbon dioxide capture and storage. Some of the key statements in the report include:…Models…indicate that CCS systems will be competitive with other large-scale mitigation options such as nuclear power and renewable energy technologies… …Available evidence suggests that, worldwide, it is likely that there is a technical potential of at least about 2000 Gt CO2storage capacity in geological formations… (For perspective, global CO2 emissions in 2005 from fossil fuel burning were 27 Gt CO2). …With appropriate site selection informed by available subsurface information, a monitoring program to detect problems, a regulatory system, and the appropriate use of remediation methods to stop or control CO2releases if they arise, the local health, safety and environment risks of geological storage would be comparable to risks of current activities such as natural gas storage, enhanced oil recovery, and deep underground disposal of acid gas… …Based on observations and analysis of current CO 2 storage sites, natural systems, engineering systems, and models, the fraction [of injected CO2] retained in appropriately selected and managed reservoirs is very likely to exceed 99% over 100 years and is likely to exceed 99% over 1000 years… …The inclusion of CCS in a mitigation portfolio is found to reduce the costs of stabilizing CO 2 concentrations by 30% or more… …Based on the TAR (the Third Assessment Report of the IPCC) mitigation scenarios, the average share of CCS in total emissions reduction may range from 15% for scenarios aiming at stabilization of CO2concentrations at 750 ppmv to 54% for 450 ppmv scenarios… |
An international political framework for early CCS action has already been established. At the July 2008 G8 Summit in Japan an agreement was reached by the G8 countries that twenty large-scale fully integrated CCS demonstration projects worldwide would be committed by 2010 and deployed by the middle of the next decade, with the aim of establishing the basis for broad commercial deployment of CCS technologies after 2020. The US agreed to host at least 10 of these projects. In July 2009, the leaders of the G8 countries re-iterated their July 2008 call.2
Much if not all of the incremental cost of CCS for the 20 projects called for by the G8 will probably have to be paid for by governments (individually or collectively) because of the likelihood that in many if not most parts of the world carbon prices will be lower initially than what will be needed to make pursuit of CCS a profitable activity for private companies.
If governments will have to pay for the incremental CCS cost they will want to pursue projects in which they can maximize the learning about the giga-scale prospects of CCS per dollar (or per Yuan) spent. An important consideration is that systems making chemicals or synfuels from coal, generate, as a natural part of the process of their manufacture, relatively pure streams of CO2† for which the incremental cost of CO2 capture is very low—a fact that can be exploited to facilitate lower-cost early CCS action, as discussed below.
China is unique in the large number of existing and planned projects for making NH3 and other chemicals from coal. This uniqueness stems from the fact that China has limited domestic oil and natural gas resources and so has evolved a chemical industry that is based mainly on coal as a feedstock. Taking advantage of CO2 streams generated in this industry, some of the 20 integrated CCS projects called for by the G8 to be deployed during the next decade might be expeditiously located in China.
Meng, et al.3 conducted an early evaluation of the possibility of utilizing CO2 streams from NH3 plants in China for CO2 storage demonstration projects. They identified nine specific plants located within 150 km of potential CO2 storage sites (deep saline aquifers, operating oil fields for enhanced oil recovery, and unmineable coal seams). Here we build on the work of Meng et al. by identifying a considerably larger number of existing and planned facilities that vent pure CO2 streams in the process of making ammonia, methanol, or synfuels via both direct and indirect liquefaction [Fischer–Tropsch liquids (FTL)] processes. Existing facilities offer the potential for near-term capture projects, while facilities still in the planning stages offer opportunities for more-optimized capture/storage projects. Our analysis also reviews research on prospective CO2 storage opportunities carried out since the Meng et al. paper was published. The larger number of CO2 sources, together with the newer research on potential CO2 storage sites enables us to put forth a more comprehensive analysis of the possibilities for matching CO2 sources and sinks that might provide the basis for mega-scale demonstration projects in China. We additionally provide preliminary estimates of prospective costs for such projects.
2. Low-cost CO2 sources in China
When CO2 is captured post fossil fuel combustion from flue gases (in which its concentration is 3–15%1), the capture cost is made up of costs for: (i) extraction of CO2 from the flue gases using an appropriate chemical solvent, (ii) the recovery of the CO2 as a pure stream from the solvent and regeneration of the solvent for reuse, and (iii) compression of the CO2 to the pressure needed for transport by pipeline to the CO2 storage site. Of these CO2 capture cost elements, the only one required for capture at coal-to-chemicals or coal-to-synfuels plants is the relatively modest cost of CO2 compression, because removing CO2 as a nearly pure stream is part of the coal-to-chemicals or synfuels production process and is thus paid for as an inherent part of that process.4Fig. 1 is a generic representation of a coal-to-chemicals or synfuels process. Gasification of coal using oxygen from an air separation unit (ASU) produces a synthesis gas consisting primarily of CO and H2. After cooling and cleaning, the gas composition is adjusted in a water gas shift reactor to achieve the desired CO-to-H2 ratio for efficient further processing. Consider an ammonia plant.‡ In this case the shift reaction proceeds to the extent of producing essentially only H2 and CO2. The CO2 would be separated from the H2 using one of several available commercial acid gas removal technologies. The H2 would then be combined with nitrogen also derived from air via the ASU to make ammonia. At a typical fertilizer factory, about 40% of the CO2 would be reacted with the ammonia to make urea. The remaining CO2 is vented to the atmosphere. Alternatively, the CO2 now vented could be compressed for pipeline transport and underground injection, as depicted in Fig. 1. The pressure at which the CO2 is available to a compressor varies depending on the acid gas removal technology adopted.§ Compression costs are lower at higher recovery pressures.
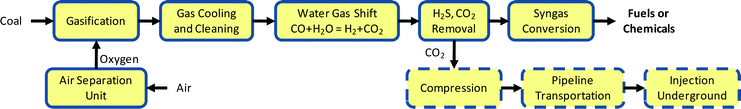 | ||
| Fig. 1 Schematic of coal to chemicals or synfuels plants. | ||
To estimate the emissions of pure streams of CO2 from selected coal conversion facilities in China, we apply emission factors (EFs) drawn from various sources. For coal-to-ammonia plants we assume an EF of 3.27 tonnes CO2/tonne NH3.¶ For coal-to-methanol plants, we assume 1.55 tonnes CO2/tonne MeOH.9 For coal-to-synfuels, we assume for Fischer–Tropsch liquids 4.74 tonnes CO2/tonne FTL4 and for direct coal liquefaction 2.88 tonnes CO2/tonne liquids produced.||
These emission factors were applied to the estimated production levels of almost 400 facilities that we identified from literature sources,5,7,10 annual industry reports,11 government and corporate websites,12–19 and personal communications. The facilities include 310 coal gasification-based ammonia plants, 84 coal-to-methanol plants, 3 coal to FTL plants, and 1 direct-coal-liquefaction plant.** Cumulatively the estimated emissions from all of these plants is some 270 million tonnes of CO2 per year. Table 1 shows the distribution of plant sizes: 12 NH3 plants and 45 planned or under-construction coal to methanol or coal to liquids plants are of mega-scale in terms of annual CO2 emissions. We have mapped all sources assuming (to simplify identification of where the plant is approximately located) that each is at the center of the city near where it is actually located (Fig. 2).
| Type of facilities | Net CO2 streams per facility (million tonnes CO2 /year) | Number of facilities | Total net CO2 streams (million tonnes CO2 /year) |
|---|---|---|---|
| a At NH3 plants, some captured CO2 is used for urea production. The CO2 stream estimates here are net of CO2 use for urea production. CO2 consumption for urea production is calculated assuming a consumption factor of 0.73 kilotonnnes CO2/kilotonne urea.3 Urea production data are available for NH3 plants for which annual CO2 emissions are greater than 1.0 Megatonnes. For other NH3 plants, urea production is estimated using stoichiometric relationships, based on the assumption that all NH3 would be used to synthesize urea at a rate of 1.76 tonnes urea/tonne NH3.3 Additionally, some of these plants co-produce methanol. CO2 streams associated with methanol production are considered in the totals. b For coal-to-methanol and coal-to-FTL plants, the calculations are based on estimated production once all phases of the plant are operating. (Plants are often built in phases, with the first phase tending to involve a much smaller output than after all phases are complete.) c The National Development and Reform Commission has approved only two large-scale coal-to-liquids projects: the Shenhua direct-coal-liquefaction project in Inner Mongolia (approved for operation) and the Shenhua Ningdong Fischer–Tropsch project in Ningxia Province (approved for feasibility study).20 | |||
| Ammoniaa | <0.5 | 276 | 45.0 |
| 0.5–1.0 | 22 | 15.4 | |
| >1.0 | 12 | 14.7 | |
| subtotal | 310 | 75.1 | |
| Coal-to-methanolb | <0.5 | 22 | 7.2 |
| 0.5–1.0 | 19 | 15.9 | |
| >1.0 | 43 | 149 | |
| subtotal | 84 | 172.1 | |
| Coal to liquidsbc | <0.5 | 0 | 0 |
| 0.5–1.0 | 2 | 1.5 | |
| >1.0 | 2 | 21.8 | |
| subtotal | 4 | 23.3 | |
| Totals | 398 | 270.5 | |
 | ||
| Fig. 2 Locations of nearly 400 existing and potential pure CO2 streams in China. | ||
3. CO2 sinks in China
Some recent research has focused on estimating potential CO2 storage capacity in China, including in oil fields, gas fields, deep saline formations and unmineable coal seams, as summarized in Table 2. There are significant variations among different estimates, reflecting the preliminary nature of the estimates due to lack of detailed geological data.| Source of Estimate | Estimated capacity in saline formations (Gt CO2) | Estimated capacity in oil fields (Gt CO2) | Estimated capacity in gas fields (Gt CO2) | Estimated capacity in unmineable coalbeds (Gt CO2) |
|---|---|---|---|---|
| X. Li, et al. (2008)21 | 3160 (total) | 4.8 (total) | 5.18 (total) | 12.0 (total) |
| 2380 (onshore) | 4.6 (onshore) | 4.28 (onshore) | 12.0 (onshore) | |
| X. Li, et al. (2006)22 | 143.5 (total) | |||
| 77.38 (onshore) | ||||
| Y. Liu, et al. (2006)23 | 30.48 (total) | |||
| 23.80 (onshore) | ||||
| Y. Liu, et al. (2005)24 | 12.78 (total) | |||
| H. Yu. (2005)25 | 141.7 (total) |
The most recently published estimates cited in our study are by Li, et al.21 They estimate a total capacity of 4.8 gigatonnes (Gt) of CO2 storage potential for oil fields, 5.2 Gt of CO2 for gas fields, and about 12 Gt of CO2 for unmineable coal seams. These are all relatively small capacities considering that China's total CO2 emissions from fossil fuel use today is about 6 Gt/year. But Li et al.21 have also estimated that the capacity in deep saline aquifers may be over 3 teratonnes (Tt) of CO2, of which about 75% (2.3 Tt of CO2) is in onshore formations and 25% (0.78 Tt of CO2) is in offshore formations below the sea bed. Fig. 3 shows the distribution of these potential CO2 storage reservoirs in China.

Estimates of saline aquifer storage capacity made by Li et al.21 are a factor of twenty larger than estimates published in a paper with the same lead author two years earlier.22 These two papers use the same estimation methodology. The wide gap between the two estimates can be largely explained by the difference in the value of one key parameter in the analyses. For the earlier paper the authors assumed that the ratio of the area of deep saline formations to the total area of all sedimentary formations is 0.01.22 For the later paper, it seems that it is assumed that this ratio is 1.
In both cases, the approach was to estimate the volume of brine contained in each sedimentary basin in China and how much CO2 could physically be dissolved in this brine (Box 2). In actuality, the amount of CO2 that will dissolve in a brine is relatively small (less than 0.020 tonnes of CO2 per tonne of brine under a range of brine salt concentrations26), which would suggest that Li et al.'s estimates are conservative, since some injected CO2 could be trapped by mechanisms other than dissolution.1 In fact, other mechanisms, notably storage of CO2 in a separate phase as a dense supercritical fluid, will come into play because CO2 would typically be injected into a formation faster than it can be dissolved in the brine. For CO2 storage in a separate supercritical phase, cap rock seals are needed to prevent escape. Because of the lack of empirical data, Li's analyses21,22 did not consider the presence or absence of seals. Li and colleagues continue to be engaged in work to refine their capacity estimates to better account for such factors.†† Ultimately detailed reservoir assessments are needed to determine more accurately the storage capacity of saline formations in China.
Box 2: methodology applied to CO2 storage capacity estimationThis box shows how Li et al. estimated the CO2 storage capacity of deep saline formation (DSFs) in China in two different papers.In the earlier paper,22 Li et al. estimated the storage capacity of a given reservoir (grams CO2) as: S CO2 = A· AR · h · TR · p · molS · r · M Where, A = horizontal area of the full sedimentary formation (m2); AR = area ratio (area of DSF to area of full formation); h = average thickness of full formation (m); TR = thickness ratio (thickness of layer in which CO2 will be stored to thickness of total formation); p = average porosity of sediment in DSF; molS = molar solubility of CO2 in DSFs (mol kg−1); r = density of CO2-saturated brine at the depth of the DSFs (kg m−3); M = molar mass of CO2 (44 g mol−1). In the later paper21 the authors estimate storage capacity of a given reservoir (grams CO2) as: S CO2 = A · h · p · massS Where, A = horizontal area of the formation in which CO2 is to be stored (m2); h = average thickness of sediment layer in which CO2 would be stored (m); p = average porosity of sediment layer; massS = solubility of CO2 in brine (g m−3) at depth. |
4. CO2 source-sink matching to identify early CCS project opportunities in China
Here we combine the forgoing analysis of CO2 sources and potential sinks to make a preliminary identification of candidate projects in China for early CCS demonstrations. We limit our consideration of sources only to facilities which have CO2 emissions of at least one million tonnes per year. This results in a total of 27 candidate CO2-emitting facilities (Appendix A) distributed among five regions of China: Huabei, Ordos, Dongbei, Yuwan, and Xinjiang.| Region | Estimated CO2 storage capacity (109 tonnes)a | Total no. mega-scale CO2 sources in region | Number of mega-scale CO2 sources | ||||||||
|---|---|---|---|---|---|---|---|---|---|---|---|
| Distance/km to onshore saline aquifers | Distance/km to onshore oil fields | ||||||||||
| Aquifers | Oil fields | <50 | 50–100 | 100–150 | >150 | <50 | 50–100 | 100–150 | >150 | ||
| a Capacity estimates are from Li et al.21 b Of this total, 233 Gt are estimated to be in the Bohai Basin and 29 Gt in the Qinshui Basin. c Saline formation storage estimates: 228 Gt in Songliao Basin, 85 Gt in Erlian Basin, and 45 Gt in Sanjiang Basin. d Estimate of 178 Gt in South Huabei (Hehuai) Basin and 7.5 Gt in Nanxiang Basin. e Saline formation storage estimates: 746 Gt in Tarim Basin, 197 Gt in Zhunggar Basin, and 54 Gt in Tu-Ha Basin. Oil field storage estimates: 0.069 Gt in Tarim fields, 0.20 Gt in Zhunggar fields, and 0.12 Gt in Tu-Ha fields. | |||||||||||
| Huabei | 262b | 1.9 | 9 | 6 | 2 | 1 | 0 | 1 | 2 | 2 | 4 |
| Ordos | 257 | 0.36 | 9 | 9 | 0 | 0 | 0 | 1 | 0 | 1 | 7 |
| Dongbei | 358c | 1.6 | 5 | 4 | 1 | 0 | 0 | 0 | 0 | 0 | 5 |
| Yuwan | 186d | 0.065 | 2 | 2 | 0 | 0 | 0 | 0 | 0 | 0 | 2 |
| Xinjiang | 997e | 0.39 | 2 | 2 | 0 | 0 | 0 | 0 | 0 | 0 | 2 |
| TOTALS | 2,060 | 4.3 | 27 | 23 | 3 | 1 | 0 | 2 | 2 | 3 | 20 |
For the purpose of estimating the distance between CO2 sources and potential sinks (and thereby the cost of transporting the CO2), we superimpose the locations of these 27 facilities onto maps of sedimentary basins in each of the five regions. The maps of sedimentary basins are from Li and Lv.27 Consistent with Li et al.'s estimates of saline aquifer storage capacities, we assume that suitable sedimentary layers for CO2 storage exist in each sedimentary basin. Of course this assumptions must be verified via detailed basin assessments. We also estimate distances from CO2 sources to oil fields, considering the possibility for CO2 injection/storage via enhanced oil recovery (EOR).
In each of the five regional maps that we show below (Fig. 4–8), we show concentric zones around each of the 27 CO2 sources at radii of 50, 100 and 150 km, on the basis of which we can estimate the straight-line distance between each CO2 source and the nearest potential aquifer sink or oil field sink.
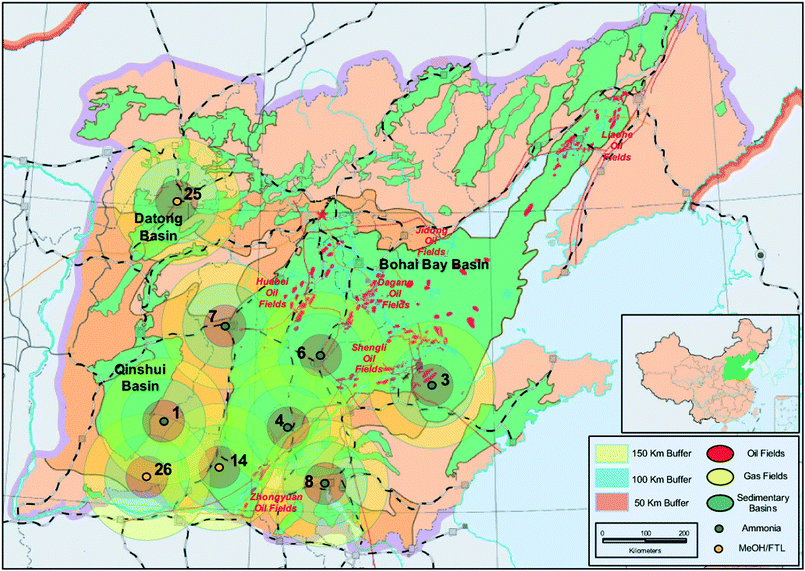 | ||
| Fig. 4 Mega-CO2 sources and potential sinks in the Huabei Region. Numbers refer to specific CO2 stream sources (see Appendix A). | ||
 | ||
| Fig. 5 Mega-CO2 sources and potential sinks in the Ordos Region. Numbers refer to specific CO2 stream sources (see Appendix A). | ||
 | ||
| Fig. 6 Mega-CO2 sources and potential sinks in the Dongbei Region. Numbers refer to specific CO2 stream sources (see Appendix A). | ||
 | ||
| Fig. 7 Mega-CO2 sources and potential sinks in the Yuwan Region. Numbers refer to specific CO2 stream sources (see Appendix A). | ||
 | ||
| Fig. 8 Mega-CO2 sources and potential sinks in the Xinjiang Region. Numbers refer to specific CO2 stream sources (see Appendix A). | ||
Table 3 summarizes the source-sink matching results gleaned from Fig. 4–8. (See Appendix B for details.) The majority of the candidate CO2 sources are found in the Ordos, Huabei and Dongbei regions. Considering all five regions, most of the CO2 sources (23 out of 27) are located within 50 km of a deep saline formation potentially suitable for storing CO2. Most of the CO2 sources (20 out of 27) are located more than 150 km from an oil field, although there are two facilities within 50 km and a total of seven within 150 km of oil fields.
5. Cost estimates for CCS projects in China
5.1. Cost models
The cost of CO2 capture and storage will constitute a large percentage of the total cost of any CCS demonstration project. Using CO2 from coal-to-chemicals or coal-to-fuels facilities can help minimize costs for such demonstration projects.As discussed in Section 2, a coal-to-chemicals or coal-to-fuels facility generates an essentially pure stream of by-product CO2 as an inherent part of the process of manufacturing the chemicals or the fuels, so that the added cost for capturing and storing CO2 from one of these plants is much less than these costs for CO2 from a coal-fired power plant.4 The capture cost for one of these plants is essentially the (relatively modest) cost of compressing CO2 to the pressure required for pipeline transport to the CO2 storage site.
Here we estimate costs for CO2 capture, transport, and storage for each of the 27 source-sink pairs identified previously in this paper as candidates for early demonstration projects. Our estimates assume “Nth plant” CCS systems. That is, we do not consider any cost or risk premiums that might be involved in deploying and operating CCS systems before a CCS industry has been commercially established. Our estimates can thus be considered to represent the commercial costs for CCS. We assume that the already-concentrated stream of CO2 at a given facility is first compressed to 150 bar, then sent via a pipeline sized to the CO2 flow rate of the facility to the nearest storage site where it is injected underground via one or more injection wells.
For capital and total levelized cost estimates, we adapt two alternative cost models from the literature to provide a range of illustrative costs for CO2 transport and storage. In conjunction with the use of each model (referred to here as Model A, based on McCollum and Ogden,28 and Model B, based on McCoy29), compressor costs are estimated as in Kreutz et al.4 These models were developed for US applications. To account for lower construction and operating costs in China versus the US , we apply a local-factor multiplier of 0.8 to US-based capital costs and 0.6 to US-based operating and maintenance (O&M) costs.‡‡ The capital cost multiplier is at the high end of the multiplier range (0.31 to 0.84) identified by Huang et al.30,31 for components of coal gasification-based power generation systems. The transport and injection models, as they originally appeared in the literature, are described in Box 3.§§ For Model A and Model B, we escalated capital cost estimates to 2007 US$ using the Chemical Engineering Plant Cost Index.32 For all cases we assume a plant capacity factor of 90% and an annual capital charge rate of 15% (corresponding to a discount rate of 8.5%/year and a 10-year amortization period).
Box 3: The US economic models for CCS cost estimation
| ||||||||||||||||||||||||||||||||||||||||||||||||||||||||||||||||||||||||||||||||||||||||||||||||||||||


In both of our models, the value of several parameters can have important influences on the estimated costs of CO2 stored. These parameters include:
• the pressure at which the concentrated CO2 is available for capture at the source facility,
• the price paid for electricity to run the CO2 compressor at the source facility,
• the flow rate of the captured CO2,
• the length of the CO2 pipeline between the source and where it is injected underground,
• the injectivity (the maximum rate at which CO2 can be injected into a single well),
• the depth of the sedimentary layer in which CO2 is to be stored.
The influence of these parameters on CO2 compression, transport, and storage costs (in all cases including capital expenditures, operation and maintenance, and purchased electricity costs) are illustrated in Fig. 9, 10, and 11, respectively.
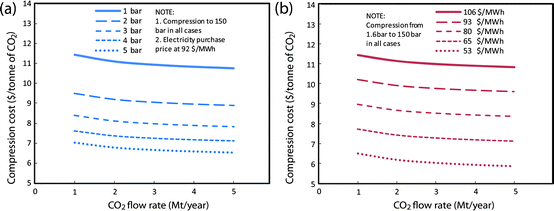 | ||
| Fig. 9 Estimated cost for CO2 compression in China using cost model described in Box 3, with adjustments for Chinese location (as discussed in text). (a) Shows the cost for different starting CO2 pressures, (b) shows the cost for different electricity prices. | ||
 | ||
| Fig. 10 Estimated cost for pipeline transport of pressurized CO2 in China as a function of CO2 flow and transport distance using the two cost models described in Box 3, with adjustments to location in China discussed in text. | ||
 | ||
| Fig. 11 Estimated cost for CO2 injection and storage in saline formations in China using the cost model described in Box 3, with adjustments to location in China discussed in the text. (a) Shows cost as a function of injectivity at two levels of annual CO2 storage, (b) shows cost as a function of well depth for two different levels of annual CO2 storage. | ||
In the scale range of interest for mega-CCS projects (> 1 million tonnes/year CO2 flow), scale has only a minor impact on compression cost, but the pressure from which the CO2 is compressed (which varies with the specific system design for CO2 capture) has a much larger impact (Fig. 9a). For reference, a typical coal-NH3 production facility using Rectisol® CO2 capture technology in China will have CO2 available at an average pressure of about 1.6 bar.¶¶ Likewise, the electricity purchase price has a significant impact on compression cost (Fig. 9b). For reference, the average electricity price to common industrial consumers in China was $92/MWh (US$) in 2008.
Both the annual CO2 storage rate and the distance transported from source to underground injection point affect the unit CO2 cost of pipeline transport (Fig. 10). CO2 transport costs estimated using Model B are significantly lower than those estimated using Model A, ranging from about $1.5/tonne CO2 in Model B to $2.5/tonne CO2 in Model A at a scale of one million tonnes per CO2/year for a 50 km pipeline length. For both models, unit CO2 cost declines with the CO2 flow rate, but the influence of scale diminishes with increasing flow rate.
For a fixed total flow rate of CO2 into a saline formation, the cost of injection and storage is a function of the injectivity (maximum injection rate per well), the well depth, and the annual rate of storage for the system (Fig. 11). Model B predicts higher costs than Model A and shows a higher sensitivity to the annual rate of CO2 injection. Injection and storage costs increase as well injectivity decreases, and they rise especially sharply at injectivities less than about 1000 tonnes of CO2/well/day (Fig. 11a). Costs also increase with increasing well depth (Fig. 11b).
5.2. Cost estimates for early CCS projects in China
On the basis of the above analysis of component-level costs for CCS, we now estimate upper and lower bound total costs for generic CCS projects, as well as for projects involving each of the 27 potential source-sink pairs identified earlier.For estimating upper and lower bounds, we define three sets of parameter values: low-cost, base-cost, and high-cost (Table 4). The lower-cost projects are characterized by higher annual storage rates (which provides capital cost scale economies in compressor and pipeline costs), shallower injection depths (which reduce well drilling costs), higher injectivities (which reduce the number of wells needed for injecting a given annual amount of CO2), and higher starting pressures for CO2 compression (which reduce electricity purchase requirements).
| Low | Base | High | ||
|---|---|---|---|---|
a Among the 27 CO2 sources identified earlier, the largest stream is estimated to be 19.0 megatonnes (Mt) of CO2/year (in Inner Mongolia, Ordos region) and the smallest 1.02 Mt of CO2/year (in Shandong Province, Huabei region).
b A minimum depth of 800 meters is required to ensure that the injected CO2 stays in a dense (supercritical) phase. The estimates of Li et al.22 of storage capacity in saline aquifers assumed reservoir depths from 1 to 3 km.
c This range of assumed injectivities, based on discussions in June 2009 with Charles Christopher, is likely to be widely regarded by experts as realistic. Some comparisons: Meng et al.3 assumed injectivities ranging from 1100 to 150![[hair space]](https://www.rsc.org/images/entities/char_200a.gif) 000 tonnes of CO2/well/day for storage in saline aquifers. The estimated injection rate for the planned Gorgon CCS project in Australia is 10000 tonnes CO2/well/day.1 The saline aquifer injection rate for the Sleipner CCS project is approximately 3000 tonnes of CO2/well/day.1
d The average retail price to industrial customers in the US in 2008 was $70/MWh.33
e The average electricity price paid by normal industries in China in 2007 was 693 RMB/MWh,34 which we have converted to US$ using the average 2007 exchange rate of 7.52 RMB/US$. 000 tonnes of CO2/well/day for storage in saline aquifers. The estimated injection rate for the planned Gorgon CCS project in Australia is 10000 tonnes CO2/well/day.1 The saline aquifer injection rate for the Sleipner CCS project is approximately 3000 tonnes of CO2/well/day.1
d The average retail price to industrial customers in the US in 2008 was $70/MWh.33
e The average electricity price paid by normal industries in China in 2007 was 693 RMB/MWh,34 which we have converted to US$ using the average 2007 exchange rate of 7.52 RMB/US$.
|
||||
| Annual CO2 Storeda | 106 tonnes CO2/year | 5.0 | 1.0 | 1.0 |
| Injection well depth b | Meters | 1000 | 2000 | 3000 |
| Injectivityc | Tonnes CO2/well/day | 6000 | 3000 | 500 |
| CO2 intial pressure | Bar | 1.8 | 1.6 | 1.0 |
| US electricity priced | $/MWh | 70 | 70 | 70 |
| China electricity pricee | $/MWh | 92 | 92 | 92 |
Fig. 12 shows the total costs for CCS estimated for the low-cost, base-cost, and high-cost set of parameter values for both Model A and Model B, as a function of the distance between CO2 source and sink. For the base-cost set of parameter values, Model A and Model B give results that are relatively close to each other but diverge as the source–sink distance grows. At a 50 km distance, both models indicate a total CCS cost of about $12/tCO2; but at 200 km, the CO2 cost per tonne ranges from $17 for Model A to $22 for Model B. The estimates for the low-cost and high-cost cases are about $6/tCO2 and $14/tCO2 at 50 km, and about $8/tCO2 and $33/tCO2 at 200 km, respectively.
 | ||
| Fig. 12 Cost comparison for China based on the two models. | ||
It is also of interest to compare specific CCS cost estimates (in $ per tonne of CO2) for US pricing vs. Chinese pricing. Fig. 13 shows that specific costs differ very little between the US and China. The slight differences reflect the relative costs of capital and O&M on the one hand (which are lower in China) and electricity prices for common industrial users on the other hand (which are lower in the US). In the low-cost and base-cost cases, CO2 compression dominates the total cost, and electricity purchases account for more than 80% of the total compression cost. As a result, the lower capital and O&M costs in China relative to the US are largely offset by the higher prices paid for electricity in China. But for the high-cost case, transport and storage costs dominate, so that total specific costs are slightly higher in the US than in China. Thus on a specific cost basis, there is very little difference in the overall economics between projects sited in the US and projects sited in China.
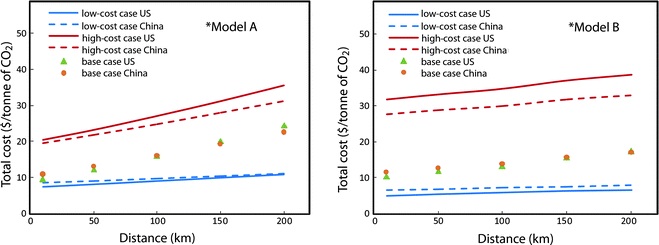 | ||
| Fig. 13 Costs for Chinese and US pricing: Model A (left) and Model B (right). | ||
The key difference between the US and the Chinese situations is that there are more project opportunities in China compared to the US—i.e., there are very few existing and planned projects in the US that are characterized by low CO2 capture costs.
Fig. 14 presents cost estimates for the 27 candidate source–sink projects using base-cost assumptions. For this preliminary analysis, the pipeline distance for each potential project was assigned to one of four distance ranges (10 km, 50 km, 100 km, 150 km) based on the source–sink maps shown earlier; in-depth project-specific studies would be required for any potential demonstration project to develop more accurate cost estimates. Project-specific issues such as location of railways, highways, rivers, cities, mountains, and suitable injection sites could result in total costs that differ from the cost estimates presented here.
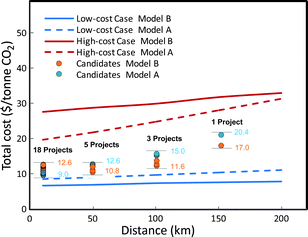 | ||
| Fig. 14 Preliminary cost estimates for potential early saline aquifer storage CCS projects in China. See Appendix C. | ||
Fig. 14 presents summary preliminary cost estimates for 27 projects. For these estimates, we have assumed the base-cost values for injectivity and initial CO2 pressure (Table 4). For the injection well depth, we have assumed the average depth of existing oil/gas wells in each selected basin, based on Li and Lv.27 (see Appendix C). Our assumed base-cost injectivity (3000 tonnes of CO2/day/well for each project) enables all CO2 in a project to be injected via a single well in most cases.
Eighteen of the projects have saline aquifers within 10 km of the source, so that total CCS costs are 9.0 to 12.6 $/tonne CO2. As detailed in Appendix C, compression accounts for most of the cost in these cases. The 10-year net present value (NPV) cost of these projects (using Model B and a discount rate of 8.5%) ranges from $88.5 million for the project with one of the smallest annual CO2 storage rates (1.08 million tonnes of CO2/year) to $1.15 billion for the project with the largest storage rate (19. 0 million tonnes of CO2/year). Another five projects are within 50 km of a saline aquifer. The additional pipeline distance adds about 1 $/tonnes CO2 to the transportation costs. Three more projects are within 100 km, and 1 project is within 150 km of an aquifer. For each of these last nine projects, the NPV project costs range from $92.3 to $209.4 million, and the levelized cost for CO2 capture and storage ranges from $10.8/tonne of CO2 to $17.0/tonne of CO2 (Appendix C).
6. Summary and conclusions
This paper has analyzed potential near-term opportunities for mega-scale CCS demonstration projects that might be undertaken in China at relatively low costs by exploiting the unique fact that China has hundreds of existing and planned coal conversion plants that emit pure CO2 streams to the atmosphere as a normal part of their production processes. By-product CO2 at some of these plants might be considered as CO2 sources for CCS demonstration projects. The cost of capturing this CO2 would be much lower than the cost of retrofitting an operating coal-fired power plant to capture its CO2 emissions or the cost of CO2 capture designed into a new coal-fired power plant.For the analysis in this paper, a database of low-cost industrial coal-derived CO2 sources in China was built, including 310 operating plants producing NH3 (75.1 million tonnes CO2/year total estimated emissions) and 88 plants at different phases of construction for methanol or liquid hydrocarbon fuels production (195.4 million tonnes of CO2 emissions per year, once all are operating). Of the 398 industrial CO2 sources the 27 largest of the currently operating, being constructed, or planned facilities (each having emissions of more than one million tonnes CO2/year) were selected for further analysis.
Potential CO2 sinks were identified through literature review and discussion with geological experts in China. However, detailed assessment of these reservoirs is needed to gain confidence that they are indeed suitable for storage. In particular, “bottom-up” estimates of geological storage capacity and estimated costs of storage in different reservoirs are needed. Such an assessment for the US, to be carried out by 2012/2013, is authorized in the Waxman/Markey legislation that was passed by the US Congress’ House of Representatives in 2009.
Saline aquifer storage was emphasized in this study. The 27 largest CO2 sources identified as potential candidates for CCS projects were mapped along with existing saline aquifers and oil fields to identify possible source–sink matches. Twenty-three of the source–sink pairs were less than 50 km apart. The Ordos Basin contains 9 candidate projects. The Huabei region contains a large number of NH3 plants and also prospective aquifer and oil field storage sites.
Total costs for CCS projects were estimated on a preliminary basis using two cost models adapted from the literature. Our cost estimates assume “Nth plant” CCS systems. That is, we do not consider any cost or risk premiums that might be involved in deploying and operating CCS systems before a CCS industry has been commercially established. Our estimates can thus be considered to represent the commercial costs for CCS.
For 18 projects where the CO2 source is within 10 km of a sink, the estimated total cost of CCS was between $9.0/tonne of CO2 and $12.6/tonne of CO2. The highest cost estimate among all 27 evaluated projects was less than $21/tonne of CO2. The NPV cost for the projects ranged from $89 million to $1.15 billion, but more than 75% of the project NPV costs are $200 million or less.
Saline aquifers account for the largest fraction of total estimated geological storage capacity in China. It is highly desirable to ascertain the viability of CO2 storage in saline aquifers, without which CCS will play only a minor role in mitigating the climate impact of coal use in China. So early projects to demonstrate CO2 storage in such aquifers are important.
On the other hand, there is likely to be more industrial enthusiasm for carrying out CO2 storage via EOR, since it is already utilized in some parts of the world and might generate attractive revenue streams from the sale of CO2 to oil field operators. Because CO2 EOR technology is not yet established in the market in China, government support for one or two commercial scale EOR projects is probably needed. Experience in such projects could lead to rapid learning about CCS technologies. Subsequent EOR projects would require government support mainly for monitoring, modeling, and verification that the net injected CO2 (after repeated recycling) is securely stored underground—because revenues are likely to be fully adequate to cover costs.
Our analysis indicates that China is unique in the world as a prospective host for early CCS projects because of the large number of opportunities for projects that involve very low CO2 capture costs. This suggests that there would be mutual value in international cooperation to support CCS demonstration projects in China, including international sharing of the total costs for such demonstrations. Also CO2 EOR expertise in the US and other countries with CO2 EOR experience might be transferred to help CO2 EOR implementation in China's oil fields, and there is likely to be strong international interest in supporting monitoring, modeling, and CO2 storage verification activities for CO2 EOR projects, as well as for aquifer storage projects.
Appendix A: potential mega-scale CO2 sources for CCS demonstration projects in China
| Plant Number | Company | Province | Plant Statusa | Net CO2 stream (kt/year) |
|---|---|---|---|---|
| a O = operating; C = under construction; P = in planning; O&C = partially operating, partially under construction; C&P = initial phases under construction and remaining phases in planning. b The CO2 stream from the same company's 600 kt/y coal-based MeOH plant at the same site has been added to the net CO2 stream from it's NH3 plant. c The National Development and Reform Commission (NDRC) has approved proceeding with a feasibility study for this facility (Ren Xiangkun, Shenhua, personal communication, September 2009). | ||||
| 1 | Shanxi Tianji Coal-Chemical Fertilizer Plant | Shanxi | O | 1470 |
| 2 | Huaihua Corp Huainan Chemical General Plant | Anhui | O&C | 1444b |
| 3 | Shandong Lianmeng Chemical Co., Ltd | Shandong | O | 1419 |
| 4 | Shandong Liaocheng Luxi Chemical Co., Ltd | Shandong | O | 1207 |
| 5 | Longmay Mining Group, Beitai Iron and Steel Group | Heilongjiang | C | 1083 |
| 6 | Shandong Hualu Hengsheng Chemical Co., Ltd | Shandong | O | 1044 |
| 7 | Hebei Zhengyuan Chemical Co., Ltd | Hebei | O | 1025 |
| 8 | Yankuang Yishan Chemical Co., Ltd | Shandong | O | 1021 |
| 9 | Shenhua Coal to Liquid Group | Inner Mongolia | C&P | 2880 |
| 10 | Shenhua Group, Sasol Synfuels International | Ningxia | Pc | 18960 |
| 11 | Zhongtian Hechuang Energy Co., Ltd. | Inner Mongolia | P | 6510 |
| 12 | Yanchang Petroleum Group | Shaanxi | C&P | 4650 |
| 13 | Yankuang Group | Shaanxi | C&P | 3565 |
| 14 | Zhongyuan Dahua Group Co., Ltd, Hebi Coal Industry Group | Henan | C&P | 2875 |
| 15 | Zekai Group Corp. | Inner Mongolia | C | 2790 |
| 16 | Shandong Xinwen Mining Group Co., Ltd. | Xinjiang | P | 2790 |
| 17 | Huaneng Hulunbuir Energy Co., Ltd | Inner Mongolia | C&P | 2790 |
| 18 | Shenhua Group | Inner Mongolia | C | 2790 |
| 19 | Anhui Huainan Chemical Group | Anhui | C | 2635 |
| 20 | Datang International Power Genereation Co., Ltd | Inner Mongolia | C | 2604 |
| 21 | Datong Coal Mine Group Company | Shanxi | C | 1860 |
| 22 | HuaYi Group and Yili Resources | Inner Mongolia | P | 1860 |
| 23 | Hanneng Shuangyashan | Heilongjiang | P | 1860 |
| 24 | Jiutai Energy Group | Inner Mongolia | C | 1860 |
| 25 | Xinjiang Guanghui Industry Co., Ltd. | Xinjiang | C&P | 1860 |
| 26 | Shanxi Lanhua Coal Industry Group | Shanxi | C | 1569 |
| 27 | Shenhua Ningmei Group | Ningxia | O&C | 1318 |
Appendix B: estimated CO2 transport distances to potential sinks by region
| CO2 Source # | Distance/km to onshore saline aquifers | Distance/km to onshore oil fields | ||||||
|---|---|---|---|---|---|---|---|---|
| <50 | 50–100 | 100–150 | >150 | <50 | 50–100 | 100–150 | >150 | |
| Huabei Region | ||||||||
| 6 | ✓ | ✓ | ||||||
| 7 | ✓ | ✓ | ||||||
| 8 | ✓ | ✓ | ||||||
| 14 | ✓ | ✓ | ||||||
| 21 | ✓ | ✓ | ||||||
| 26 | ✓ | ✓ | ||||||
| Ordos Region | ||||||||
| 9 | ✓ | ✓ | ||||||
| 10 | ✓ | ✓ | ||||||
| 11 | ✓ | ✓ | ||||||
| 12 | ✓ | ✓ | ||||||
| 13 | ✓ | ✓ | ||||||
| 18 | ✓ | ✓ | ||||||
| 22 | ✓ | ✓ | ||||||
| 24 | ✓ | ✓ | ||||||
| 27 | ✓ | ✓ | ||||||
| Dongbei Region | ||||||||
| 5 | ✓ | ✓ | ||||||
| 17 | ✓ | ✓ | ||||||
| 18 | ✓ | ✓ | ||||||
| 20 | ✓ | ✓ | ||||||
| 23 | ✓ | ✓ | ||||||
| Yuwan Region | ||||||||
| 2 | ✓ | ✓ | ||||||
| 19 | ✓ | ✓ | ||||||
| Xinjiang Region | ||||||||
| 16 | ✓ | ✓ | ||||||
| 25 | ✓ | ✓ | ||||||
Appendix C1: Summary of preliminary cost estimates (2007 US$) for potential CCS projects in Chinaa
| Plant Number | Pipeline Distance/km | Well Depth/km | Specific Cost ($/tCO2, Model B) | Capital Investment (million $) | NPV Cost (million $)b | |||
|---|---|---|---|---|---|---|---|---|
| Capital | O&M | Electricity | Total | |||||
| a For all cases the assumed injectivity is 3000 tonnes/well/day. b Assuming 10-year project life (starting in 2010) and 8.5% discount rate. | ||||||||
| 4 | 10 | 2608 | 2.6 | 0.46 | 7.9 | 11.0 | 37.1 | 103 |
| 3 | 10 | 2608 | 2.9 | 0.50 | 7.9 | 11.3 | 35.1 | 114 |
| 6 | 10 | 2608 | 2.9 | 0.51 | 7.9 | 11.4 | 34.6 | 92 |
| 2 | 10 | 2010 | 3.2 | 0.55 | 7.9 | 11.7 | 32.2 | 112 |
| 5 | 10 | 1187 | 4.0 | 0.66 | 7.9 | 12.6 | 27.5 | 88 |
| 11 | 10 | 1438 | 1.2 | 0.25 | 7.9 | 9.4 | 59.3 | 409 |
| 12 | 10 | 1438 | 1.5 | 0.29 | 7.9 | 9.7 | 50.9 | 302 |
| 13 | 10 | 1438 | 1.8 | 0.34 | 7.9 | 10.1 | 45.3 | 239 |
| 14 | 10 | 2608 | 2.1 | 0.39 | 7.9 | 10.4 | 41.7 | 198 |
| 16 | 10 | 1714 | 2.1 | 0.38 | 7.9 | 10.4 | 40.7 | 193 |
| 19 | 10 | 2010 | 2.2 | 0.40 | 7.9 | 10.5 | 39.9 | 184 |
| 10 | 10 | 1438 | 0.87 | 0.21 | 7.9 | 9.0 | 137. | 1149 |
| 9 | 10 | 1438 | 2.1 | 0.37 | 7.9 | 10.4 | 41.1 | 198 |
| 21 | 10 | 2608 | 2.8 | 0.48 | 7.9 | 11.2 | 34.5 | 137 |
| 22 | 10 | 1438 | 3.5 | 0.52 | 7.9 | 11.9 | 40.8 | 144 |
| 24 | 10 | 1438 | 2.8 | 0.48 | 7.9 | 11.2 | 34.5 | 137 |
| 25 | 10 | 2094 | 2.8 | 0.49 | 7.9 | 11.2 | 34.8 | 137 |
| 27 | 10 | 1438 | 3.5 | 0.59 | 7.9 | 12.0 | 29.8 | 103 |
| 7 | 50 | 2608 | 3.8 | 0.59 | 7.9 | 12.3 | 40.0 | 97 |
| 17 | 50 | 1368 | 2.5 | 0.41 | 7.9 | 10.9 | 46.9 | 199 |
| 18 | 50 | 1438 | 2.5 | 0.41 | 7.9 | 10.9 | 46.9 | 200 |
| 20 | 50 | 1181 | 2.7 | 0.43 | 7.9 | 11.0 | 45.7 | 188 |
| 23 | 50 | 1187 | 2.9 | 0.50 | 7.9 | 11.3 | 35.5 | 138 |
| 1 | 100 | 2608 | 4.1 | 0.56 | 7.9 | 12.6 | 52.4 | 134 |
| 15 | 100 | 1334 | 3.2 | 0.45 | 7.9 | 11.6 | 56.1 | 209 |
| 26 | 100 | 2608 | 5.2 | 0.69 | 7.9 | 13.8 | 48.4 | 137 |
| 8 | 150 | 2608 | 8.1 | 1.0 | 7.9 | 17.0 | 46.7 | 107 |
Appendix C2: Summary of cost estimation (2007 US$) for potential early CCS action projects in China
| Plant number | Specific Cost ($/tonne of CO2, Model A) | Specific Cost ($/tonne of CO2, Model B) | ||||||
|---|---|---|---|---|---|---|---|---|
| Compression | Transport | Storage | Total | Compression | Transport | Storage | Total | |
| 1 | 10.2 | 3.4 | 0.22 | 13.8 | 10.2 | 1.7 | 0.64 | 12.6 |
| 2 | 10.7 | 0.31 | 0.27 | 11.3 | 10.7 | 0.23 | 0.81 | 11.7 |
| 3 | 10.4 | 0.27 | 0.25 | 10.9 | 10.4 | 0.19 | 0.72 | 11.3 |
| 4 | 10.2 | 0.21 | 0.18 | 10.6 | 10.2 | 0.16 | 0.63 | 11.0 |
| 5 | 11.3 | 0.38 | 0.34 | 12.0 | 11.3 | 0.25 | 1.1 | 12.6 |
| 6 | 10.4 | 0.28 | 0.26 | 11.0 | 10.4 | 0.20 | 0.75 | 11.4 |
| 7 | 10.5 | 1.8 | 0.28 | 12.6 | 10.5 | 1.0 | 0.80 | 12.3 |
| 8 | 11.4 | 8.5 | 0.44 | 20.4 | 11.4 | 4.3 | 1.3 | 17.0 |
| 9 | 9.8 | 0.20 | 0.14 | 10.2 | 9.8 | 0.15 | 0.42 | 10.4 |
| 10 | 8.9 | 0.06 | 0.07 | 9.0 | 8.9 | 0.03 | 0.12 | 9.0 |
| 11 | 9.1 | 0.12 | 0.11 | 9.3 | 9.1 | 0.08 | 0.24 | 9.4 |
| 12 | 9.3 | 0.15 | 0.12 | 9.6 | 9.3 | 0.09 | 0.29 | 9.7 |
| 13 | 9.6 | 0.18 | 0.15 | 9.9 | 9.6 | 0.1 | 0.38 | 10.1 |
| 14 | 9.8 | 0.2 | 0.47 | 10.2 | 9.8 | 0.12 | 0.47 | 10.4 |
| 15 | 9.8 | 2.8 | 0.15 | 12.8 | 9.8 | 1.3 | 0.43 | 11.6 |
| 16 | 9.8 | 0.21 | 0.15 | 10.2 | 9.8 | 0.13 | 0.44 | 10.4 |
| 17 | 9.8 | 1.3 | 0.15 | 11.3 | 9.8 | 0.61 | 0.43 | 10.9 |
| 18 | 9.8 | 1.3 | 0.15 | 11.3 | 9.8 | 0.61 | 0.43 | 10.9 |
| 19 | 9.9 | 0.22 | 0.17 | 10.3 | 9.9 | 0.13 | 0.48 | 10.5 |
| 20 | 9.9 | 1.3 | 0.15 | 11.4 | 9.9 | 0.65 | 0.45 | 11.0 |
| 21 | 10.4 | 0.27 | 0.21 | 10.8 | 10.4 | 0.19 | 0.63 | 11.2 |
| 22 | 10.4 | 1.7 | 0.21 | 12.2 | 10.4 | 0.92 | 0.63 | 11.9 |
| 23 | 10.4 | 0.27 | 0.25 | 10.9 | 10.4 | 0.23 | 0.72 | 11.3 |
| 24 | 10.4 | 0.27 | 0.21 | 10.8 | 10.4 | 0.19 | 0.63 | 11.2 |
| 25 | 10.4 | 0.27 | 0.23 | 10.9 | 10.4 | 0.19 | 0.67 | 11.2 |
| 26 | 10.6 | 4.1 | 0.29 | 15.0 | 10.6 | 2.3 | 0.85 | 13.8 |
| 27 | 10.9 | 0.34 | 0.29 | 11.6 | 10.9 | 0.21 | 0.89 | 12.0 |
Acknowledgements
The authors thank Stephen Wittrig, Xiangkun Ren, Michael Desmond, and Xiaochun Li for helpful discussions in the course of this research. We also thank Zhe Zhou, Jianyun Zhang and Dongjie Zhang at the Tsinghua-BP Clean Energy Center for their support in the development of the databases presented in this paper. For financial support, the authors thank the national research project of China under contract 2005CB221207, the Carbon Mitigation Initiative (at Princeton University supported by BP and Ford), The William and Flora Hewlett Foundation, and NetJets, Inc.References
- IPCC (Intergovernmental Panel on Climate Change), CO2 Capture and Storage, a Special Report of the Intergovernmental Panel on Climate Change, Cambridge University Press, Cambridge, 2005 Search PubMed.
- Joint Statement by the G8 Energy Ministers and the European Energy Commissioner, July 2009, http://www.g8italia2009.it/static/G8_Allegato/Energia%2030.pdf.
- K. C. Meng, R. H. Williams and M. A. Celia, Opportunities for Low-cost CO2 Storage Demonstration Projects in China, Energy Policy, 2007, 35, 2368–2378 CrossRef.
- T. G. Kreutz, E. D. Larson, R. H. Williams, and G. Liu., “Fischer–Tropsch Fuels from Coal and Biomass,” Proceedings of 25th Annual International Pittsburgh Coal Conference, Pittsburgh, PA, 29 Sept–2 Oct, 2008 Search PubMed.
- Editorial Committee of Almanac of China's Economy, Almanac of China's Economy 2008, Almanac of China's Economy Press, Beijing, pp. 243–244, 2009 Search PubMed.
- J. Wang, Present Situation and Development Prospect of Synthesis of Ammonia by Coal Making Gas Technology, Guangzhou Chemical Industry and Technology, 2006, 34, 9–12 Search PubMed (in Chinese).
- IEA (International Energy Agency), IEA GHG CO2 Emissions Database v.2006, Cheltenham, 2006 Search PubMed.
- Wuhan Wu Huan Science and Technology Co., Ltd, “Feasibility Study of Hegang Coal Gasification Based One Million t Urea Project,” 06018-FP08-01G, Wuhan, 2008.
- E. D. Larson and T. Ren, Synthetic Fuel Production by Indirect Coal Liquefaction, Energy Sustainable Dev., 2003, 7, 79–102 Search PubMed.
- Editorial Committee of Almanac of China's Economy, Almanac of China's Economy 2007, Almanac of China's Economy Press, Beijing, pp. 200–201, 2009 Search PubMed.
- China Coal Chemical Industry, http://www.chinacoalchem.com/.
- Shanxi Yangmei Fengxi Fertilizer Industry Co., Ltd., http://www.fengxi.com.cn/.
- Hebei Zhengyuan Chemical Co., Ltd., http://www.chemyq.com/hebzy/.
- Shandong Luxi Chemical Co., Ltd., http://lxhg.olc.cn/CSS/5181/HomePage.asp.
- Shaanxi Tianji Coal Chemical Co., Ltd., http://www.tianjigroup.com/.
- Shandong Lianmeng Chemical Group Co., Ltd., http://www.leaguechem.com/.
- Shandong Hualu Hengsheng Group Co., Ltd., http://www.hl-hengsheng.com/.
- The People's Government of Huainan, Chinese Government, http://www.huainan.gov.cn/hnzfw/template/hnzfw/narticlecontent.jsp%3Fid%3D30941/.
- Yankuang Lunan Group, http://www.lunangroup.com/.
- National Development and Reform Comission, Chinese Government, http://zfxxgk.ndrc.gov.cn/PublicItemView.aspx%3FItemID%3D%7B0bcf5b6d-bcef-4b2c-9519-09665b777213%7D.
- X. Li, N. Wei, Y. Liu., Z. Fang, R. T. Dahowski, C. L. Davidson, “CO2 Point Emission and Geological Storage Capacity in China”, Proceedings of the 9th International Conference on Greenhouse Gas Control Technologies, Elsevier Energy Procedia, 2008 Search PubMed.
- X. Li, Y. Liu, B. Bai and Z. Fang, Ranking and Screening of CO2 Saline Aquifer Storage Zones in China, Chinese Journal of Rock Mechanics and Engineering, 2006, 25, 963–968 Search PubMed.
- Y. Liu, X. Li, Z. Fang and B. Bai, Preliminary Estimation of CO2 Storage Capacity in Gas Fields in China, Journal of Rock and Soil Mechanics, 2006, 27, 2277–2281 Search PubMed.
- Y. Liu, X. Li and B. Bai, Preliminary Estimation of CO2 Storage Capacity of Coalbeds in China, Chinese Journal of Rock Mechanics and Engineering, 2005, 24, 2947–2952 Search PubMed.
- H. Yu, “Study of Characteristics and Prediction of CH4, CO2, N2 and Binary Gas Adsorption on Coals and CO2/CH4 Replacement” PhD Dissertation, College of Chemical and Environmental Engineering, Shandong University of Science and Technology, 2005, pp. 159–170 Search PubMed.
- N. Spycher and K. Pruess, CO2-H2O mixtures in the Geological Sequestration of CO2. II. Partitioning in Chloride Brines at 12–100 °C and up to 600 bar, Geochim. Cosmochim. Acta, 2005, 69(13), 3309–3320 CrossRef CAS.
- G. Li and M. Lv., Atlas of China's Petroliferous Basins, 2nd Edition, Oil Industry Press, Beijing, 2002 Search PubMed.
- D. L. McCollum and J. M. Ogden., “Techno-Economic Models for Carbon Dioxide Compression, Transport and Storage & Correlations for estimating Carbon Dioxide Density and Viscosity,” UCD-ITS-RR-06-14, University of California, Davis, 2006 Search PubMed.
- S. T. McCoy., “The Economics of CO2 Transport by Pipeline and Storage in Saline Aquifers and Oil Reservoirs,” PhD Dissertation, Department of Engineering and Public Policy, Carnegie Mellon University, 2008.
- H. Huang, F. He, Z. Li, W. Ni, J. He, X. Zhang and L. Ma, Integrated Gasification Combined Cycle Economic Estimation Model of China, Journal of Power Engineering, 2008, 28, 633–638 Search PubMed (in Chinese).
- H. Huang, F. He, Z. Li, W. Ni, J. He, X. Zhang and L. Ma, Research on IGCC EPC Estimation Model of China, Journal of Power Engineering, 2008, 28, 476–479 Search PubMed (in Chinese).
- Chemical Engineering Magazine. See http://www.che.com/pci/.
- Energy Information Administration, US Department of Energy, http://www.eia.doe.gov/cneaf/electricity/epm/table5_3.html.
- State Electricity Regulatory Commission, Chinese Government, http://www.serc.gov.cn/zwgk/jggg/200809/W020080912334874610579.doc/.
Footnotes |
| † To illustrate, a byproduct of the production of about 140000 barrels per day of synthetic liquids (3/4 fuels,1/4 chemicals) from coal by Sasol at its two Secunda plants in South Africa is the production of streams of pure CO2 that are vented at a rate of 20 million tonnes per year1—making this the largest point source of pure CO2 emissions on the planet. |
| ‡ In 2007, China produced nearly 42 million tonnes of nitrogen contained in ammonia fertilizer.5 More than 60% of all ammonia production capacity (as of 20066) was based on coal gasification. The remaining capacity was based on use of natural gas or oil residues. Less pure CO2 is emitted from natural gas-fed ammonia plants compared with coal-fed plants. |
| § CO2 can be separated from gaseous mixtures using a variety of processes. Processes that absorb CO2 in a physical solvent are favored for removal when the mixture is available at elevated pressures. Differences in the solubility of different gases under different temperature and/or pressure conditions help determine the choice of the solvent to be used in such cases. Two common solvents are Rectisol (chilled methanol) and Selexol [dimethyl ethers of poly(ethylene glycol)]. Typically, large coal-to-chemicals or fuels projects adopt Rectisol-type technology. Smaller projects tend to use the Selexol-type technology. |
| ¶ The EF for an ammonia plant depends slightly on the gasification technology used. Meng et al.3 indicate 3.16 tonnes CO2/tonne NH3 for ammonia plants using a Texaco (GE) gasifer and 3.34 tonnes CO2/tonne NH3 with a Shell gasifer. The International Energy Agency uses 3.8 tonnes CO2/tonne NH3 regardless of gasifer design.7 Since, as Meng et al. have shown, differences in EF among gasifier types are small, we assume for simplicity the same EF for all plants, regardless of design. Our EF estimate is from a feasibility study for a Chinese coal-to-ammonia plant using a Shell gasifer.8 |
| || This emission factor for direct coal liquefaction plants is based on discussions with Ren Xiangkun, Shenhua Coal to Liquid Group (Sept. 2009). Most of the CO2 streams are from the gasification-based production of the H2 used to liquefy coal and hydrogenate the raw oil in the direct-coal-liquefaction plant. |
| ** Nearly all of the ammonia plants in this study (306 out of 310) are operating plants. Most of the coal-to-methanol plants (84 out of 88) and all of the coal-to-liquids plants are at different phases of construction. Plants producing chemicals/fuels other than ammonia, methanol, and hydrocarbon fuels are not included in our analysis. |
| †† Li, personal communication, April 2009. |
| ‡‡ Michael Desmond, BP, personal communication, February 2009. |
| §§ Both of the original models include costs for boost compression along the length of the pipeline and boost compression at the injection point. Our calculations assume compression to 150 bar at the plant gate, which obviates the need for boost compressors in the pipeline or at the injection point. We have adjusted the original models accordingly. |
| ¶¶ This is an estimate based on discussions with experts in China. It is supported by an estimate in the literature4 indicating that 1/3 of the CO2 captured by a Rectisol® system can be made available at 3 bar, with the remainder available at 1.2 bar, or a weighted average of 1.8 bar for the full CO2 stream. |
| This journal is © The Royal Society of Chemistry 2010 |