Optimization of ultrasound-assisted extraction of cyanidin 3-rutinoside from litchi (Lichi chinensis Sonn.) fruit pericarp
Guohua
Rao
*
Technology Center, China Tobacco Guangdong Industry Co., Ltd, Guangzhou, 510145, China. E-mail: raosir_6@126.com; Fax: +86 20 81829819; Tel: +86 20 81812508
First published on 28th June 2010
Abstract
Cyanidin 3-rutinoside is an important anthocyanin which has good antioxidant activity and beneficial health effects. It was prepared from litchi fruit pericarp by ultrasound-assisted extraction and purified in this work. A mathematical model was built between ultrasonic power, time, ethanol concentration and cyanidin 3-rutinoside yield. The R2, P-values of model and “lack of fit” indicated the high fitness of the model to true behavior. Every factor showed evident effects and interactions on the cyanidin 3-rutinoside yield. The optimal conditions to obtain the highest yield of cyanidin 3-rutinoside were 240 W of ultrasonic power, 34.5 min of ultrasonic time and 54.1% of ethanol concentration. The predicted yield of cyanidin 3-rutinoside was not significantly (p > 0.05) different to the practical value conducted under optimal conditions.
Introduction
Anthocyanins are a group of natural phenolics responsible for the pigment of many vegetables and fruits.1 This type of natural colorant is actively investigated due to the growing interest for substituting synthetic colorants.2 Anthocyanins are water-soluble and harmless, and are responsible for the shiny orange, pink, red, violet and blue colours of some flowers and fruits. Besides their role as a food colorant source, they have attracted considerable interest due to their antioxidant activities and health benefits, including anticancer, anti-inflammatory and vasoprotective properties.3 They are widely ingested by humans with a daily intake around 180 mg day−1, mainly derived from fruits and red wines.4 This level is much higher than the intake (23 mg day−1) estimated for other flavonoids, including quercetin and myricetin.Response surface methodology is a statistically experimental protocol that is useful for mathematical modeling.5 It can quantify the correlation between the independent input parameters and dependent response.6 Moreover, this multi-variable method reduces the experiment number, improving the statistical interpretation possibility and indicating the interaction between variables.7 Compared to other statistical software, for example the neural network toolbox MATLAB, the response surface methodology can give a mathematical equation. It is helpful to calculate the response value when different levels of variables are set. Box–Behnken design is a widely used protocol in response surface methodology. The combination of processing parameters can be optimized through this technique and a high efficiency can be obtained.8
Litchi is a tropical to subtropical crop that originates in Southeast Asia. It is now grown commercially in many countries worldwide. Large amounts of bioactive substances have been detected in litchi pericarp, such as polysaccharides and flavanols.9 There is also some literature regarding the anthocyanins of litchi pericarp.10,11 However, publications concerning ultrasound-assisted extraction of cyanidin 3-rutinoside from litchi pericarp are still limited. In this work, ultrasound was applied to extract cyanidin 3-rutinoside from litchi pericarp tissues. Response surface methodology with Box–Behnken composite design was used to optimize the extraction conditions. Analysis of variation was taken to calculate the significance of mathematical model between ultrasonic variables and the yield of cyanidin 3-rutinoside. Fig. 1 shows the structure of cyanidin 3-rutinoside.
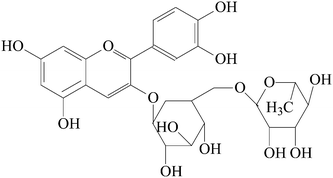 | ||
| Fig. 1 The chemical structure of cyanidin 3-rutinoside. | ||
Results and discussion
Effects of ultrasonic power, time and ethanol concentration on the yield of cyanidin 3-rutinoside
The effects of ultrasonic power, time and ethanol concentration on the yield of cyanidin 3-rutinoside extracted from litchi pericarp tissues as well as their interactions are shown in Fig. 2–4. From the results obtained, it was apparent that each variable played an important role in the preparation of cyanidin 3-rutinoside. Fig. 2 shows the mutual effects of ethanol concentration and ultrasonic power when the ultrasonic time was kept constantly at 32.5 min. The yield of cyanidin 3-rutinoside increased gradually with the increase of ethanol concentration to a certain value (ca. 50%), thereafter decreased. This indicated that a low ethanol concentration is suitable for the preparation of cyanidin 3-rutinoside. Though ultrasonic power could be observed to have an impact on the cyanidin 3-rutinoside extraction, it was less pronounced than ethanol concentration. An optimal value of ultrasonic power occurred at approximately 210 W, a value at which the highest yield of cyanidin 3-rutinoside could be obtained. Lower or higher than this value leads to a decrease of the yield.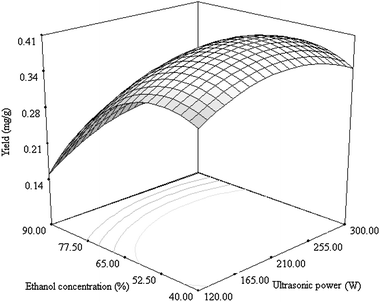 | ||
| Fig. 2 Response surface plot showing the effects of ultrasonic power and ethanol concentration on the yield of cyanidin 3-rutinoside. The time was kept constantly at 32.5 min. | ||
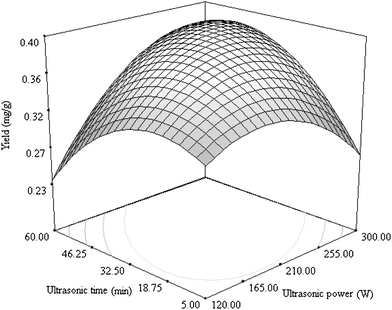 | ||
| Fig. 3 Response surface plot showing the effects of ultrasonic power and time on the yield of cyanidin 3-rutinoside. The ethanol concentration was kept constantly at 65%. | ||
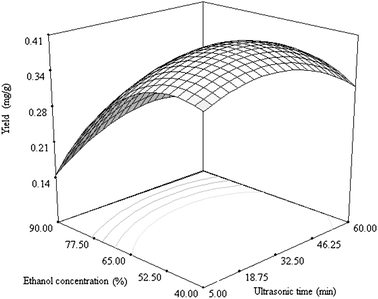 | ||
| Fig. 4 Response surface plot showing the effects of ultrasonic time and ethanol concentration on the yield of cyanidin 3-rutinoside. The ultrasonic power was kept constantly at 210 W. | ||
Fig. 3 shows the interaction between ultrasonic power and time on the yield of cyanidin 3-rutinoside. Ultrasonic time exhibited a similar effect as ultrasonic power. By extending ultrasonic time to approximately 20 min, the yield of cyanidin 3-rutinoside kept increasing. When the value of ultrasonic time was longer than the optimal value, the yield decreased. Considering both the effects of ultrasonic time and power, it is easy to understand that there is an optimal combination to obtain the highest yield of cyanidin 3-rutinoside. Furthermore, a special interaction was observed when the ultrasonic power was close to the lower limit, i.e. the ultrasonic time needed to obtain a higher yield was also close to the lower limit. However, when a high ultrasonic power close to the higher limit was set, a longer ultrasonic time was needed for a higher yield.
In Fig. 4, the interaction between ethanol concentration and ultrasonic time was similar to that between ethanol concentration and ultrasonic power. The effect of ethanol concentration on the yield of cyanidin 3-rutinoside was obviously stronger than ultrasonic time. From the contour plots shown in Fig. 2–4, the elliptical contour plot indicates that the interactions between ultrasonic power, time and ethanol concentration are significant.
Ultrasound treatment has been widely employed to prepare bioactive substances from different plant materials.12 The mechanism of ultrasonic extraction involves two processes of physical activity: the dissolution of the extractive substances near the particle surface (rinsing) and the diffusion from the solid particles to the bulk of the liquid extract (slow extraction).13 The mechanical effects produced by an ultrasonic wave can facilitate mass transfer between immiscible phases via super agitation at low frequency.14
Ultrasound treatment is a time-saving extraction method compared with classic extraction, like maceration.15 The latter usually takes 12 h for extraction. The concentration gradient between the solvent and material is responsible for the leaching of cyanidin 3-rutinoside. Ultrasound treatment can help to destroy the plant cell by cavitation and evidently increases the release rate of extractives. This explains why less than one hour is sufficient for ultrasound-assisted extraction of cyanidin 3-rutinoside in this work. As can be seen in Fig. 3, when the ultrasonic time or power was too high, the yield of cyanidin 3-rutinoside decreased. A possible mechanism should be the degradation of anthocyanin by ultrasound treatment. Anthocyanins are relatively unstable due to their degradation or the formation of condensed polymers.16 Analysis of anthocyanin metabolites showed that their degradation included deglycosylation, O-demethylation and C-ring cleavage.17 It has been pointed out that a sonochemical technique is potentially useful in natural product chemistry. The easy formation of a transient reactive species can induce the degradation or re-association of natural products.18 Furthermore, ultrasound can facilitate the conjugation between molecules. Induction of anthocyanins to conjugate with macromolecules can also decrease the yield in the extract.
Ethanol concentration was the most important factor for cyanidin 3-rutinoside extraction among three factors analysed. Based on the rule of similarity, there is an optimal ethanol concentration to match the polarity of cyanidin 3-rutinoside. Changes in the ethanol concentration modifies the polarity of the solvent system, which further affects the release of cyanidin 3-rutinoside from litchi fruit pericarp tissues. As mentioned by Cacace and Mazza,19 diffusion coefficients of both anthocyanin and total phenolics increased with ethanol concentration from 39% to 67%, then decreased with further increase of ethanol concentration from 67% to 95%. Diffusion coefficient and solubility are two critical parameters affecting extract recovery.
Model fit and optimisation
The mathematical model representing the yield of cyanidin 3-rutinoside as a function of the independent variables within the region under investigation is expressed by the following eqn (1):| Y = 0.39 + 0.023X1 + 0.0075X2 − 0.078X3 + 0.047X1X2 + 0.013X1X3 + 0.027X2X3 − 0.043X12 − 0.048X22 − 0.083X32 | (1) |
Optimising a fitted model may produce misleading results if the model exhibits a bad fit to the true behavior. Thus, it is necessary to check model adequacy.20 A relatively low coefficient of variation shows better precision and good reliability with the experimental results. The coefficient of variation was determined to be 19.3%. The model P-value of the yield of cyanidin 3-rutinoside was 0.049 (Table 1), which indicated that model fitness was significant. Meanwhile, the P-value of “lack of fit” was 0.054, which is not significant. The P-values of ultrasonic power, time and ethanol concentration were 0.32, 0.73 and 0.008, respectively, indicating that the effects on cyanidin 3-rutinoside yield decreased in the order, ethanol concentration > ultrasonic power > ultrasonic time. This result is consistent with the profiles shown in Fig. 2–4.
| Source | Degrees of freedom | Sum of squares | Mean square | F-value | P-value |
|---|---|---|---|---|---|
| a significant at p < 0.05. | |||||
| Model | 9 | 0.12 | 0.013 | 3.69 | 0.0496a |
| X1 | 1 | 0.004 | 0.004 | 1.16 | 0.32 |
| X2 | 1 | 0.0005 | 0.0005 | 0.13 | 0.73 |
| X3 | 1 | 0.048 | 0.048 | 13.74 | 0.008a |
| X1X2 | 1 | 0.009 | 0.009 | 2.58 | 0.15 |
| X1X3 | 1 | 0.0006 | 0.0006 | 0.18 | 0.68 |
| X2X3 | 1 | 0.003 | 0.003 | 0.86 | 0.38 |
| X12 | 1 | 0.008 | 0.008 | 2.2 | 0.18 |
| X22 | 1 | 0.01 | 0.01 | 2.75 | 0.14 |
| X32 | 1 | 0.029 | 0.029 | 8.24 | 0.02a |
| Residual | 7 | 0.024 | 0.0035 | ||
| Lack of fit | 3 | 0.02 | 0.007 | 6.29 | 0.054 |
| Pure error | 4 | 0.004 | 0.001 | ||
| Total | 16 | 0.14 |
Fig. 5 shows the correlation between predicted and practical values of cyanidin 3-rutinoside yield. Coefficient of determination (R2) is an important parameter for the measurement of the degree of fitness. The model can fit well with the actual data when R2 approaches unity.21 A linear regression equation was drawn as the function of predicted and practical values. By analysing the variance, the R2 value of the model was calculated to be 0.83, which showed that the regression model defined well the true behavior of the extraction system.
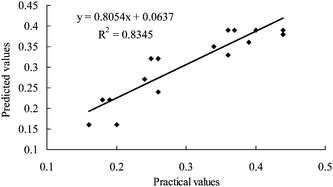 | ||
| Fig. 5 Correlation between practical and predicted values of cyanidin 3-rutinoside yield. | ||
The mathematical model predicts that the optimal conditions to obtain the highest yield of cyanidin 3-rutinoside are 240 W of ultrasonic power, 34.5 min of ultrasonic time and 54.1% of ethanol concentration. The predicted yield of cyanidin 3-rutinoside was 0.49 mg g−1. After applying the optimal conditions experimentally, the yield of cyanidin 3-rutinoside was determined to be 0.51 ± 0.02 mg g−1. This value was not significantly (p > 0.05) different to the predicted value, which indicates that the prediction is practically applicable.
Experimental
Materials
Fresh litchi (Litchi chinensis Sonn.) fruit at the commercially mature stage were purchased from Guangzhou market, China. Fruits were selected in uniformity of size and red colour. The pericarp was peeled and dried in an oven at 50 °C for 12 h. The dry pericarp was pulverized by a miller (400A, Guangzhou Guowei Mechanics Co., Guangzhou, China) into powder, and screened through a 60-mesh steel sieve.Chemicals
Acetonitrile at HPLC grade and cyanidin 3-rutinoside were purchased from Sigma Chemical Co. (St Louis, MO). Isopropanol was purchased from Guangzhou Chemical Co. (Guangzhou, China). All the other chemicals were of analytical grade.Extraction of cyanidin-3-glucoside from litchi pericarp tissues
Litchi pericarp powder (1.0 g) was immersed into 10 ml of aqueous ethanol solution in 1% (w/w) HCl. The extraction process was performed using an ultrasonic cleaner (KQ-300DV, 40 kHz, 240 × 300 mm, Shumei Ultrasonication Equipment Co., Kunshan, China) with different ultrasonic power, time and ethanol concentration. The temperature was set as 30 °C and the material/solvent ratio was 1![[thin space (1/6-em)]](https://www.rsc.org/images/entities/char_2009.gif) :20 (w/v). The extract was filtered through filter paper. The filtrate was added with 20 ml of distilled water, and then extracted by 20 ml of hexane six times to remove hydrophobic impurities. The water fraction was subjected to column chromatography of Amberlite XAD-7, which was eluted by water and methanol sequentially. The methanol fraction was concentrated by a rotary evaporator (RE52AA, Yarong corporation, Shanghai, China) at 40 °C under reduced pressure. It was then subjected to cyanidin 3-rutinoside analysis. The content of cyanidin 3-rutinoside was determined by a Shimadzu HPLC system (Shimadzu, Suzhou, China) equipped with a C18 column (4.6 × 250 mm internal diameter) and a UV detector (SPD-20A, Shimadzu, Suzhou, China). Solvents A and B were acetonitrile and 2% acetic acid, respectively. The elution programme was as follows: 20% solvent B for 3 min, 20%–100% B for 20 min, 100% B for 5 min. The flow rate was set as 1 ml min−1 and the chromatogram was monitored at 280 nm. Cyanidin 3-rutinoside was quantified by external standard method. The yield of cyanidin 3-rutinoside was expressed as mg per gram of litchi pericarp on dry weight basis.
:20 (w/v). The extract was filtered through filter paper. The filtrate was added with 20 ml of distilled water, and then extracted by 20 ml of hexane six times to remove hydrophobic impurities. The water fraction was subjected to column chromatography of Amberlite XAD-7, which was eluted by water and methanol sequentially. The methanol fraction was concentrated by a rotary evaporator (RE52AA, Yarong corporation, Shanghai, China) at 40 °C under reduced pressure. It was then subjected to cyanidin 3-rutinoside analysis. The content of cyanidin 3-rutinoside was determined by a Shimadzu HPLC system (Shimadzu, Suzhou, China) equipped with a C18 column (4.6 × 250 mm internal diameter) and a UV detector (SPD-20A, Shimadzu, Suzhou, China). Solvents A and B were acetonitrile and 2% acetic acid, respectively. The elution programme was as follows: 20% solvent B for 3 min, 20%–100% B for 20 min, 100% B for 5 min. The flow rate was set as 1 ml min−1 and the chromatogram was monitored at 280 nm. Cyanidin 3-rutinoside was quantified by external standard method. The yield of cyanidin 3-rutinoside was expressed as mg per gram of litchi pericarp on dry weight basis.
Box–Behnken composite design
Response surface methodology was employed for experiment design, data analysis and model building with software Design Expert (Trial Version 7.0.3, Stat-Ease Inc., Minneapolis, Minnesota, USA). A Box–Behnken design with three variables was used to establish the model. Three independent variables used in this work were ultrasonic power (X1), time (X2) and ethanol concentration (X3), with three levels for each variable, while the dependent variable was the yield of cyanidin 3-rutinoside. The symbols and levels are shown in Table 2. Three replicates at the central point of the designed model were used to estimate the pure error sum of squares. A quadratic model was used for model construction. It included variables X1, X2, X3, X1X2, X1X3, X2X3, X12, X22, X32. The ultrasonic conditions were optimized to obtain the highest yield of cyanidin 3-rutinoside by this software.| Experiment | Coded levels | Response | |||
|---|---|---|---|---|---|
| X1 | X2 | X3 | Yield of cyanidin 3-rutinoside/mg g−1 | ||
| Ultrasonic power/W | Ultrasonic time/min | Ethanol concentration (%) | Practical values | Predicted values | |
| 1 | 0 (210) | 1 (60) | 1 (90) | 0.18 | 0.22 |
| 2 | 0 (210) | 0 (32.5) | 0 (65) | 0.44 | 0.39 |
| 3 | 0 (210) | 0 (32.5) | 0 (65) | 0.36 | 0.39 |
| 4 | 0 (210) | 0 (32.5) | 0 (65) | 0.40 | 0.39 |
| 5 | 0 (210) | 0 (32.5) | 0 (65) | 0.37 | 0.39 |
| 6 | +1 (300) | 0 (32.5) | −1 (40) | 0.34 | 0.35 |
| 7 | 1 (300) | 0 (32.5) | 1 (90) | 0.19 | 0.22 |
| 8 | −1 (120) | −1 (5) | 0 (65) | 0.25 | 0.32 |
| 9 | 1 (300) | −1 (5) | 0 (65) | 0.24 | 0.27 |
| 10 | −1 (120) | +1 (60) | 0 (65) | 0.26 | 0.24 |
| 11 | 0 (210) | −1 (5) | +1 (90) | 0.20 | 0.16 |
| 12 | −1 (120) | 0 (32.5) | −1 (40) | 0.36 | 0.33 |
| 13 | 1 (300) | 1 (60) | 0 (65) | 0.44 | 0.38 |
| 14 | 0 (210) | +1 (60) | −1 (40) | 0.26 | 0.32 |
| 15 | −1 (120) | 0 (32.5) | +1 (90) | 0.16 | 0.16 |
| 16 | 0 (210) | −1 (5) | −1 (40) | 0.39 | 0.36 |
| 17 | 0 (210) | 0 (32.5) | 0 (65) | 0.37 | 0.39 |
Statistical analysis
All the experiments were done in triplicate. Data were expressed as mean ± standard deviation. Statistical calculations by OriginPro Version 7.5 software (OriginLab Corporation, Northampton, USA) were carried out. One way variance analysis was applied to determine significant difference within a 95% confidence interval.Conclusions
The high yield of cyanidin 3-rutinoside makes litchi fruit pericarp a good source of anthocyanin. A mathematical model was built between the yield of cyanidin 3-rutinoside and extraction variables. Model P-values and “lack of fit” as well as R2 confirmed the model was an excellent fit to the parameters tested. The response surface plot showed that ultrasonic power, time and ethanol concentration had apparent effects on the yield of cyanidin 3-rutinoside. The results of this work can be used during the preparation of anthocyanidin from litchi fruit pericarp tissues, in food and medical applications. Further investigation into the degradation mechanism of cyanidin 3-rutinoside during ultrasound treatment is worthy topic for future work.Acknowledgements
The financial support provided by the Foundation of China Tobacco Guangdong Industry Co. Ltd. (Contract No. 05XM-QK[2009]-002) is appreciated.References
- P. N. Chen, S. C. Chu, H. L. Chiou, W. H. Kuo, C. L. Chiang and Y. S. Hsieh, Cancer Lett., 2006, 235, 248 CrossRef CAS.
- A. Castañeda-Ovando, M. L. Pacheco-Hernández, M. E. Páez-Hernández, J. A. Rodríguez and C. A. Galán-Vidal, Food Chem., 2009, 113, 859 CrossRef CAS.
- L. Longo, A. Scardino and G. Vasapollo, Innovative Food Sci. Emerging Technol., 2007, 8, 360 CrossRef CAS.
- F. Galvano, L. L. Fauci, G. Lazzarino, V. Fogliano, A. Ritieni, S. Ciappellano, N. C. Battistini, B. Tavazzi and G. Galvano, J. Nutr. Biochem., 2004, 15, 2 CrossRef CAS.
- R. Triveni, T. R. Shamala and N. K. Rastogi, Process Biochem., 2001, 36, 787 CrossRef CAS.
- N. Aslan and Y. Cebeci, Fuel, 2007, 86, 90 CrossRef CAS.
- S. Tsapatsaris and P. Kotzekidou, Int. J. Food Microbiol., 2004, 95, 157 CrossRef CAS.
- B. Yang, M. M. Zhao, J. Shi, N. Yang and Y. M. Jiang, Food Chem., 2008, 106, 685 CrossRef CAS.
- M. M. Zhao, B. Yang, J. Wang, Y. Liu, L. M. Yu and Y. M. Jiang, Int. Immunopharmacol., 2007, 7, 162 CrossRef CAS.
- N. Ruenroengklin, J. Sun, J. Shi, S. J. Xue and Y. M. Jiang, Food Chem., 2009, 115, 1253 CrossRef CAS.
- Z. Zhang, X. Pang, X. W. Duan, Z. Ji and Y. M. Jiang, Food Chem., 2005, 90, 47 CrossRef CAS.
- Z. Hromadkova and A. Ebringerova, Ultrason. Sonochem., 2003, 10, 127 CrossRef CAS.
- M. Vinatoru, Ultrason. Sonochem., 2001, 8, 303 CrossRef CAS.
- M. Vinatoru, M. Toma, O. Radu, P. I. Filip, D. Lazurca and T. J. Mason, Ultrason. Sonochem., 1997, 4, 135 CrossRef CAS.
- M. A. Rostagno, M. Palma and C. G. Barroso, J. Chromatogr., A, 2003, 1012, 119 CrossRef CAS.
- N. Ruenroengklin, B. Yang, H. T. Lin, F. Chen and Y. M. Jiang, Food Chem., 2009, 116, 995 CrossRef CAS.
- K. Keppler and H. U. Humpf, Bioorg. Med. Chem., 2005, 13, 5195 CrossRef CAS.
- B. Yang, Y. M. Jiang, M. M. Zhao, J. Shi and L. Z. Wang, Polym. Degrad. Stab., 2008, 93, 268 CrossRef CAS.
- J. E. Cacace and G. Mazza, J. Food Eng., 2003, 59, 379 CrossRef.
- L. Z. Wang, B. Yang, X. Q. Du and C. Yi, Food Chem., 2008, 108, 737 CrossRef CAS.
- H. N. Sin, S. Yusof, N. S. A. Hamid and R. A. Rahman, J. Food Eng., 2006, 73, 313 CrossRef CAS.
| This journal is © The Royal Society of Chemistry 2010 |